Copyright
©The Author(s) 2022.
World J Clin Cases. Mar 6, 2022; 10(7): 2286-2293
Published online Mar 6, 2022. doi: 10.12998/wjcc.v10.i7.2286
Published online Mar 6, 2022. doi: 10.12998/wjcc.v10.i7.2286
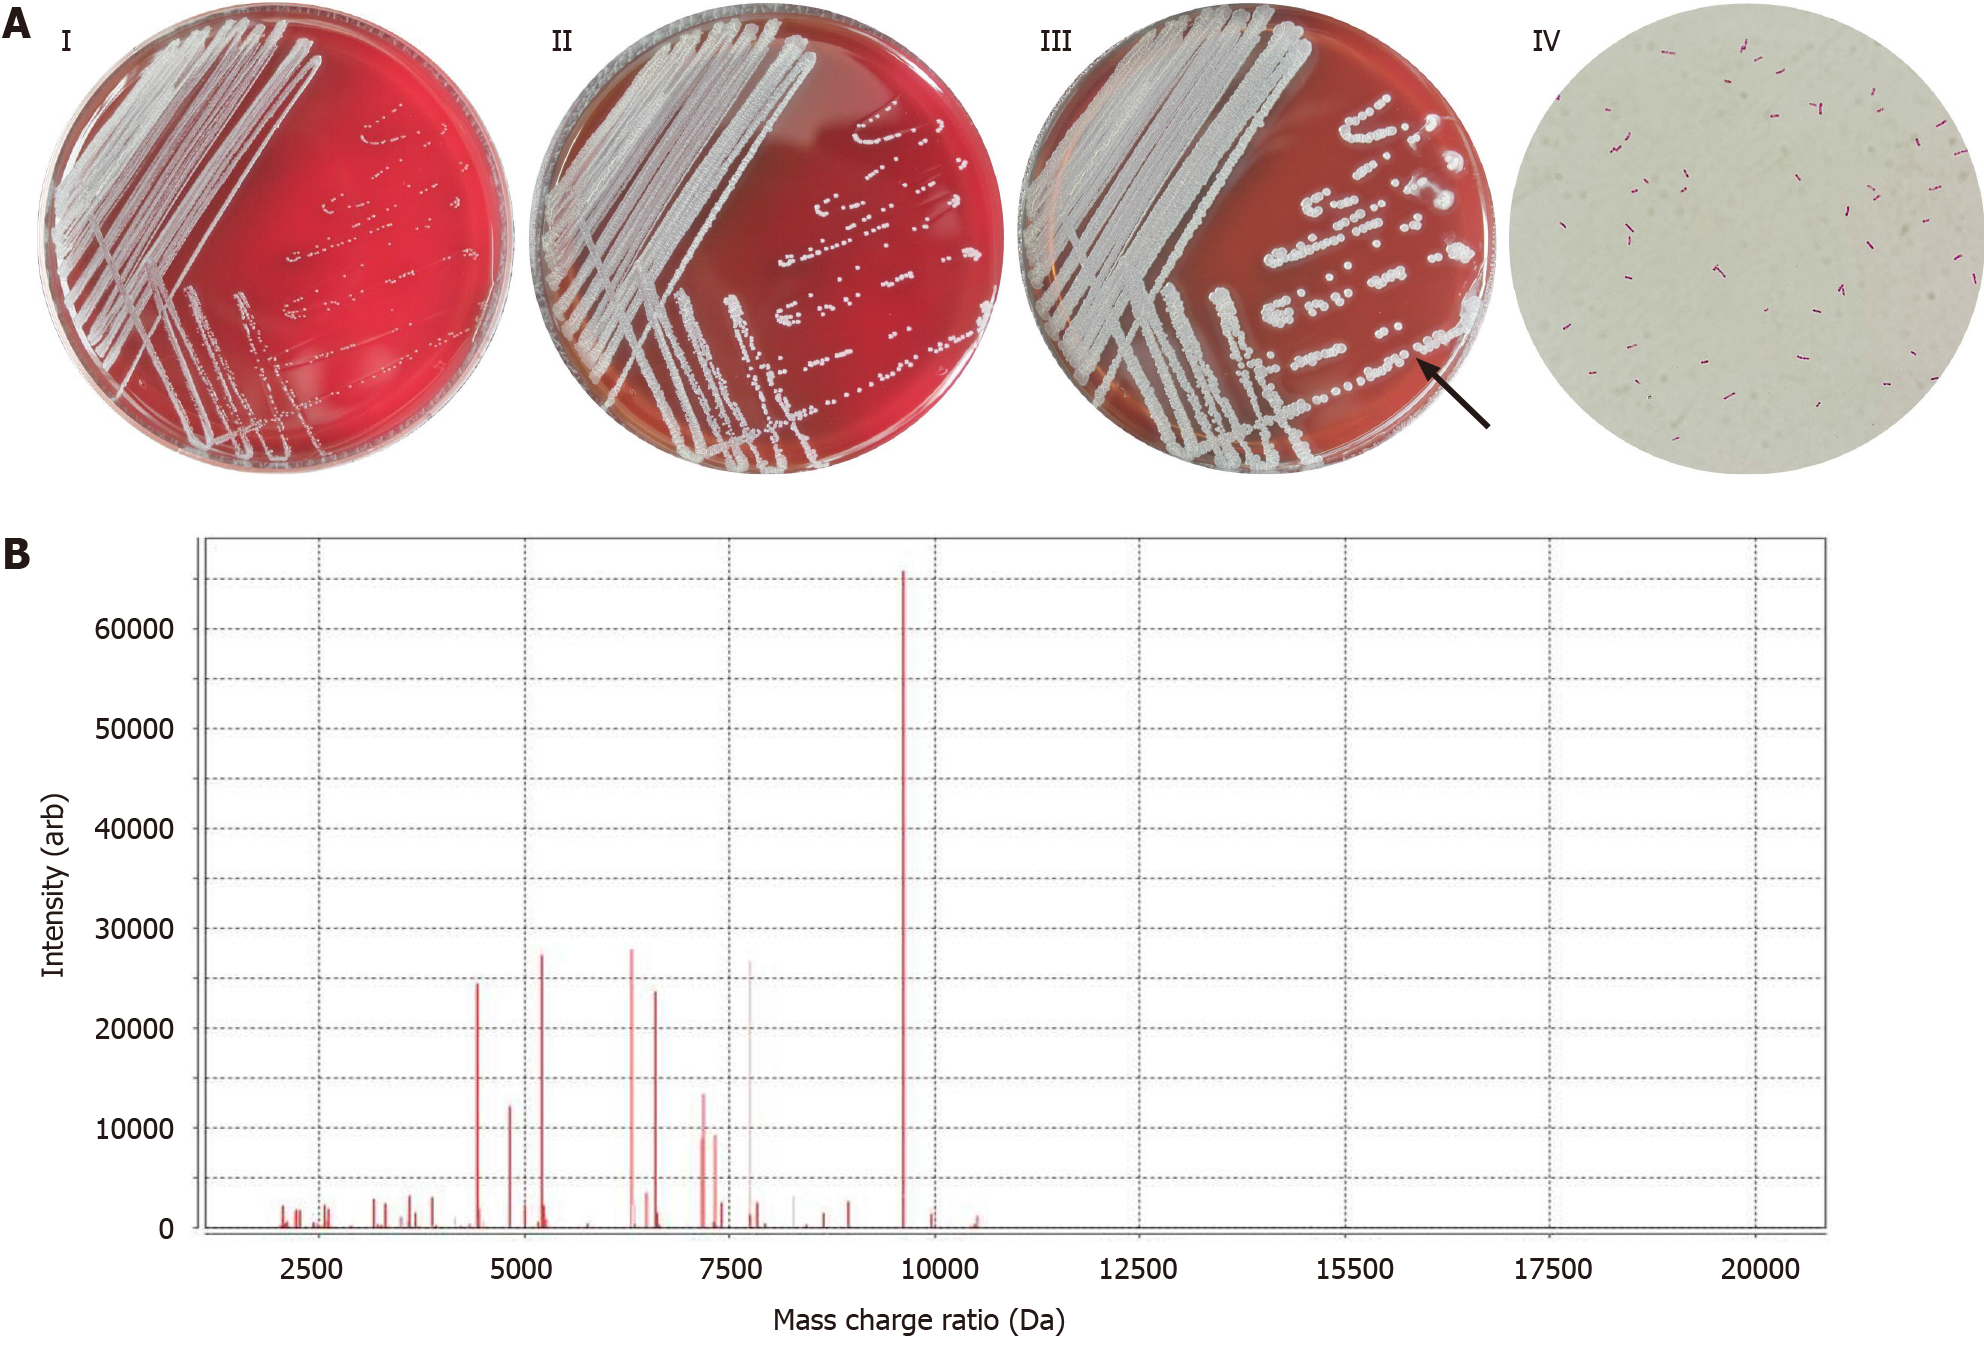
Figure 1 The colony and microscopic morphology of Burkholderia gladioli and the mass spectrogram.
A: The colony and microscopic morphology of B. gladioli; I: Colony growth on a blood agar plate on the first day; II: Colony growth on a blood agar plate on the second day; III: Colony growth on a blood agar plate on the third day, the arrow indicates a single colony; IV: The morphology of the colony was observed under the microscope, microscope magnification: 1000×; B: The mass spectrogram of the strain by matrix-assisted laser desorption/ionization time-of-flight mass technology.
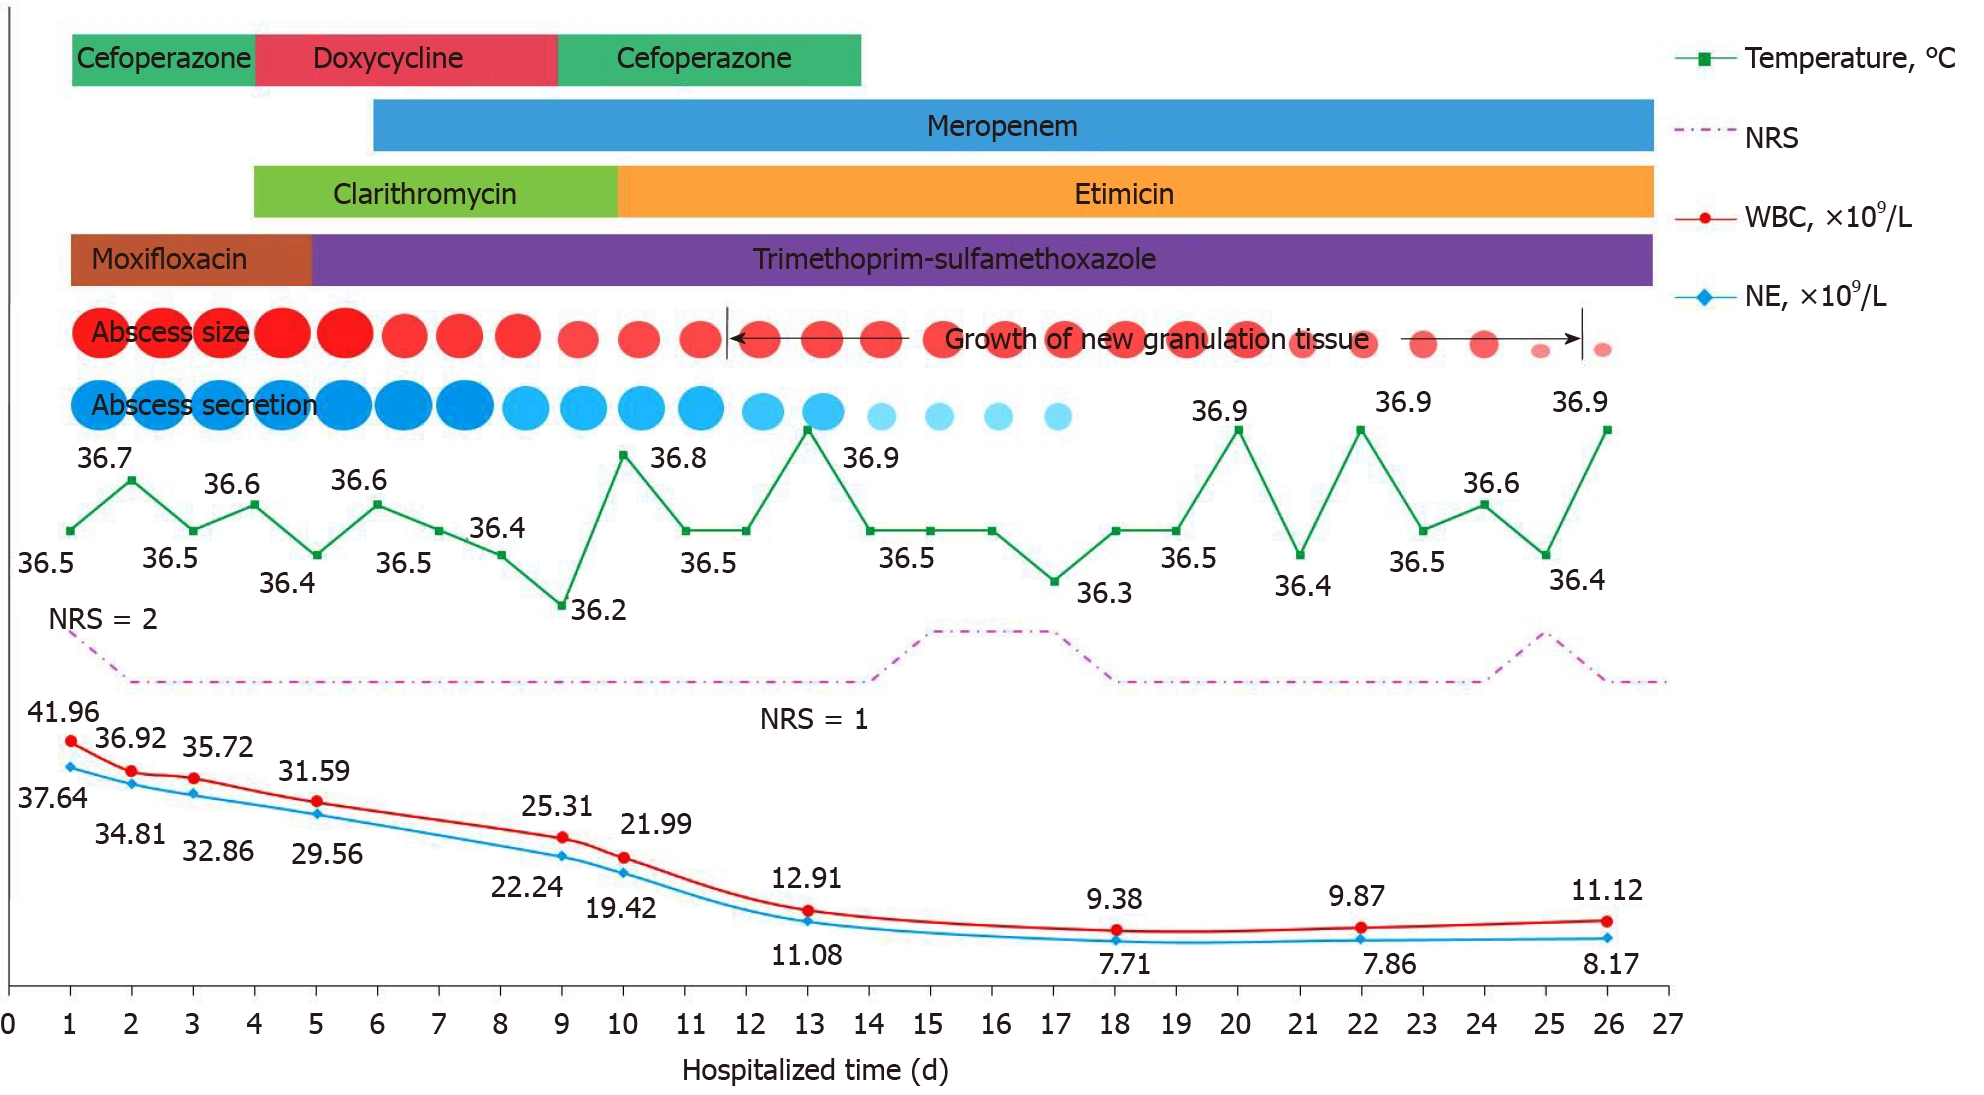
Figure 2 The changes in various indicators during hospitalization of this patient.
Abscess size: the size of the circle represents the size of the abscess, the larger the circle is, the larger the abscess is, the five sizes of the circles represent 4 cm, 3 cm, 2 cm, 1 cm and 2 mm, respectively; Abscess secretion: the size of the circle represents the amount of abscess secretion, the larger the circle is, the more abscess secretion; NRS: Numerical rating scale, this is a numerical scale for pain, in which the number 0-10 is used to indicate the degree of pain; WBC: White blood count; NE: Neutrophil absolute value.
- Citation: Wang YT, Li XW, Xu PY, Yang C, Xu JC. Multiple skin abscesses associated with bacteremia caused by Burkholderia gladioli: A case report. World J Clin Cases 2022; 10(7): 2286-2293
- URL: https://www.wjgnet.com/2307-8960/full/v10/i7/2286.htm
- DOI: https://dx.doi.org/10.12998/wjcc.v10.i7.2286


