Copyright
©The Author(s) 2022.
World J Clin Cases. Dec 16, 2022; 10(35): 13006-13014
Published online Dec 16, 2022. doi: 10.12998/wjcc.v10.i35.13006
Published online Dec 16, 2022. doi: 10.12998/wjcc.v10.i35.13006
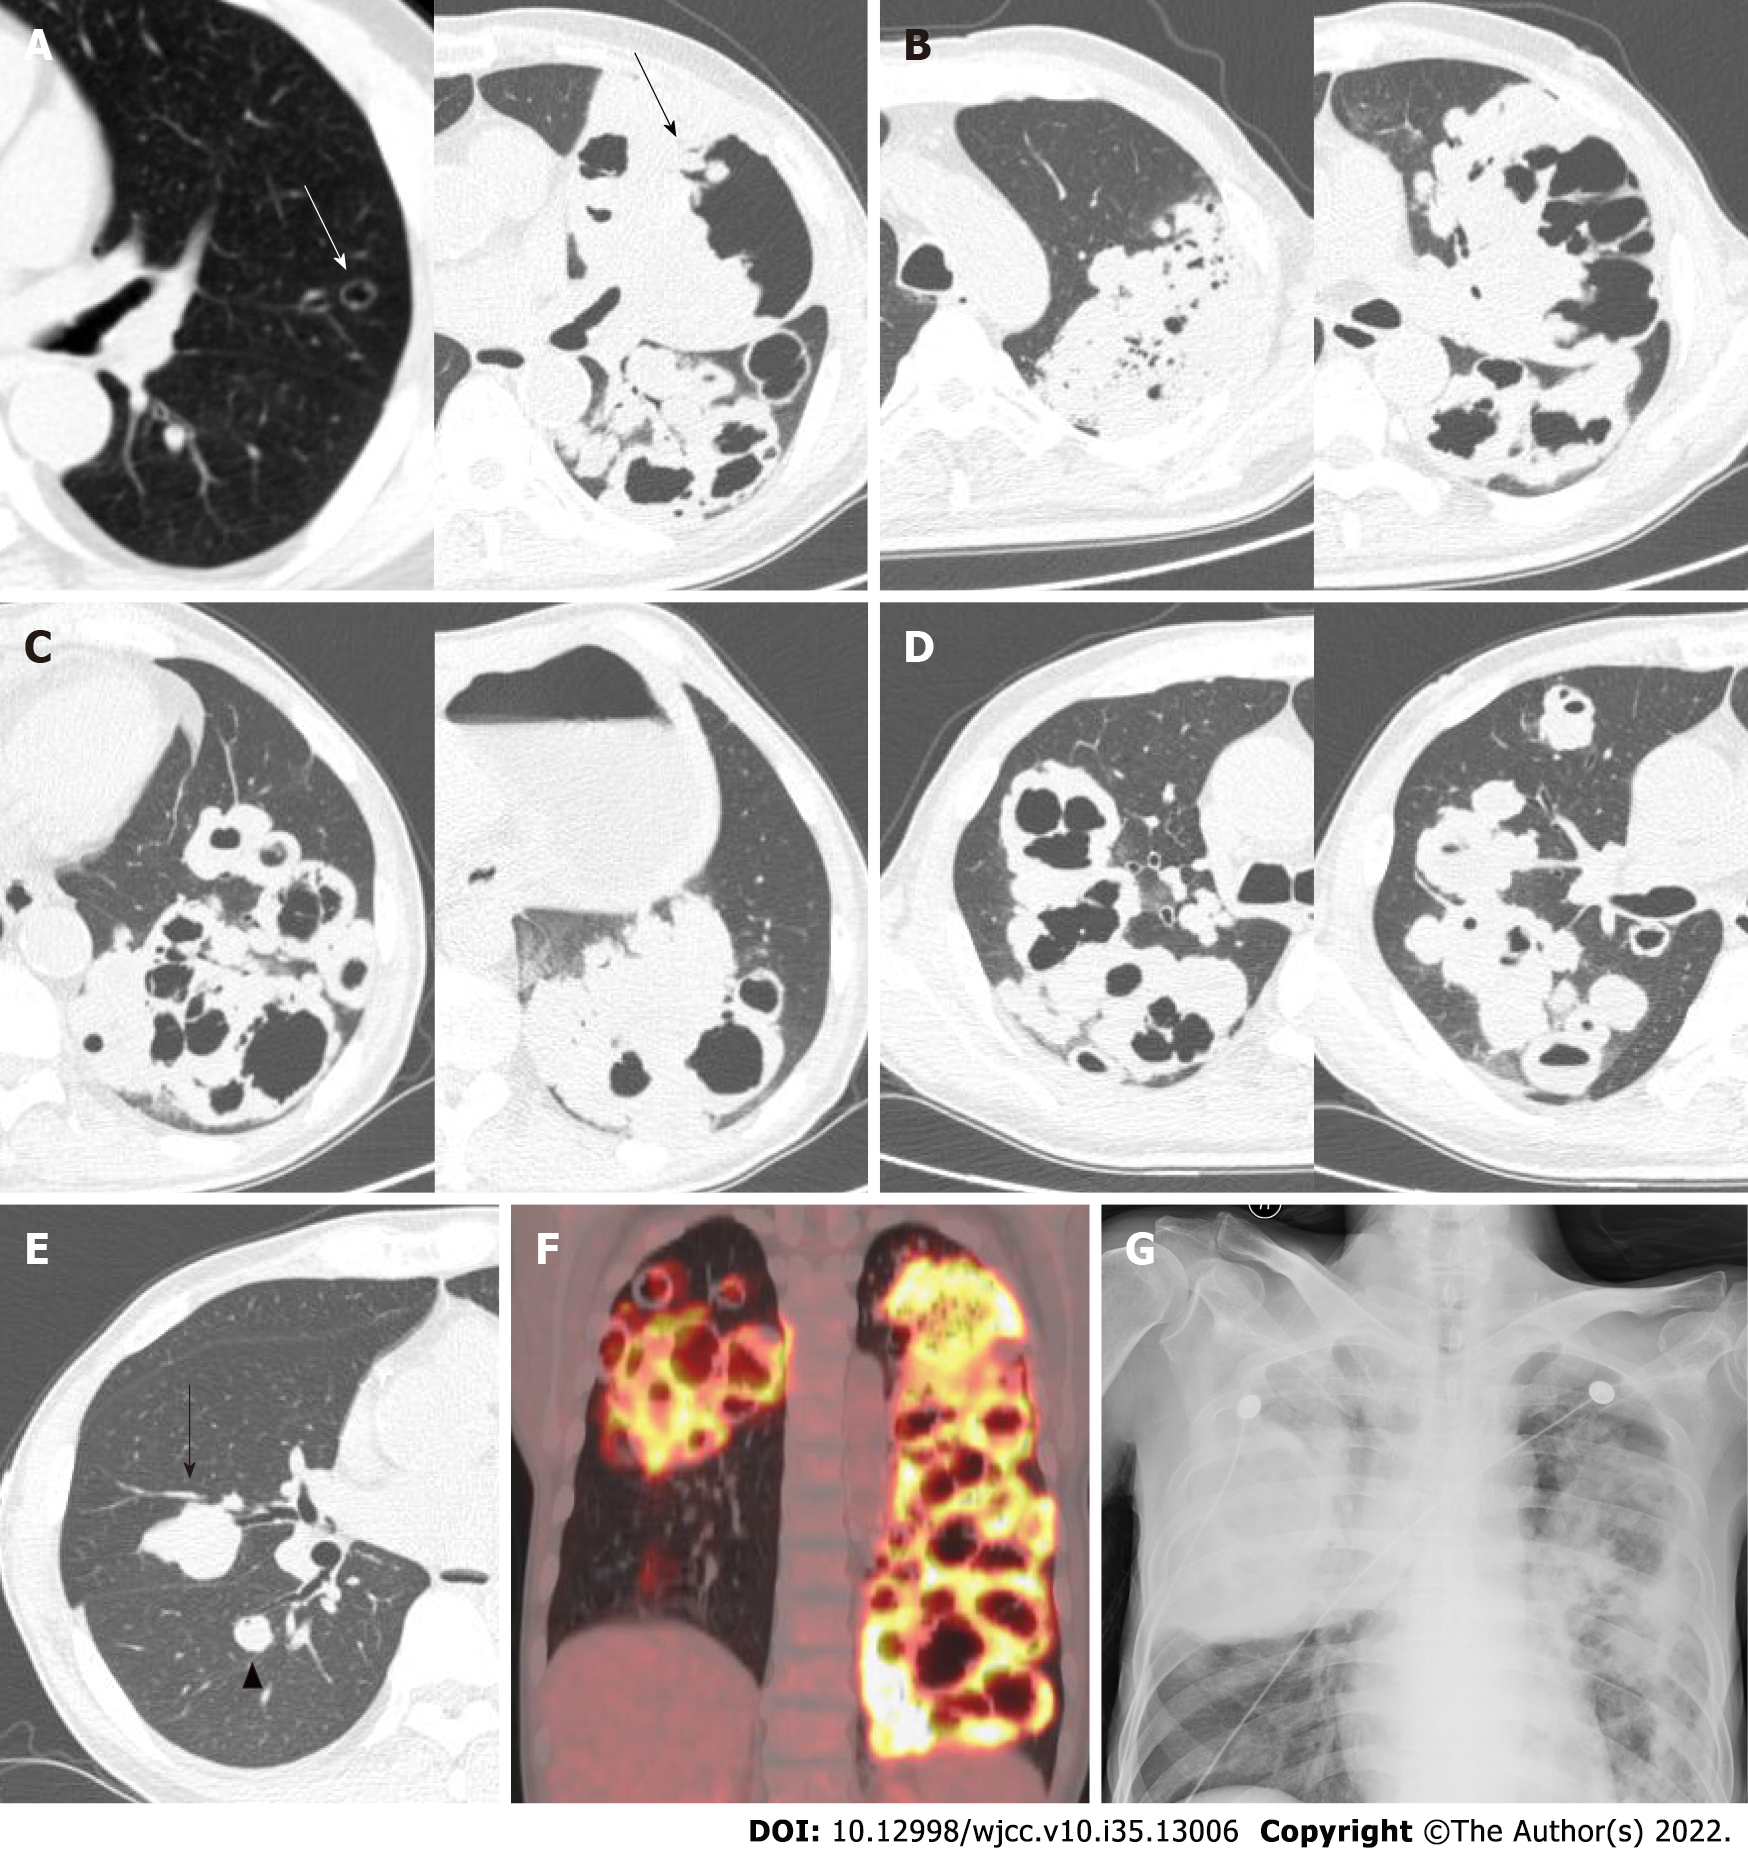
Figure 1 Chest computed tomography, positron emission tomography, and chest radiograph.
A: Chest computed tomography (CT) detected a thin-walled cyst (white arrow) in the left upper lobe in 2015 and a large cavity and mass (black arrow) in that same location in 2019; B-E: Chest CT detected multiple clustered cystic lesions in the left lung (B, C representative images) and the right upper lobe (D), and a mass (E) in the right middle lobe (black arrow) and lower lobe (black arrow head); F: Positron emission tomography-CT showed elevated uptake in bilateral lesions in 2019; G: Bedside chest radiograph showed a mass in the right lung and bilateral cystic lesions, which suggested tumor relapse in February 2020.
Figure 2 Pathology and enhanced computed tomography coronal maximum intensity projection of the chest.
A: Lung biopsy revealed a background of proliferating fibrous tissue with irregular nests of epithelial cells; B: The short arrow indicates intercellular bridges and the long arrow indicates a keratin-pearl, which are both typical of squamous cell carcinoma [(hematoxylin and eosin staining, original magnifications 100 × (A) and 400 × (B)]; C-E: Enhanced computed tomography coronal maximal projection intensity of the chest showed that the pulmonary artery passed through the cavity and masses.
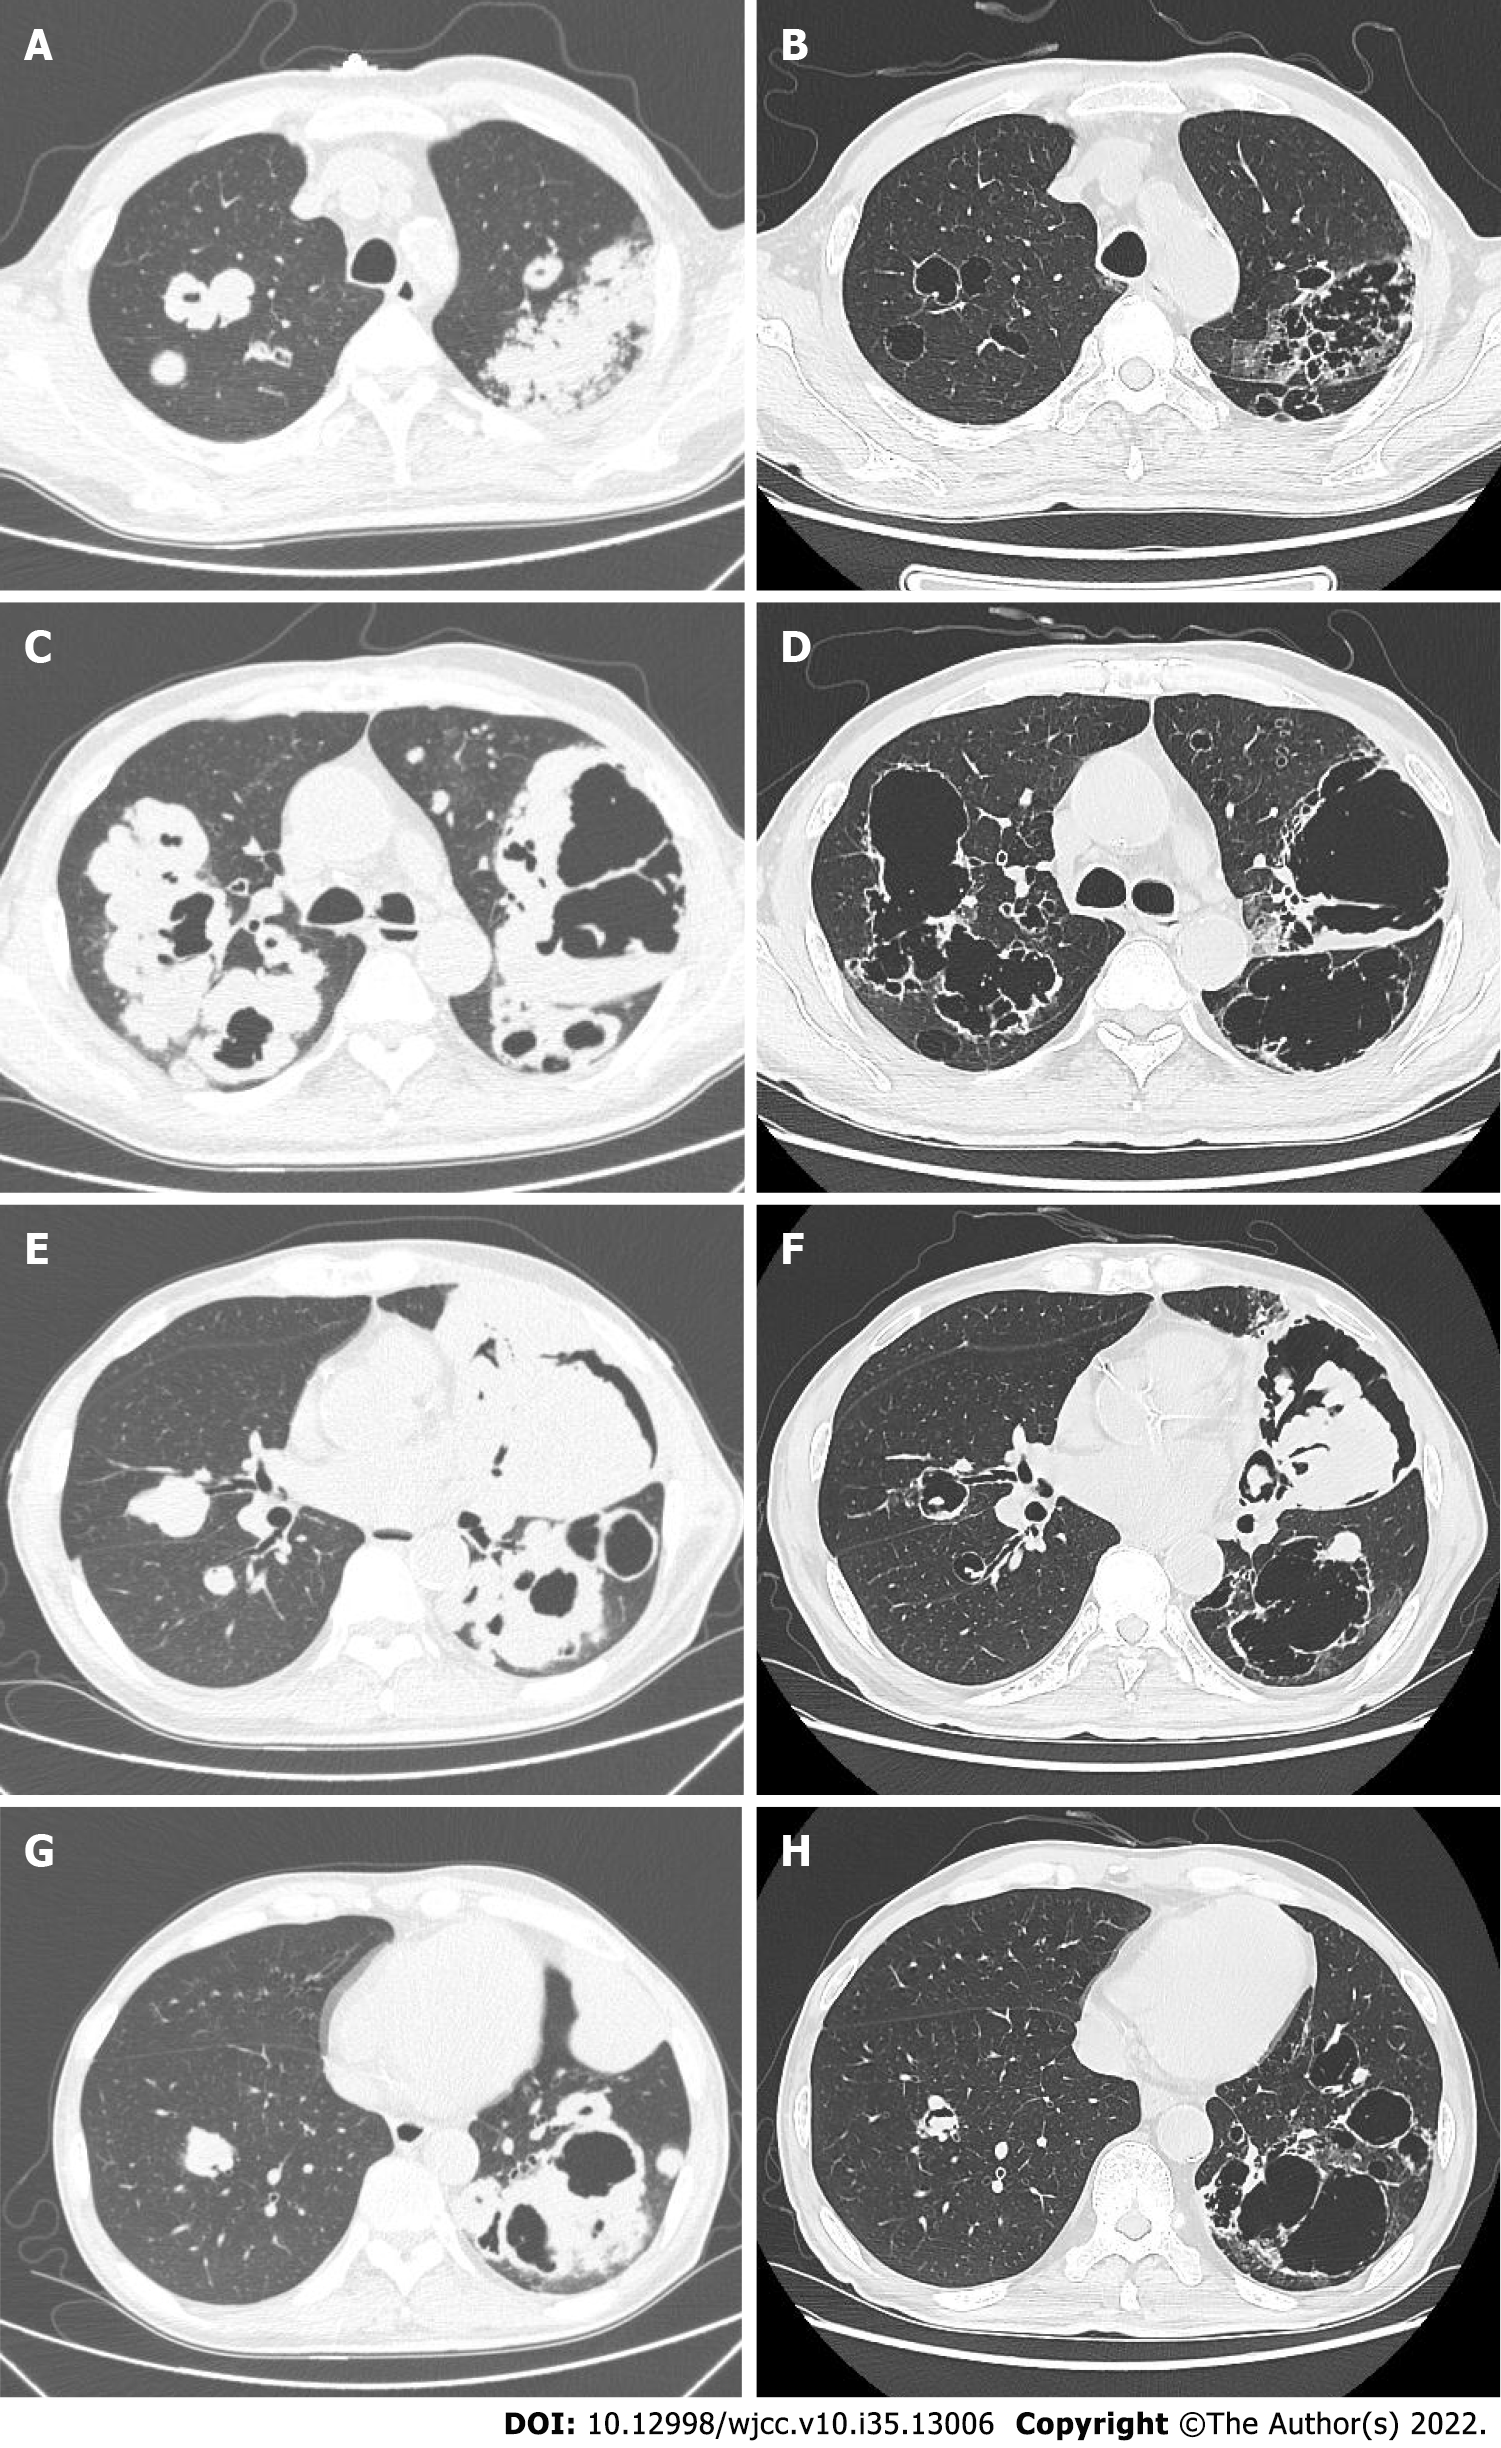
Figure 3 Chest computed tomography after chemotherapy.
A, C, E, and G: Computed tomography (CT) scans from May 2019, taken before treatment; B, D, F, and H: CT scans in August 2019, taken for post-treatment assessment after four cycles of chemotherapy.
- Citation: Shen YY, Jiang J, Zhao J, Song J. Lung squamous cell carcinoma presenting as rare clustered cystic lesions: A case report and review of literature. World J Clin Cases 2022; 10(35): 13006-13014
- URL: https://www.wjgnet.com/2307-8960/full/v10/i35/13006.htm
- DOI: https://dx.doi.org/10.12998/wjcc.v10.i35.13006


