Copyright
©The Author(s) 2022.
World J Clin Cases. Nov 26, 2022; 10(33): 12104-12115
Published online Nov 26, 2022. doi: 10.12998/wjcc.v10.i33.12104
Published online Nov 26, 2022. doi: 10.12998/wjcc.v10.i33.12104
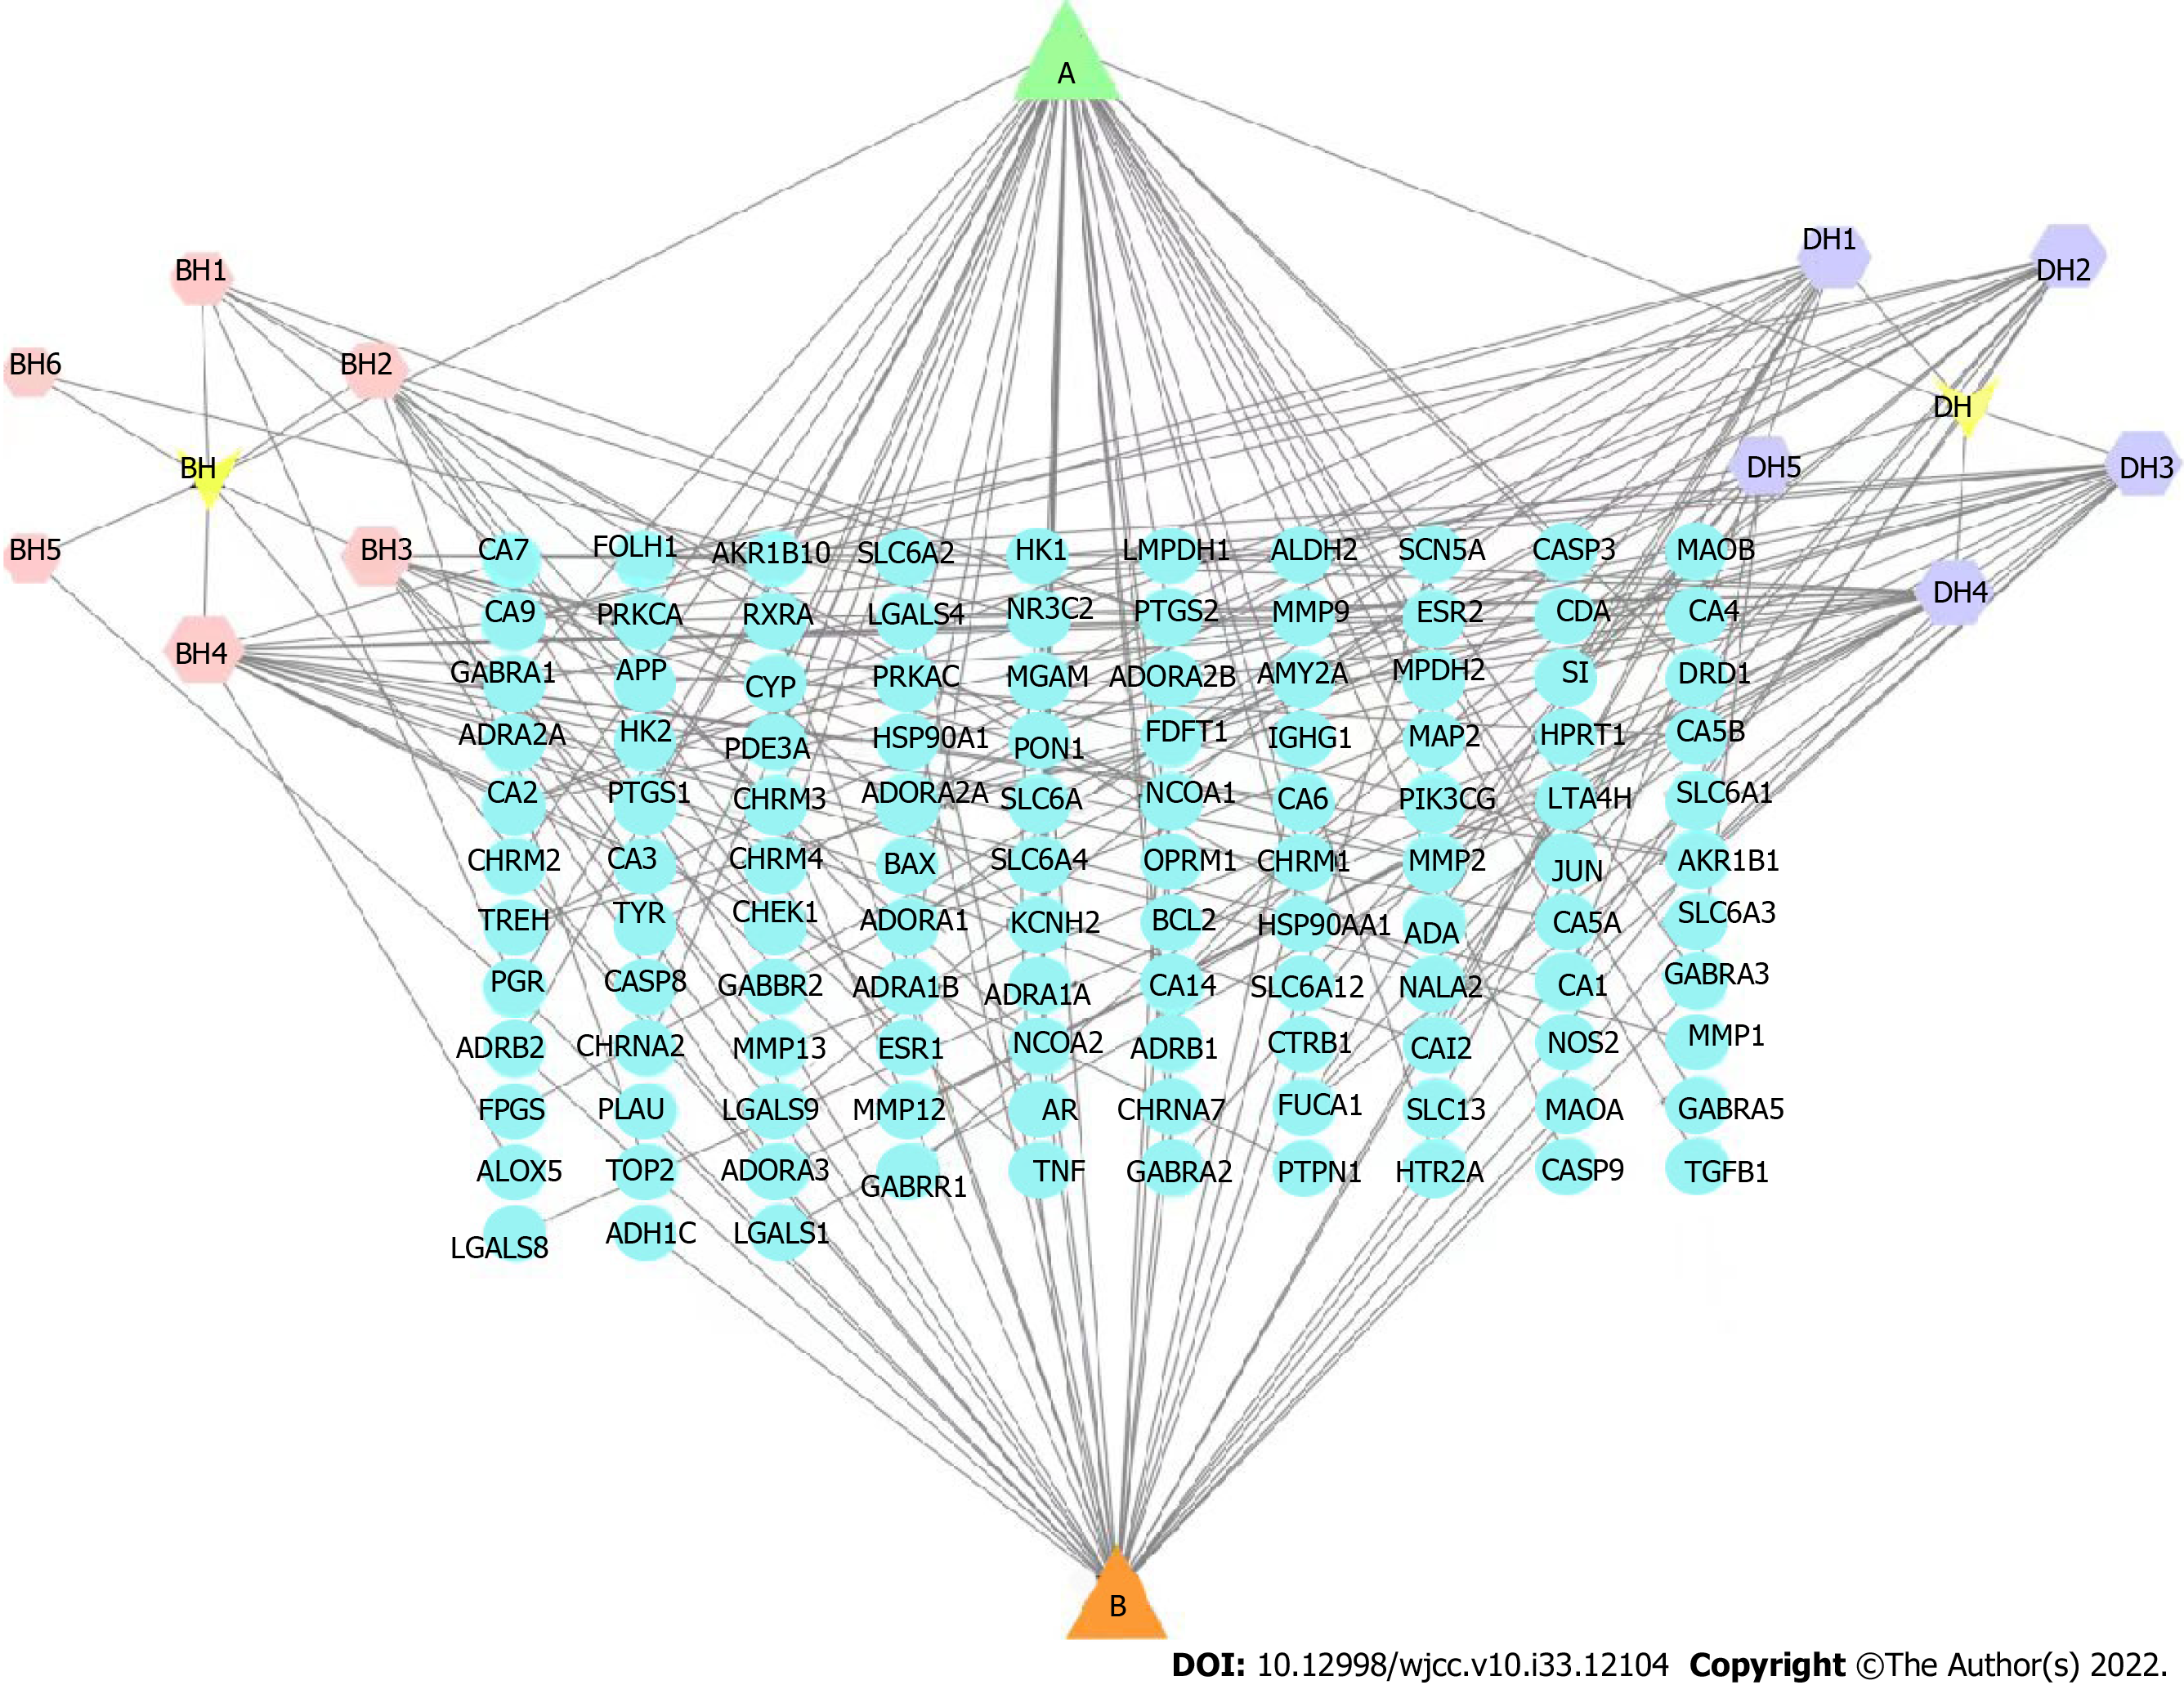
Figure 1 Baihedihuang decoction-breast cancer related anxiety network.
The hexagon indicates the drug component, red represents Baihe, and purple represents Dihuang. The light green circles represent the gene targets. The triangles represent common components.
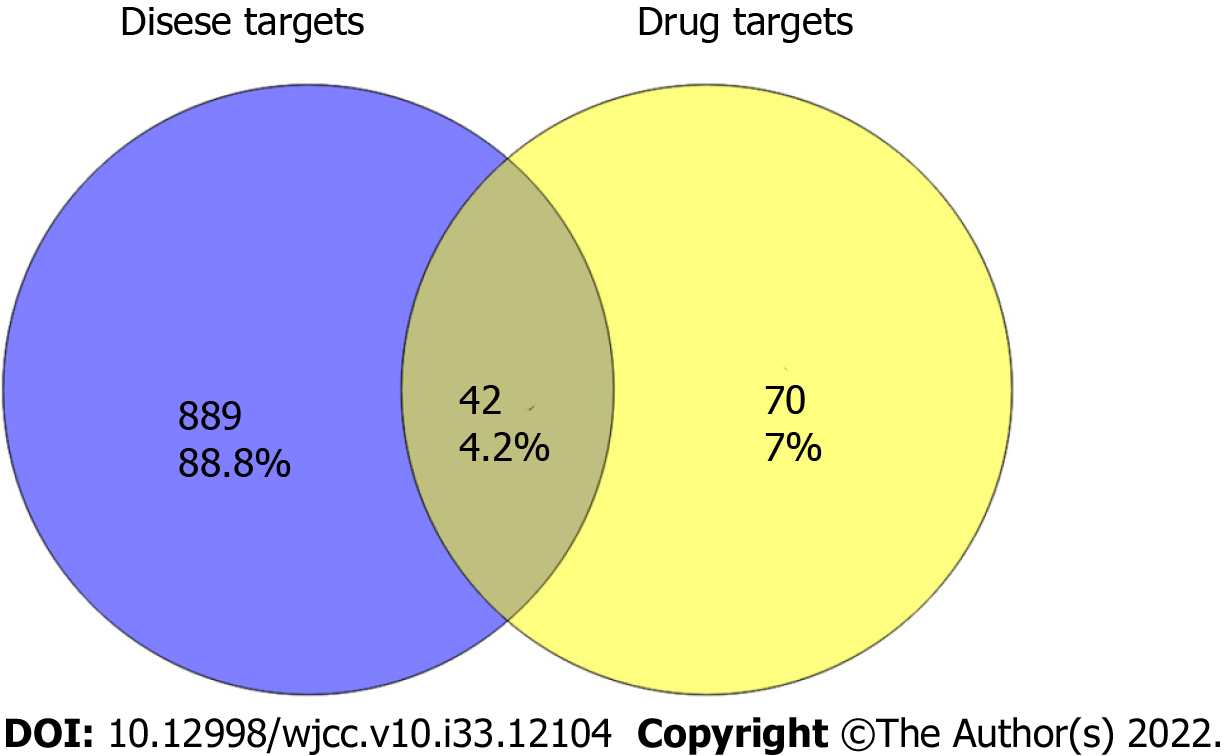
Figure 2 Baihedihuang decoction-breast cancer related anxiety intersection genes.
The gene intersection between breast cancer related anxiety-related genes and the predicted targets of Baihedihuang decoction active ingredients represents the targets of Baihedihuang decoction in breast cancer related anxiety.
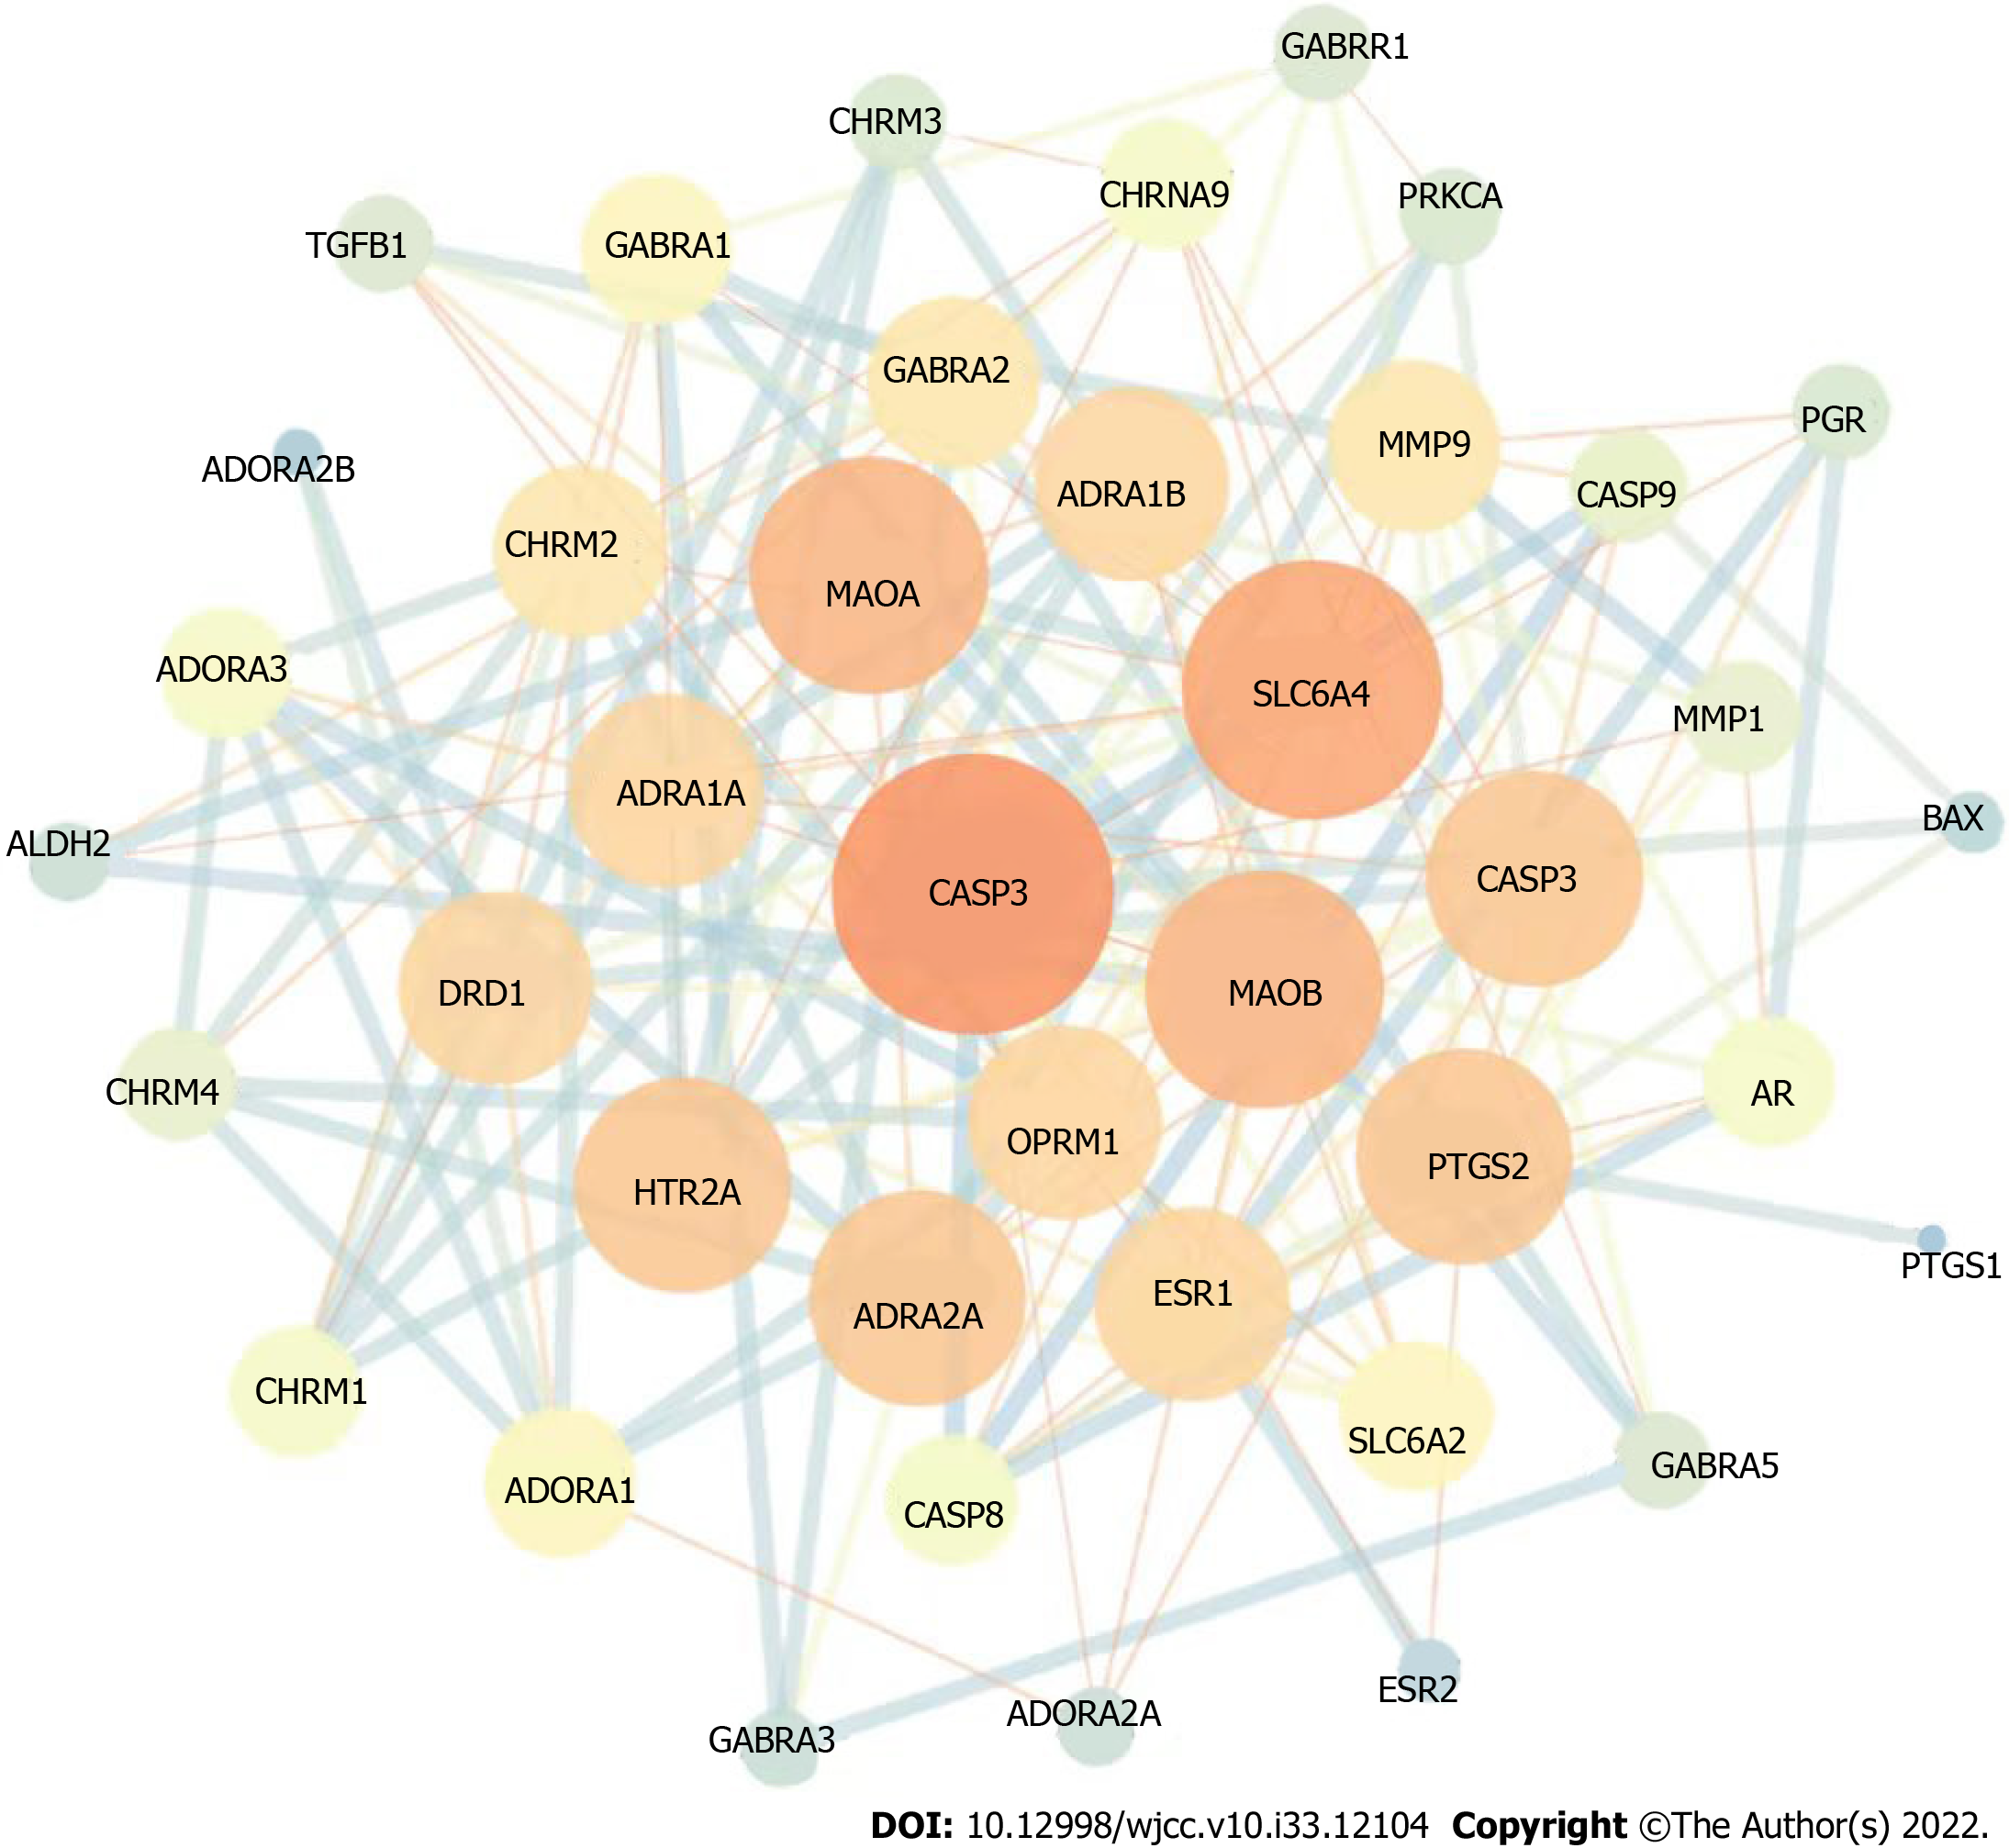
Figure 3 Baihedihuang decoction-Breast cancer related anxiety protein-protein interaction network.
Lines of different colors and thicknesses represent different ways of proving the protein interaction relationship between nodes.
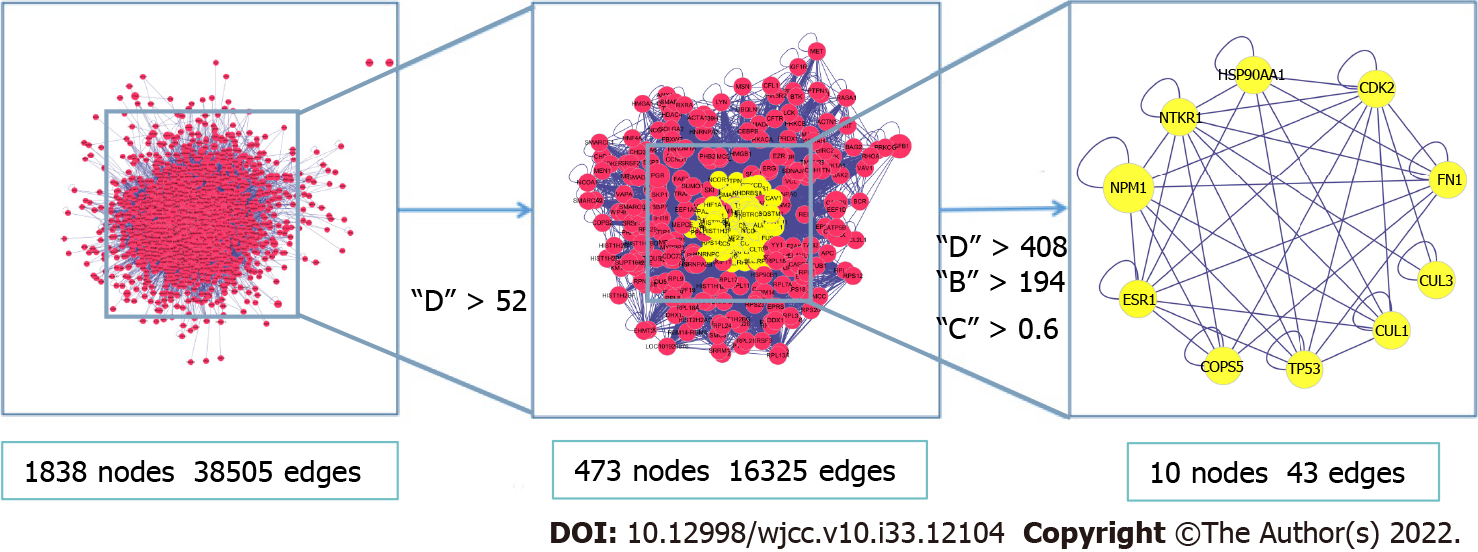
Figure 4 Diagram of the screening process of key nodes.
The nodes for which all values exceeded the median were retained in the protein interaction network (PPI) network diagram. The filter conditions were as follows: D > 52. This secondary PPI network contained 30 nodes and 147 edges. The calculation was repeated with the following filter conditions: D > 408, B > 194, C > 0.6. The obtained core PPI network comprised 10 nodes and 47 edges. D: Connectivity centrality; C: Tightness centrality; B: Mesocentricity.
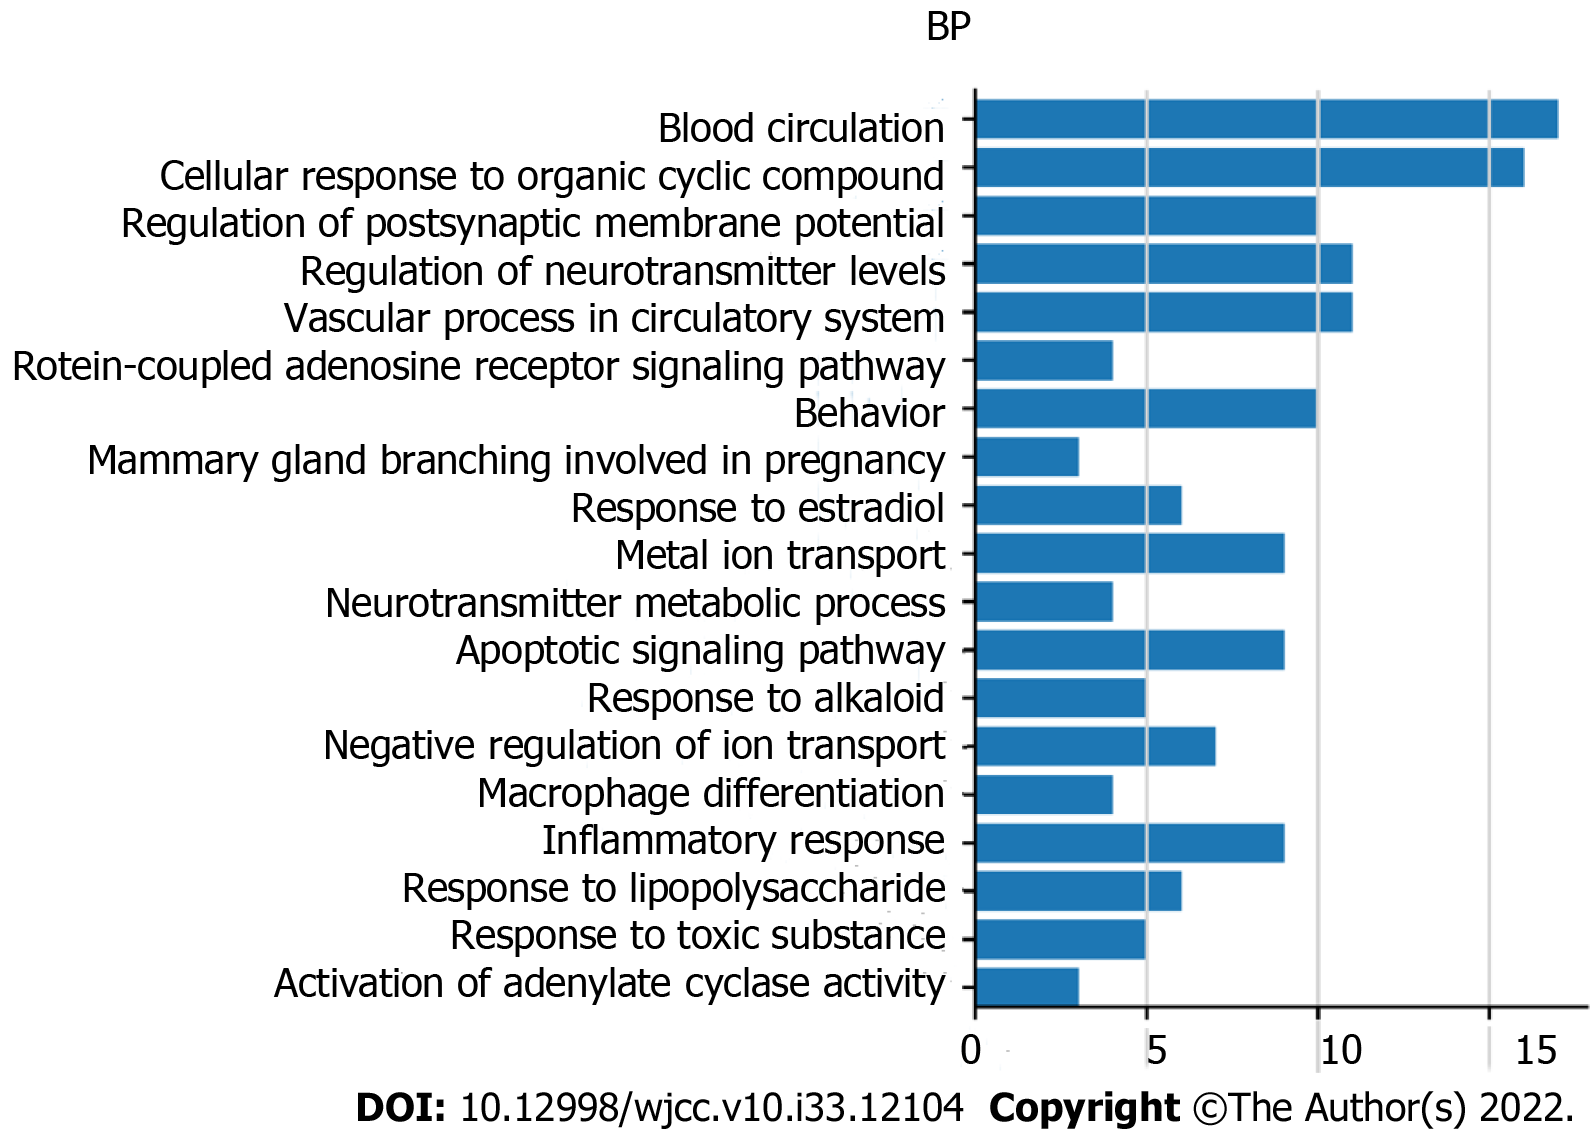
Figure 5 Biological process functional analysis.
Biological process gene enrichment analysis of the above 42 key nodes was performed at the Metascape website, and the top 19 Log10 (P) values were selected from the analysis results for visualization. BP: Biological process.
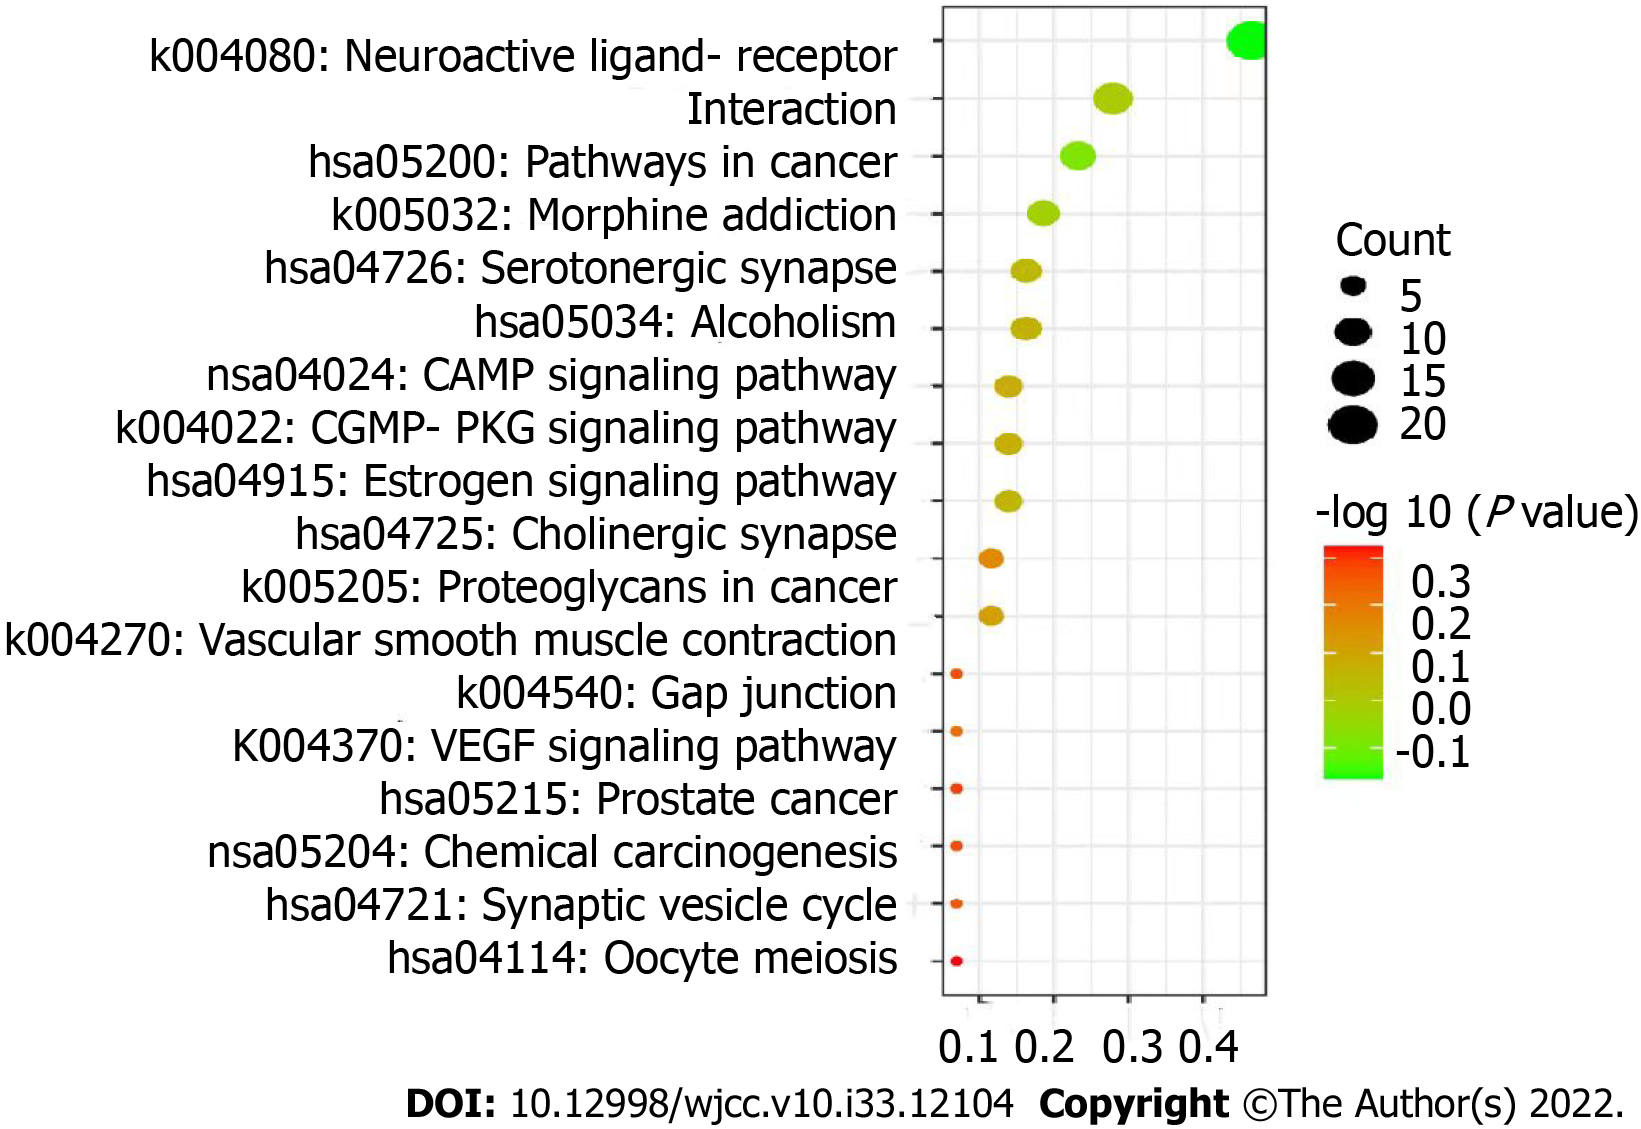
Figure 6 Kyoto Encyclopedia of Genes and Genomes pathway enrichment analysis.
In the bubble chart, the ordinate is the name of the biological process or pathway, the abscissa is the proportion of genes, the size of the bubble represents the number of genes enriched in each gene ontology, and the color represents the significance of the enrichment.
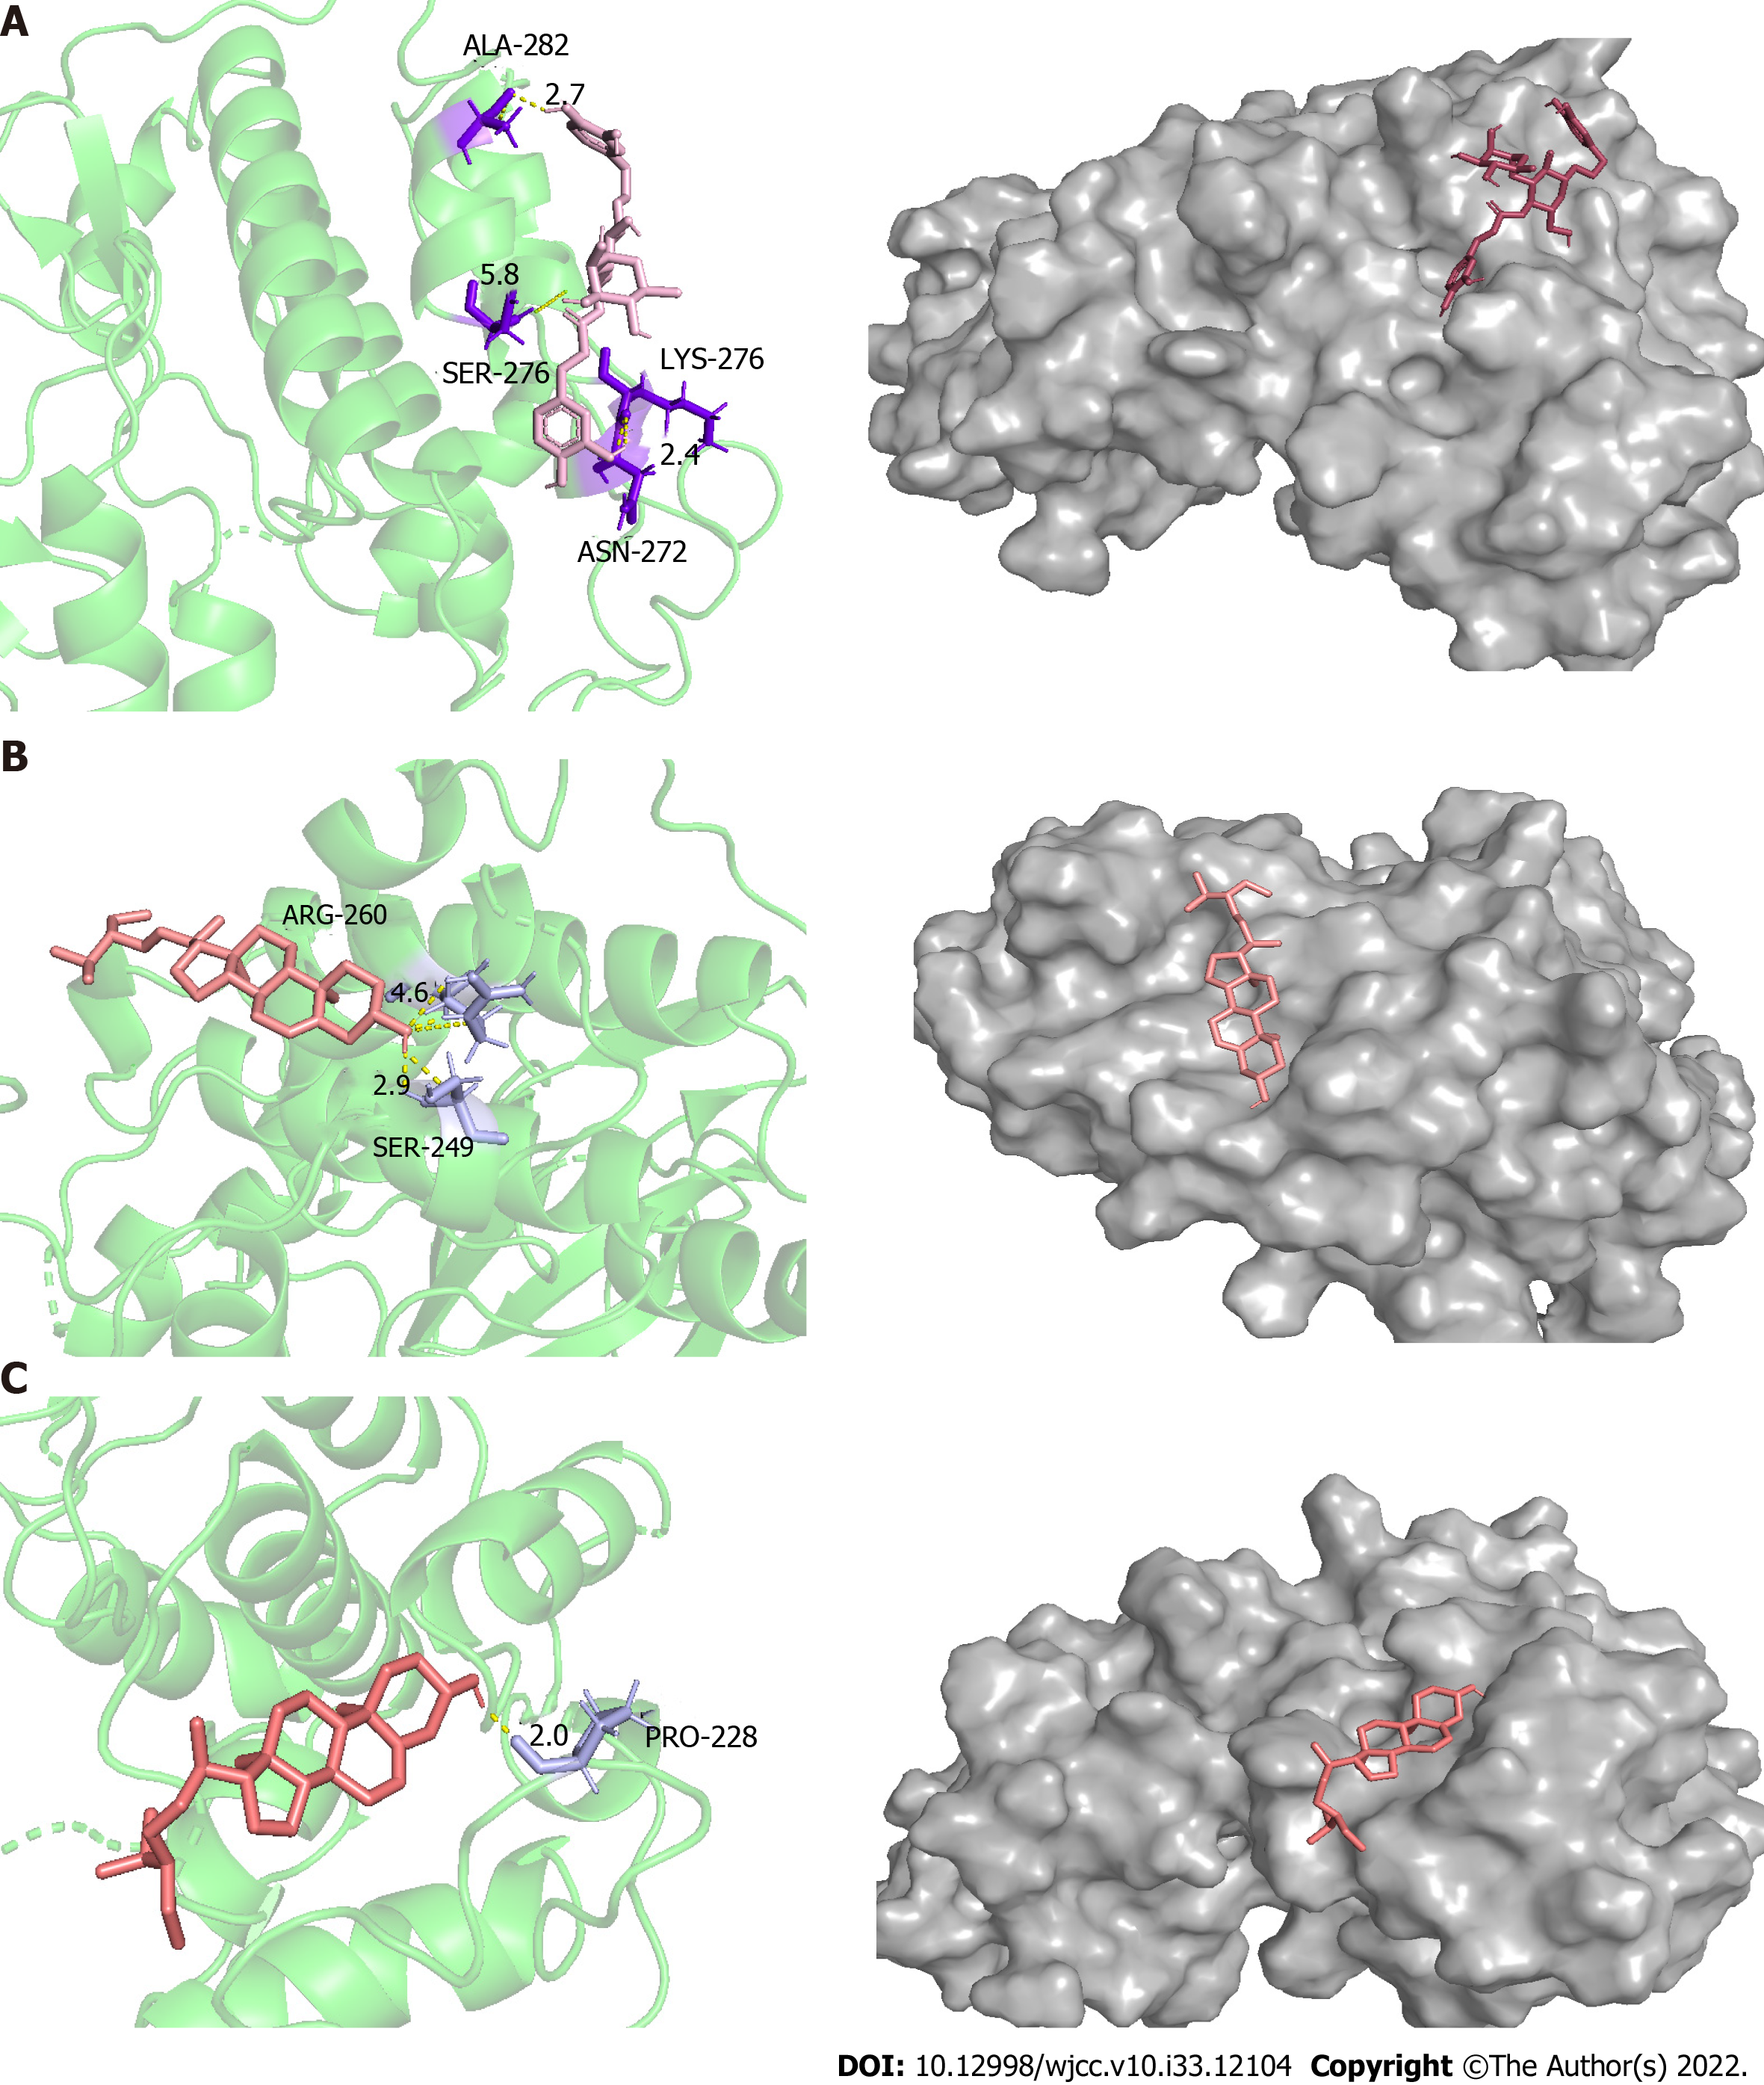
Figure 7 Docking models of the main active ingredients and core targets.
A: Docking models of verbascoside and CDK2; B: Docking models of stigmasterol and CDK2; C: Docking models of β-sitosterol and CDK2.
- Citation: Li ZH, Yang GH, Wang F. Molecular mechanisms of Baihedihuang decoction as a treatment for breast cancer related anxiety: A network pharmacology and molecular docking study. World J Clin Cases 2022; 10(33): 12104-12115
- URL: https://www.wjgnet.com/2307-8960/full/v10/i33/12104.htm
- DOI: https://dx.doi.org/10.12998/wjcc.v10.i33.12104


