Copyright
©The Author(s) 2022.
World J Clin Cases. Nov 26, 2022; 10(33): 12104-12115
Published online Nov 26, 2022. doi: 10.12998/wjcc.v10.i33.12104
Published online Nov 26, 2022. doi: 10.12998/wjcc.v10.i33.12104
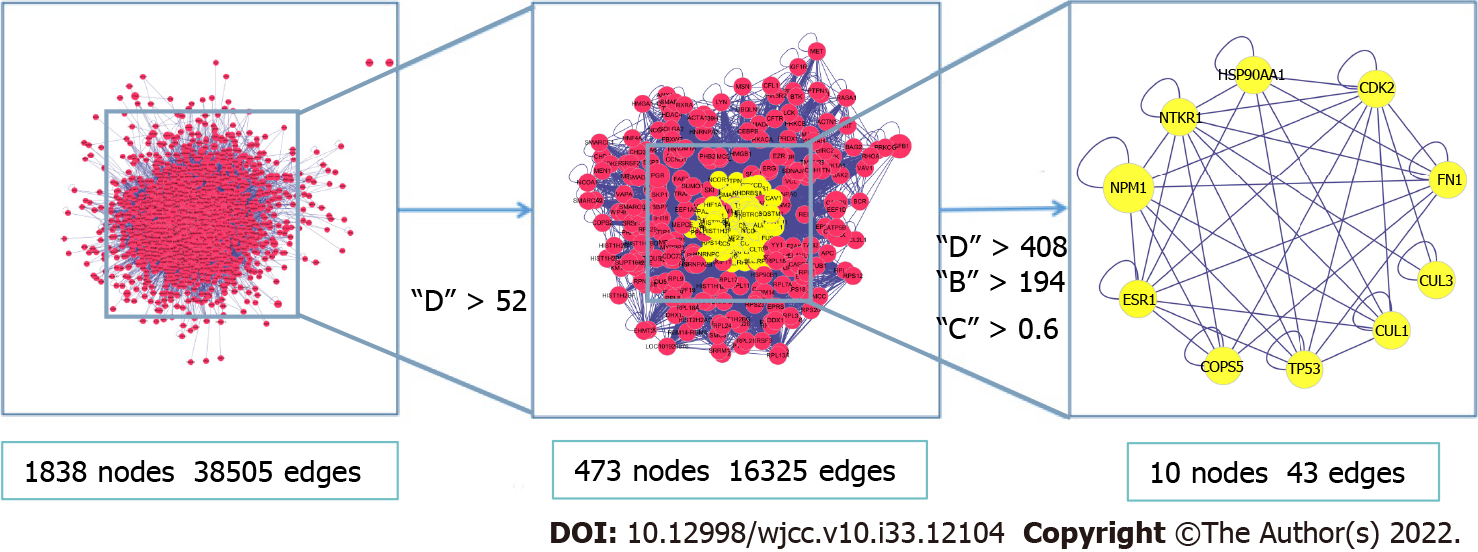
Figure 4 Diagram of the screening process of key nodes.
The nodes for which all values exceeded the median were retained in the protein interaction network (PPI) network diagram. The filter conditions were as follows: D > 52. This secondary PPI network contained 30 nodes and 147 edges. The calculation was repeated with the following filter conditions: D > 408, B > 194, C > 0.6. The obtained core PPI network comprised 10 nodes and 47 edges. D: Connectivity centrality; C: Tightness centrality; B: Mesocentricity.
- Citation: Li ZH, Yang GH, Wang F. Molecular mechanisms of Baihedihuang decoction as a treatment for breast cancer related anxiety: A network pharmacology and molecular docking study. World J Clin Cases 2022; 10(33): 12104-12115
- URL: https://www.wjgnet.com/2307-8960/full/v10/i33/12104.htm
- DOI: https://dx.doi.org/10.12998/wjcc.v10.i33.12104


