Copyright
©The Author(s) 2022.
World J Clin Cases. Nov 6, 2022; 10(31): 11500-11507
Published online Nov 6, 2022. doi: 10.12998/wjcc.v10.i31.11500
Published online Nov 6, 2022. doi: 10.12998/wjcc.v10.i31.11500
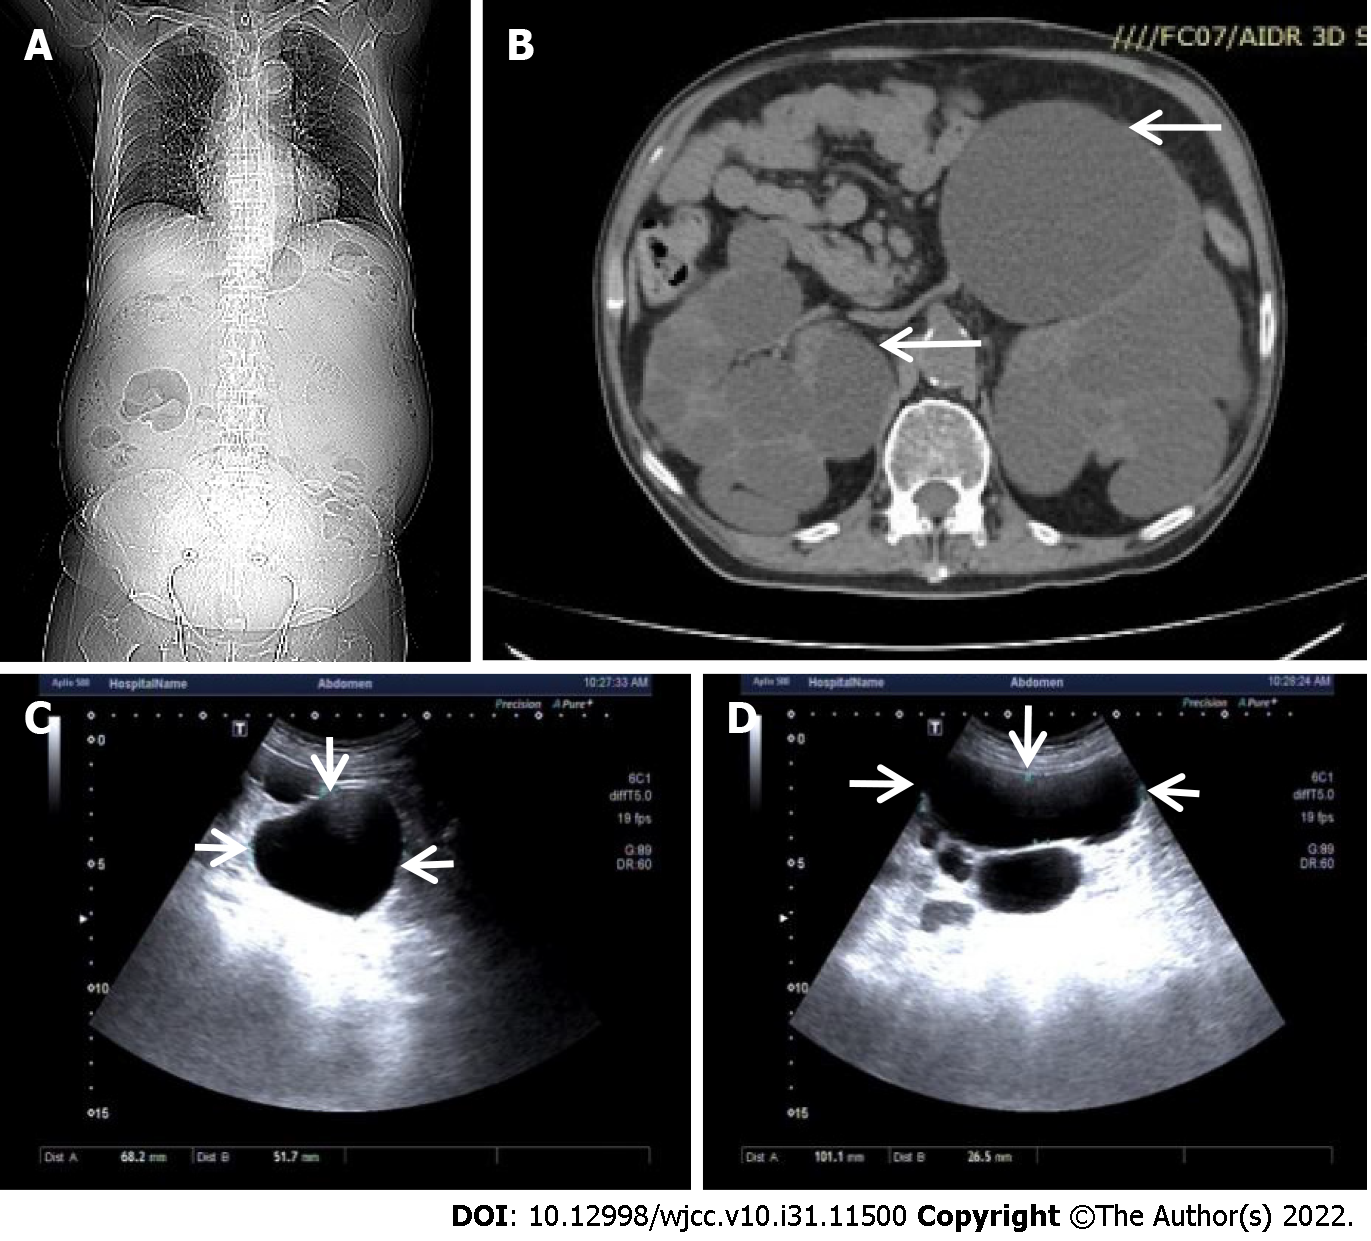
Figure 1 Representative images from computed tomography and renal ultrasonography.
A: Computed tomography imaging of the body; B: Representative image of multiple cysts on bilateral kidneys indicated by arrows; C: The largest cyst image on the right kidney indicated by arrows; D: The largest cyst image on the left kidney indicated by arrows.
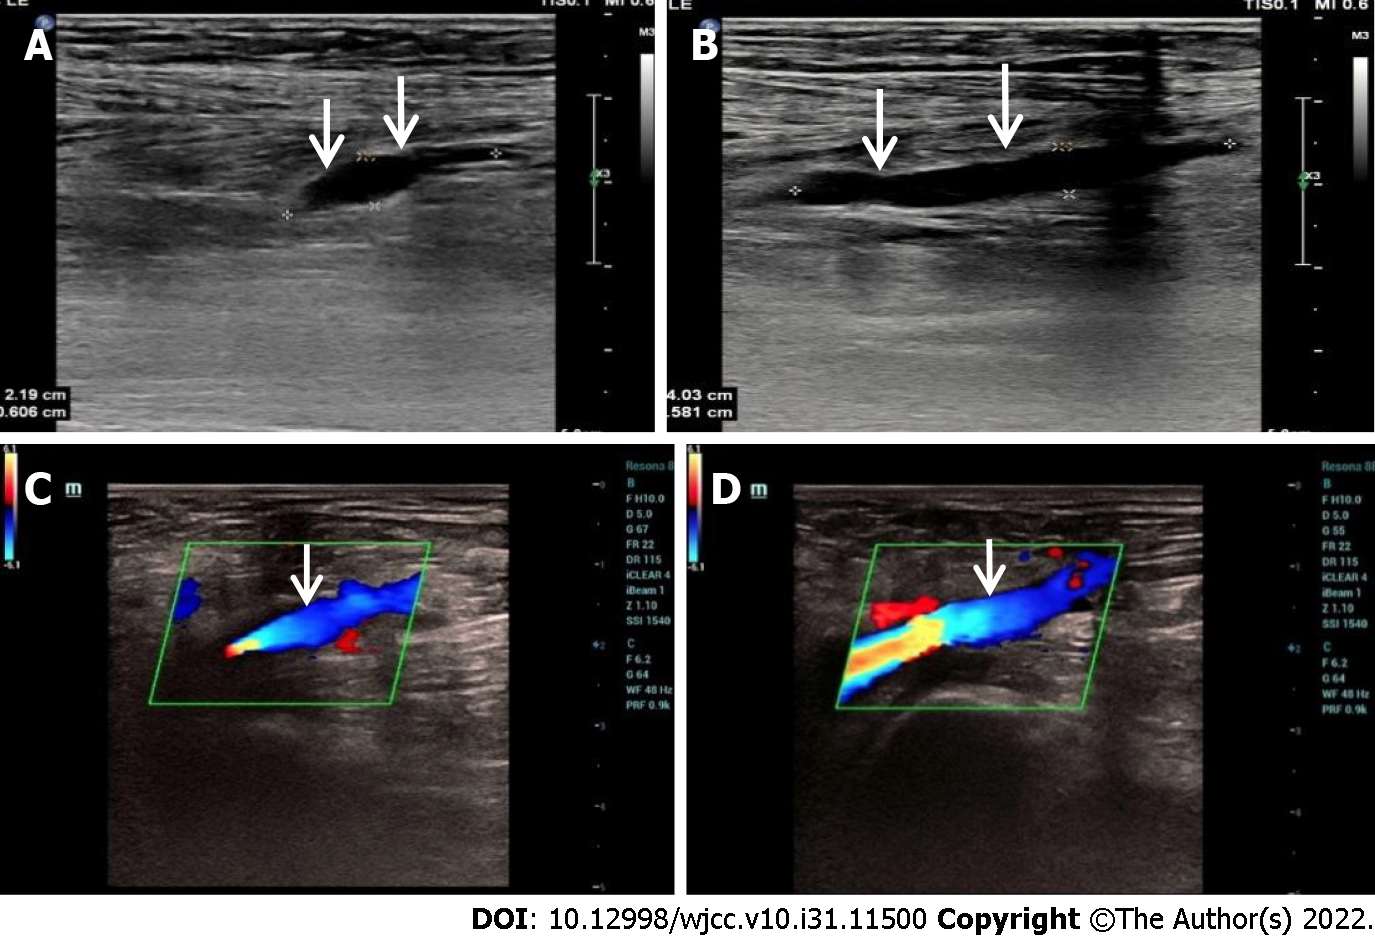
Figure 2 Representative images of venous thrombosis in lower extremity by ultrasonography.
A: Venous thrombosis in the right lower extremity before treatment shown by arrows; B: Venous thrombosis in the left lower extremity before treatment shown by arrows; C: Venous thrombosis disappeared in the right lower extremity after treatment; D: Venous thrombosis disappeared in the left lower extremity after treatment.
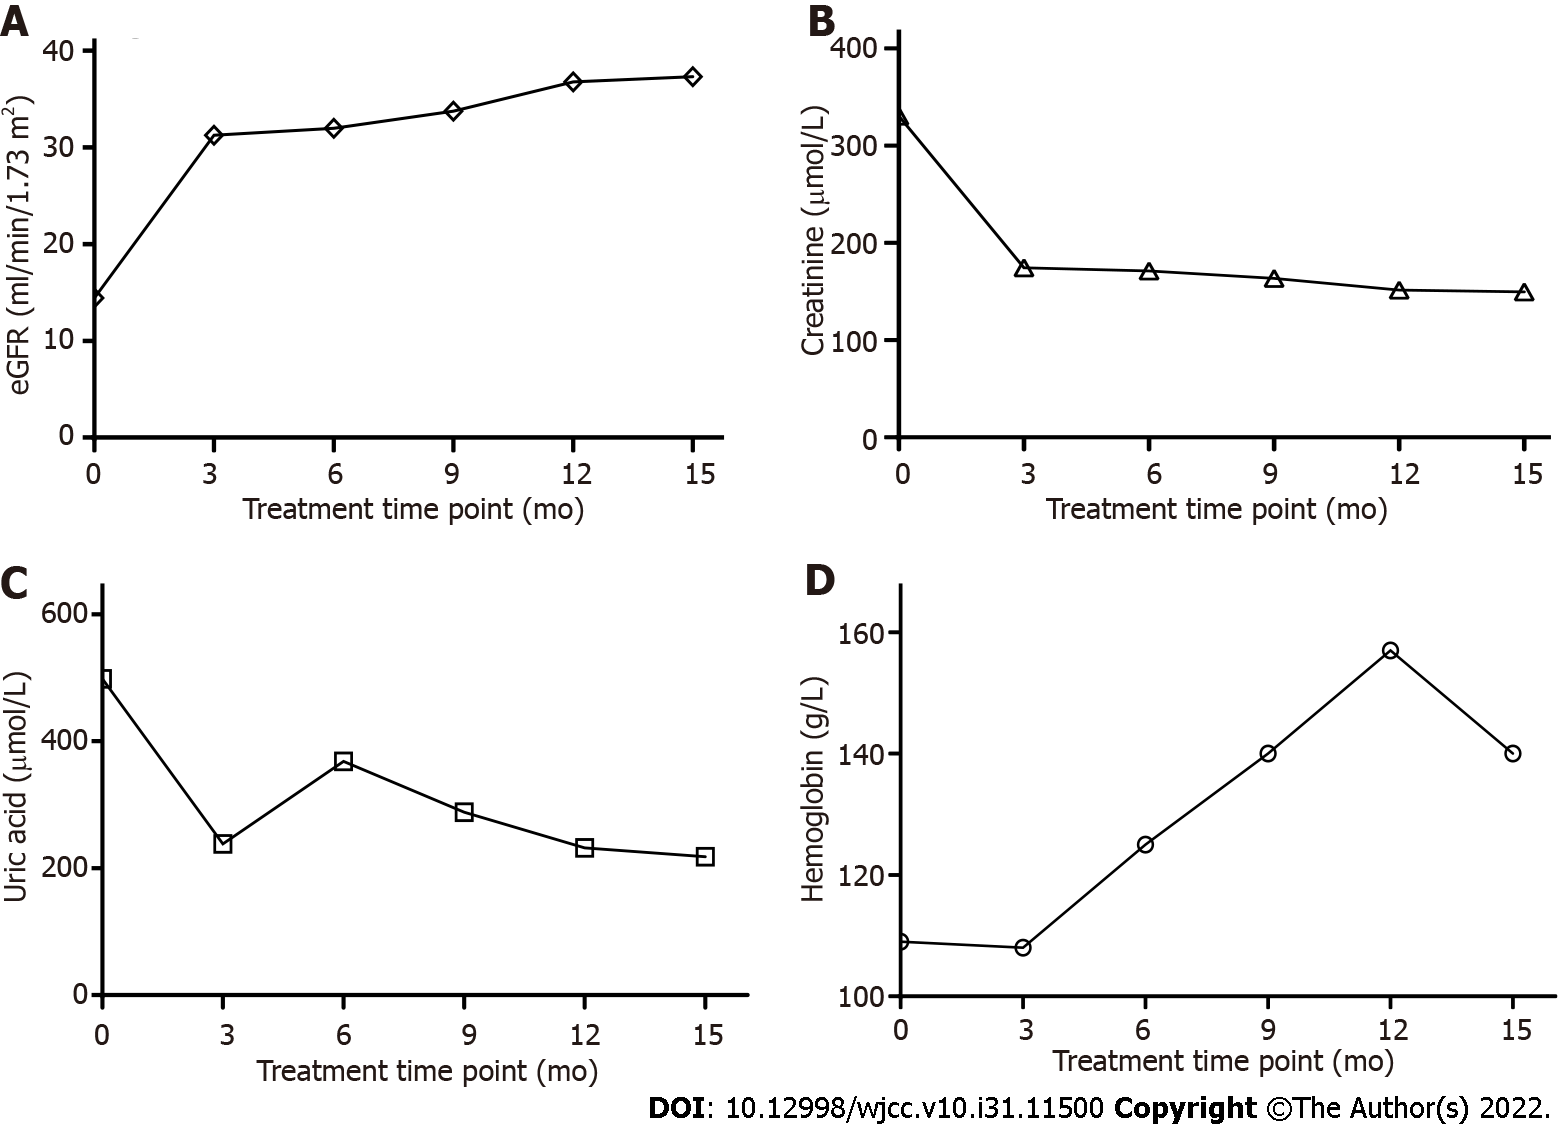
Figure 3 Laboratory test data.
A: eGFR fluctuation graph during the treatment. At the treatment initiation, eGFR was 14.43 ml/min/1.73 m2, it was raised to 37.32 ml/min/1.73 m2 after 15 months of treatment; B: Serum creatinine change graph. At the start of treatment, creatinine was 330.5 μmol/L exceeding normal range (35-106 μmol/L), which indicated that there was an acute kidney injury. The creatinine was dramatically reduced to 174.4 μmol/L after 3 months of treatment; C: Uric acid change graph. At the start of treatment, uric acid was 498 μmol/L over normal range (150-420 μmol/L), after a few months of treatment, it was reduced to a normal range; D: Hemoglobin change graph. At the treatment initiation, hemoglobin was 109 g/L, it was within normal range (130-175 g/L) after 6 months of treatment.
- Citation: Zhou L, Tian Y, Ma L, Li WG. Tolvaptan ameliorated kidney function for one elderly autosomal dominant polycystic kidney disease patient: A case report. World J Clin Cases 2022; 10(31): 11500-11507
- URL: https://www.wjgnet.com/2307-8960/full/v10/i31/11500.htm
- DOI: https://dx.doi.org/10.12998/wjcc.v10.i31.11500


