Copyright
©The Author(s) 2022.
World J Clin Cases. Oct 16, 2022; 10(29): 10451-10466
Published online Oct 16, 2022. doi: 10.12998/wjcc.v10.i29.10451
Published online Oct 16, 2022. doi: 10.12998/wjcc.v10.i29.10451
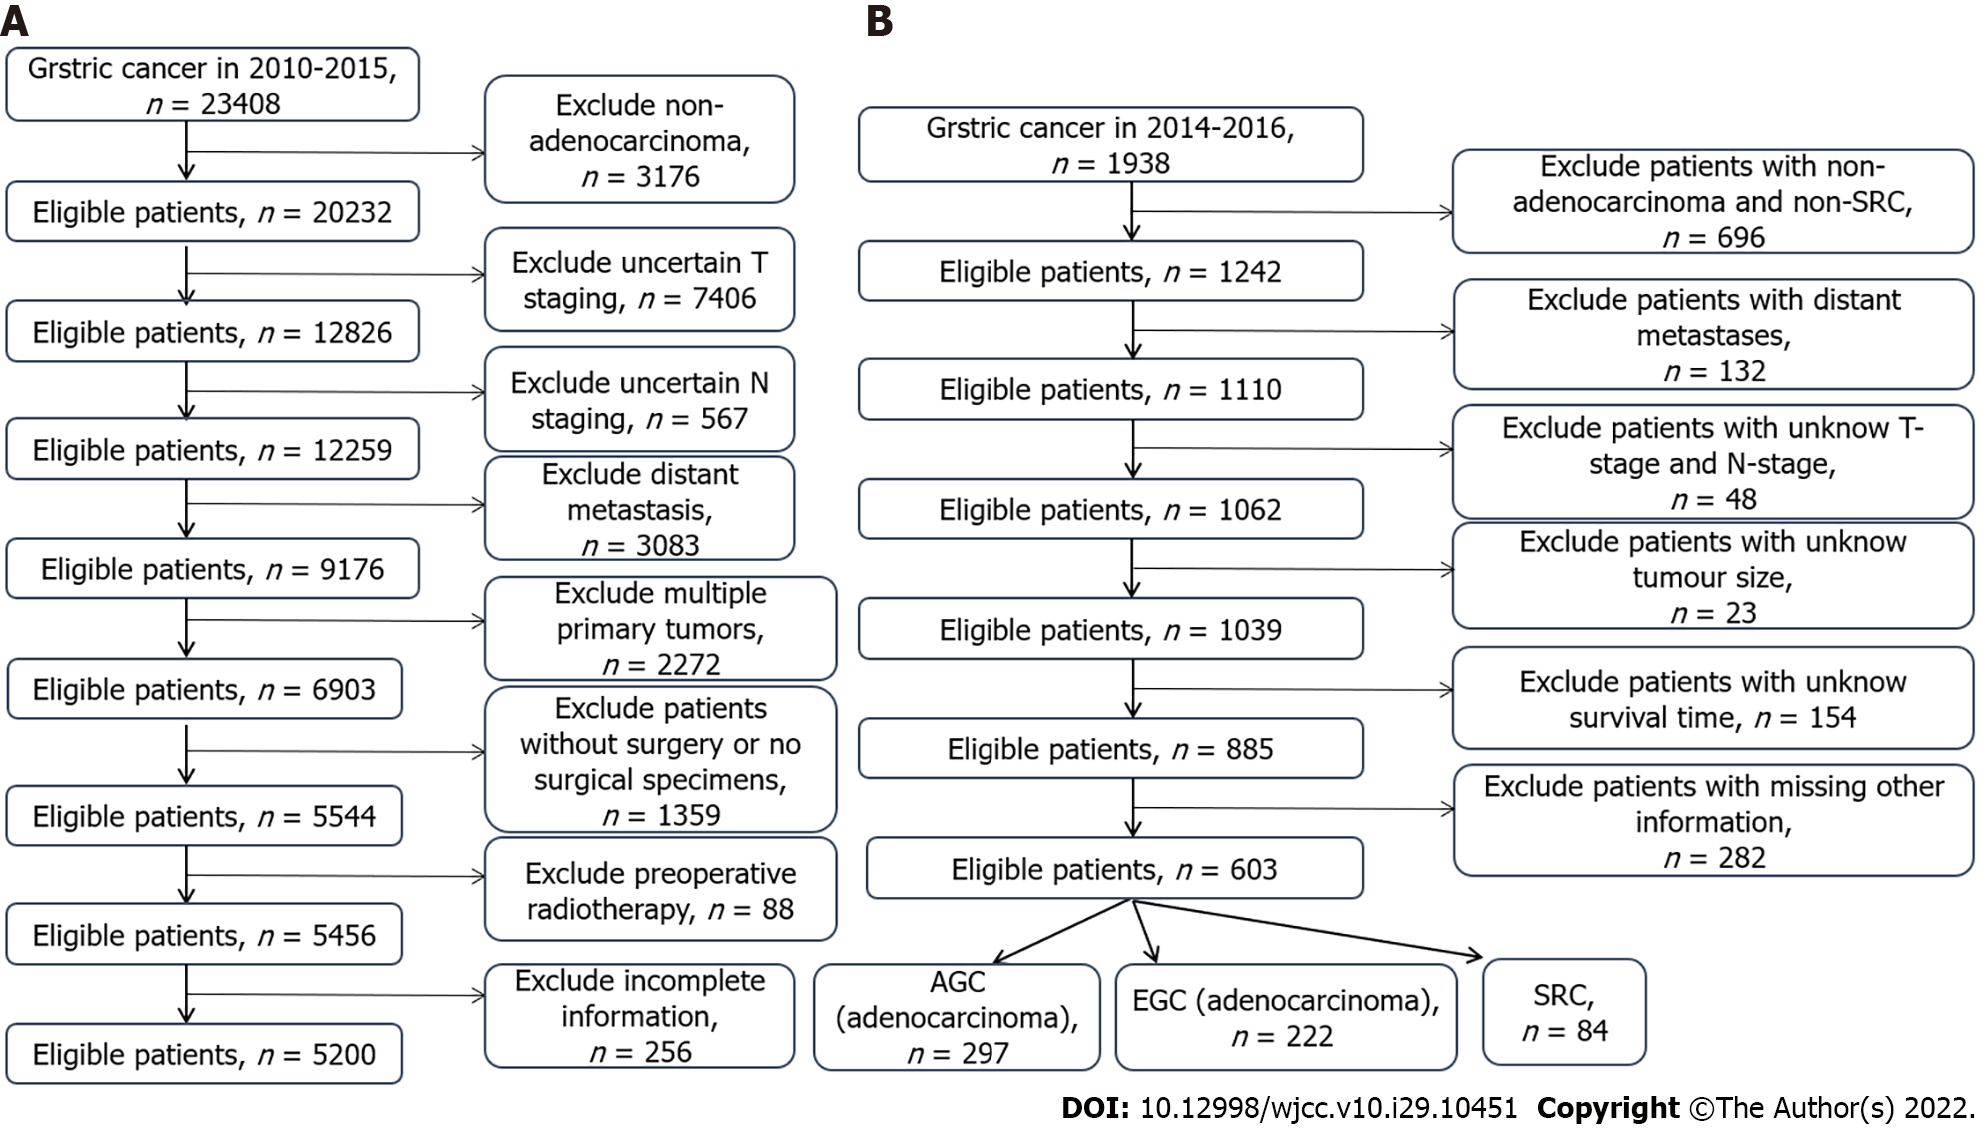
Figure 1 Flow chart of data screening in this study.
A: Surveillance, Epidemiology and End Results data set; B: External verification group. AGC: Advanced gastric cancer; EGC: Early gastric cancer; SRC: Signet ring cell carcinoma.
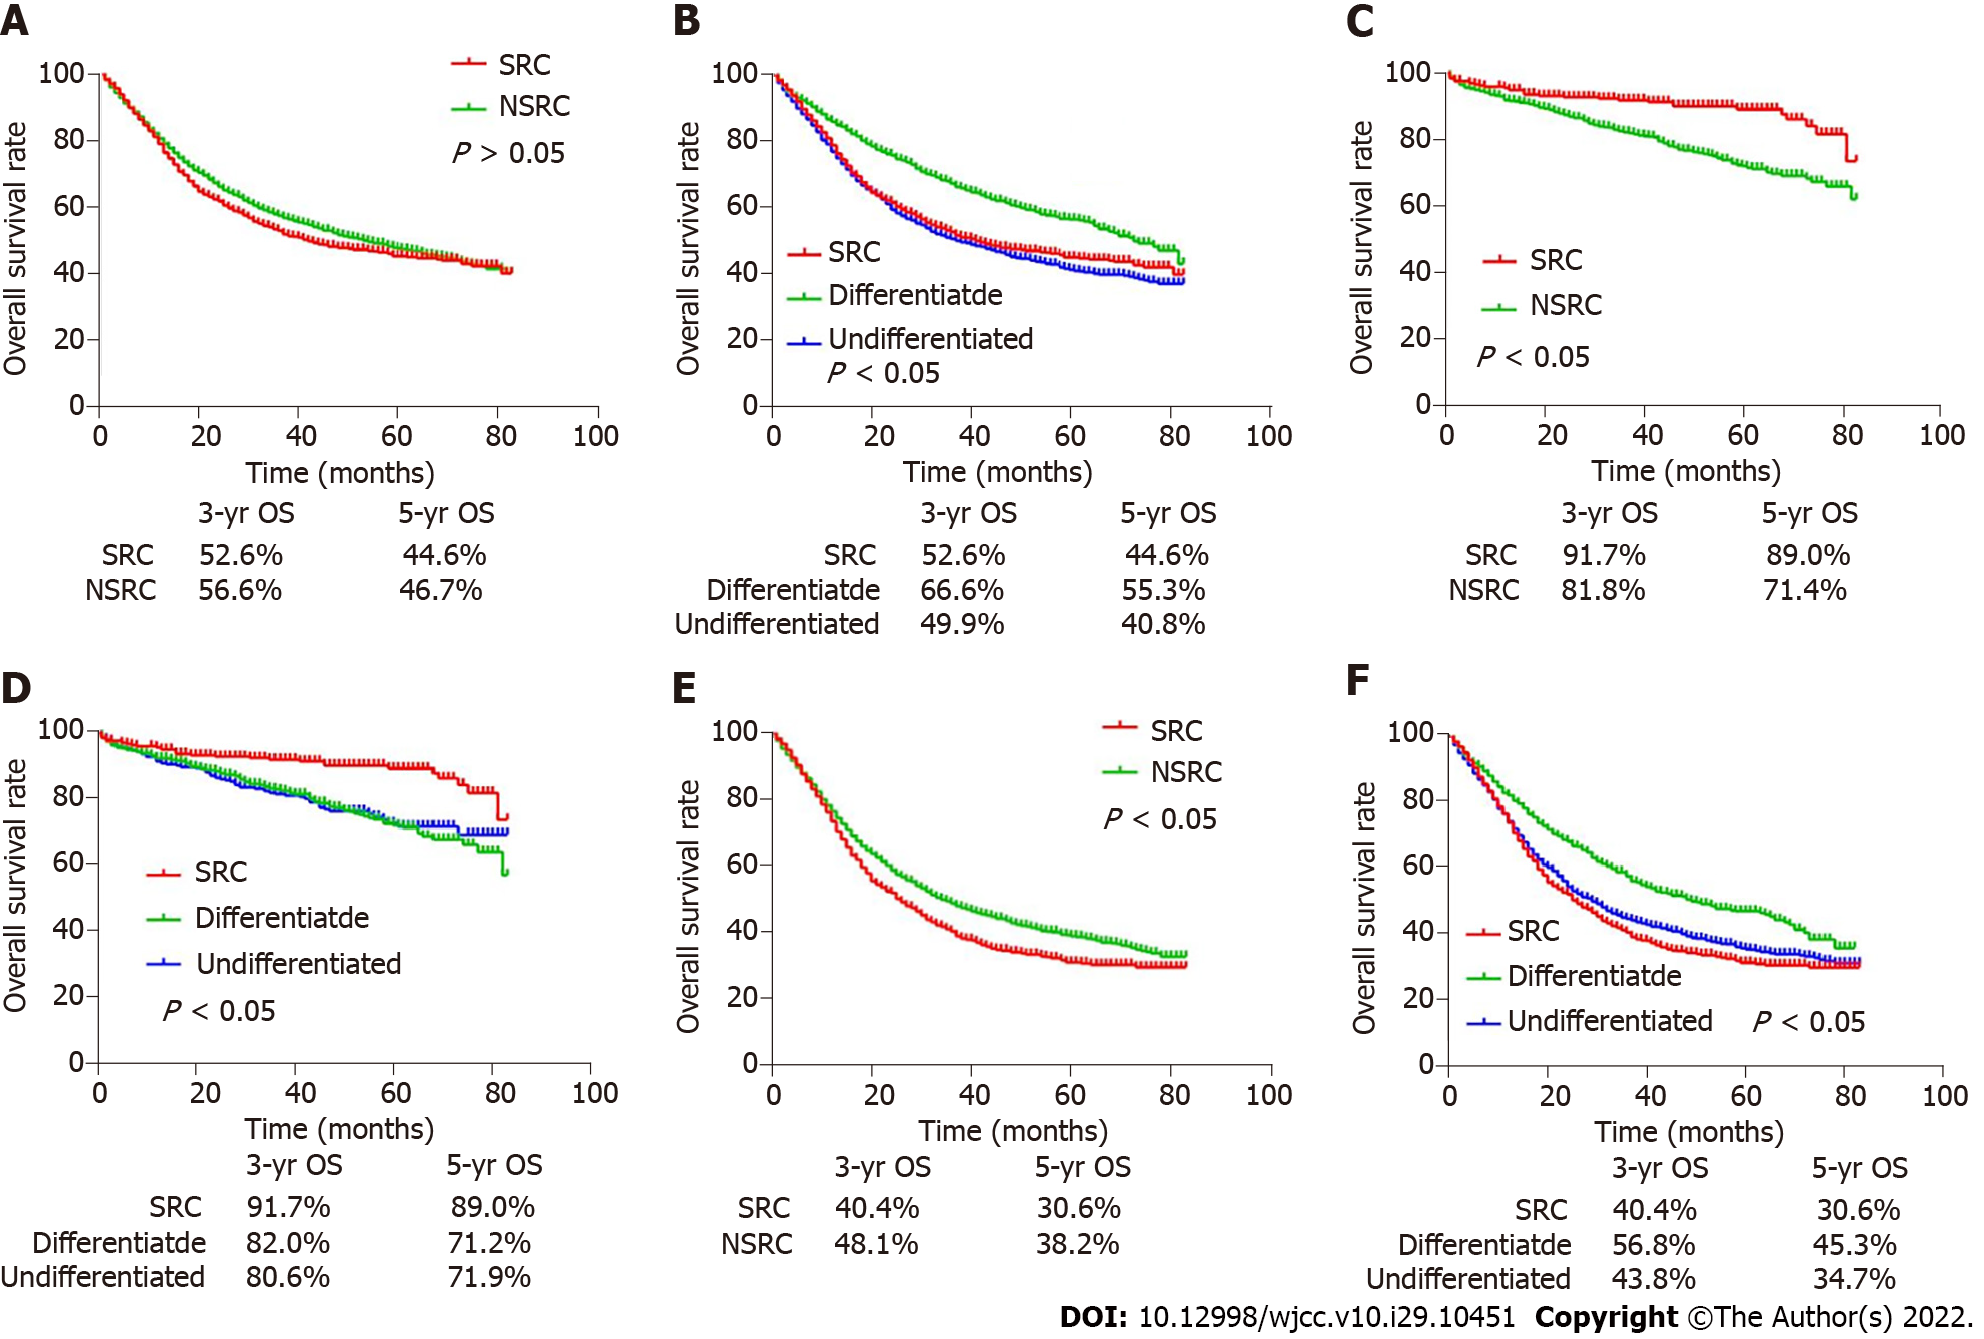
Figure 2 Kaplan-Meier overall survival curves of each group of patients in the Surveillance, Epidemiology and End Results database.
A: Signet ring cell carcinoma vs non-signet cell carcinoma (NSRC) in the overall population; B: SRC vs differentiated and undifferentiated carcinoma in the overall population; C: SRC vs NSRC in early gastric cancer (EGC) patients; D: SRC vs differentiated and undifferentiated carcinoma in EGC patients; E: SRC vs NSRC in advanced gastric cancer (AGC) patients; F: SRC vs differentiated and undifferentiated carcinoma in AGC patients. OS: Overall survival; SRC: Signet ring cell carcinoma; NSRC: Non-signet cell carcinoma.
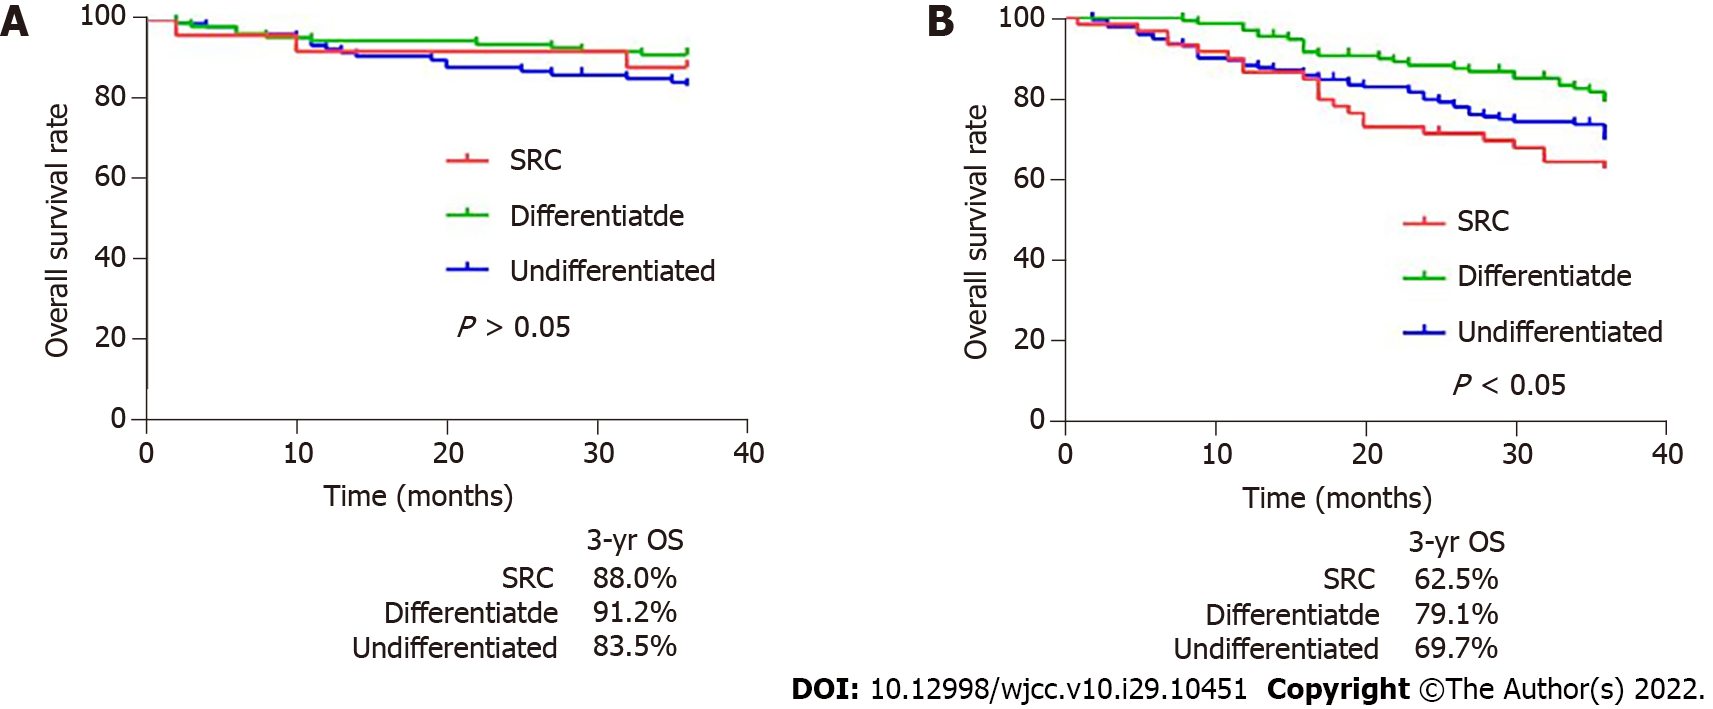
Figure 3 Kaplan-Meier overall survival curves of external validation group.
A: Early gastric cancer; B: Advanced gastric cancer. OS: Overall survival; SRC: Signet ring cell carcinoma.
Figure 4 Kaplan-Meier overall survival curves for adjuvant therapy in signet ring cell carcinoma.
A: Surveillance, Epidemiology and End Results data set; B: External validation group. OS: Overall survival.
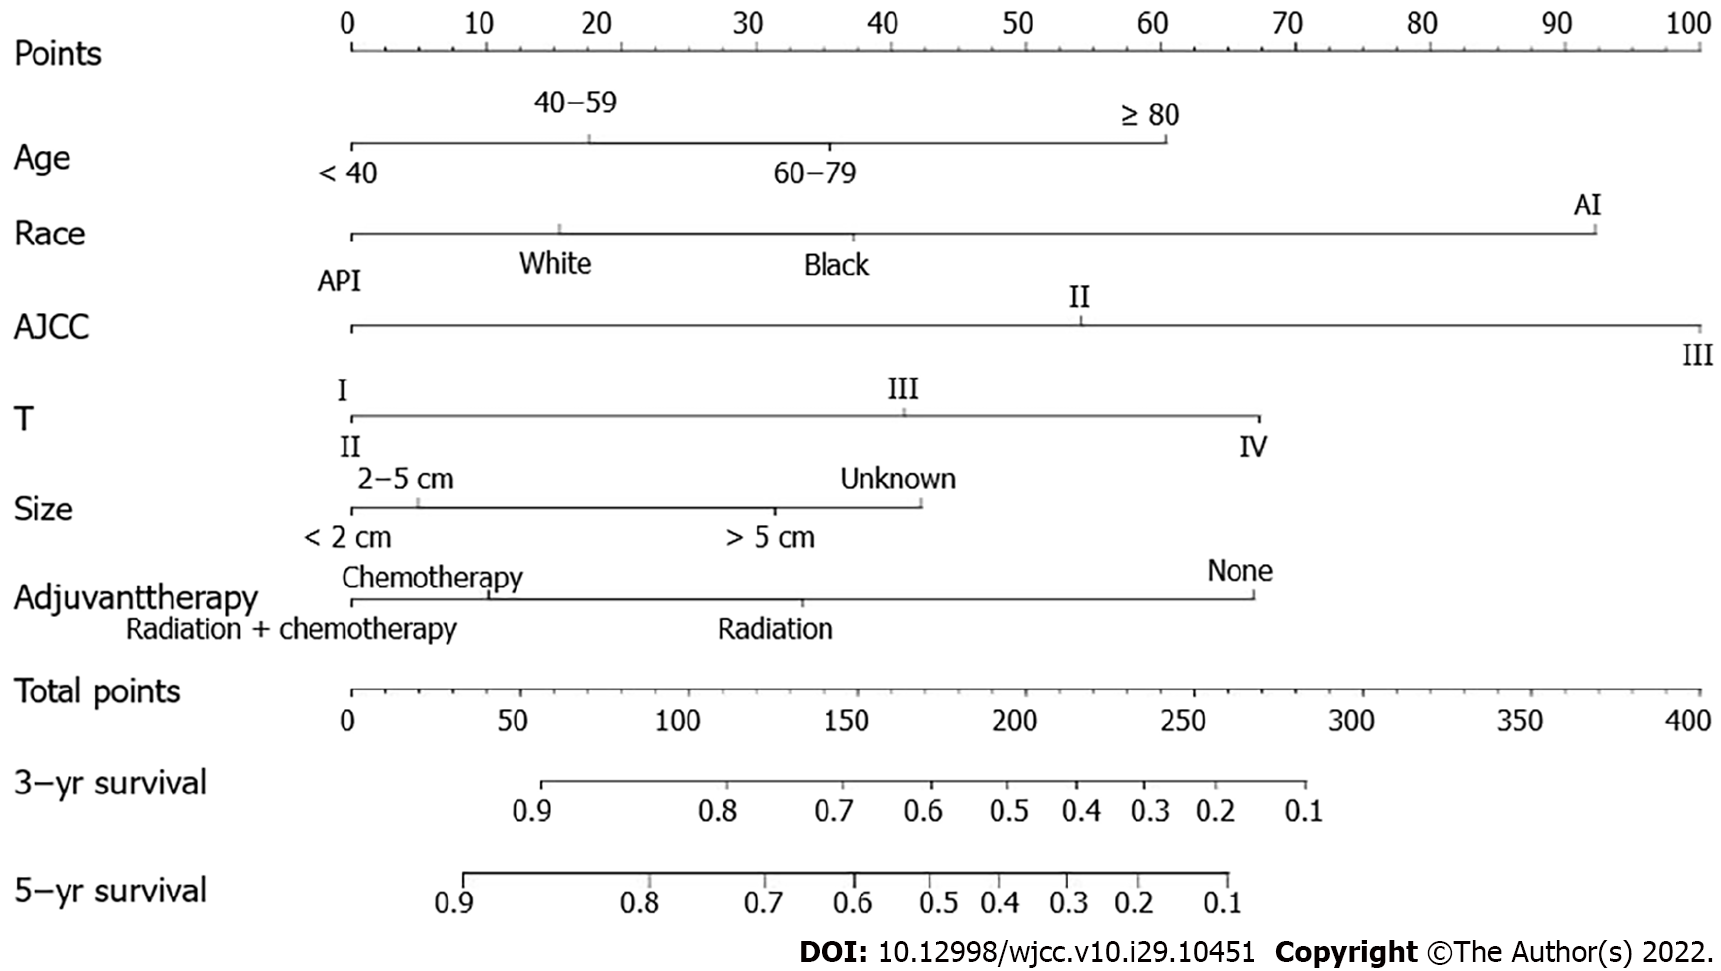
Figure 5 Nomogram for predicting the 3- and 5-year overall survival of patients with advanced gastric signet ring cell carcinoma.
The total score is calculated by adding the scores of each factor. The total score corresponds to the patient's 3- and 5-year survival probabilities.
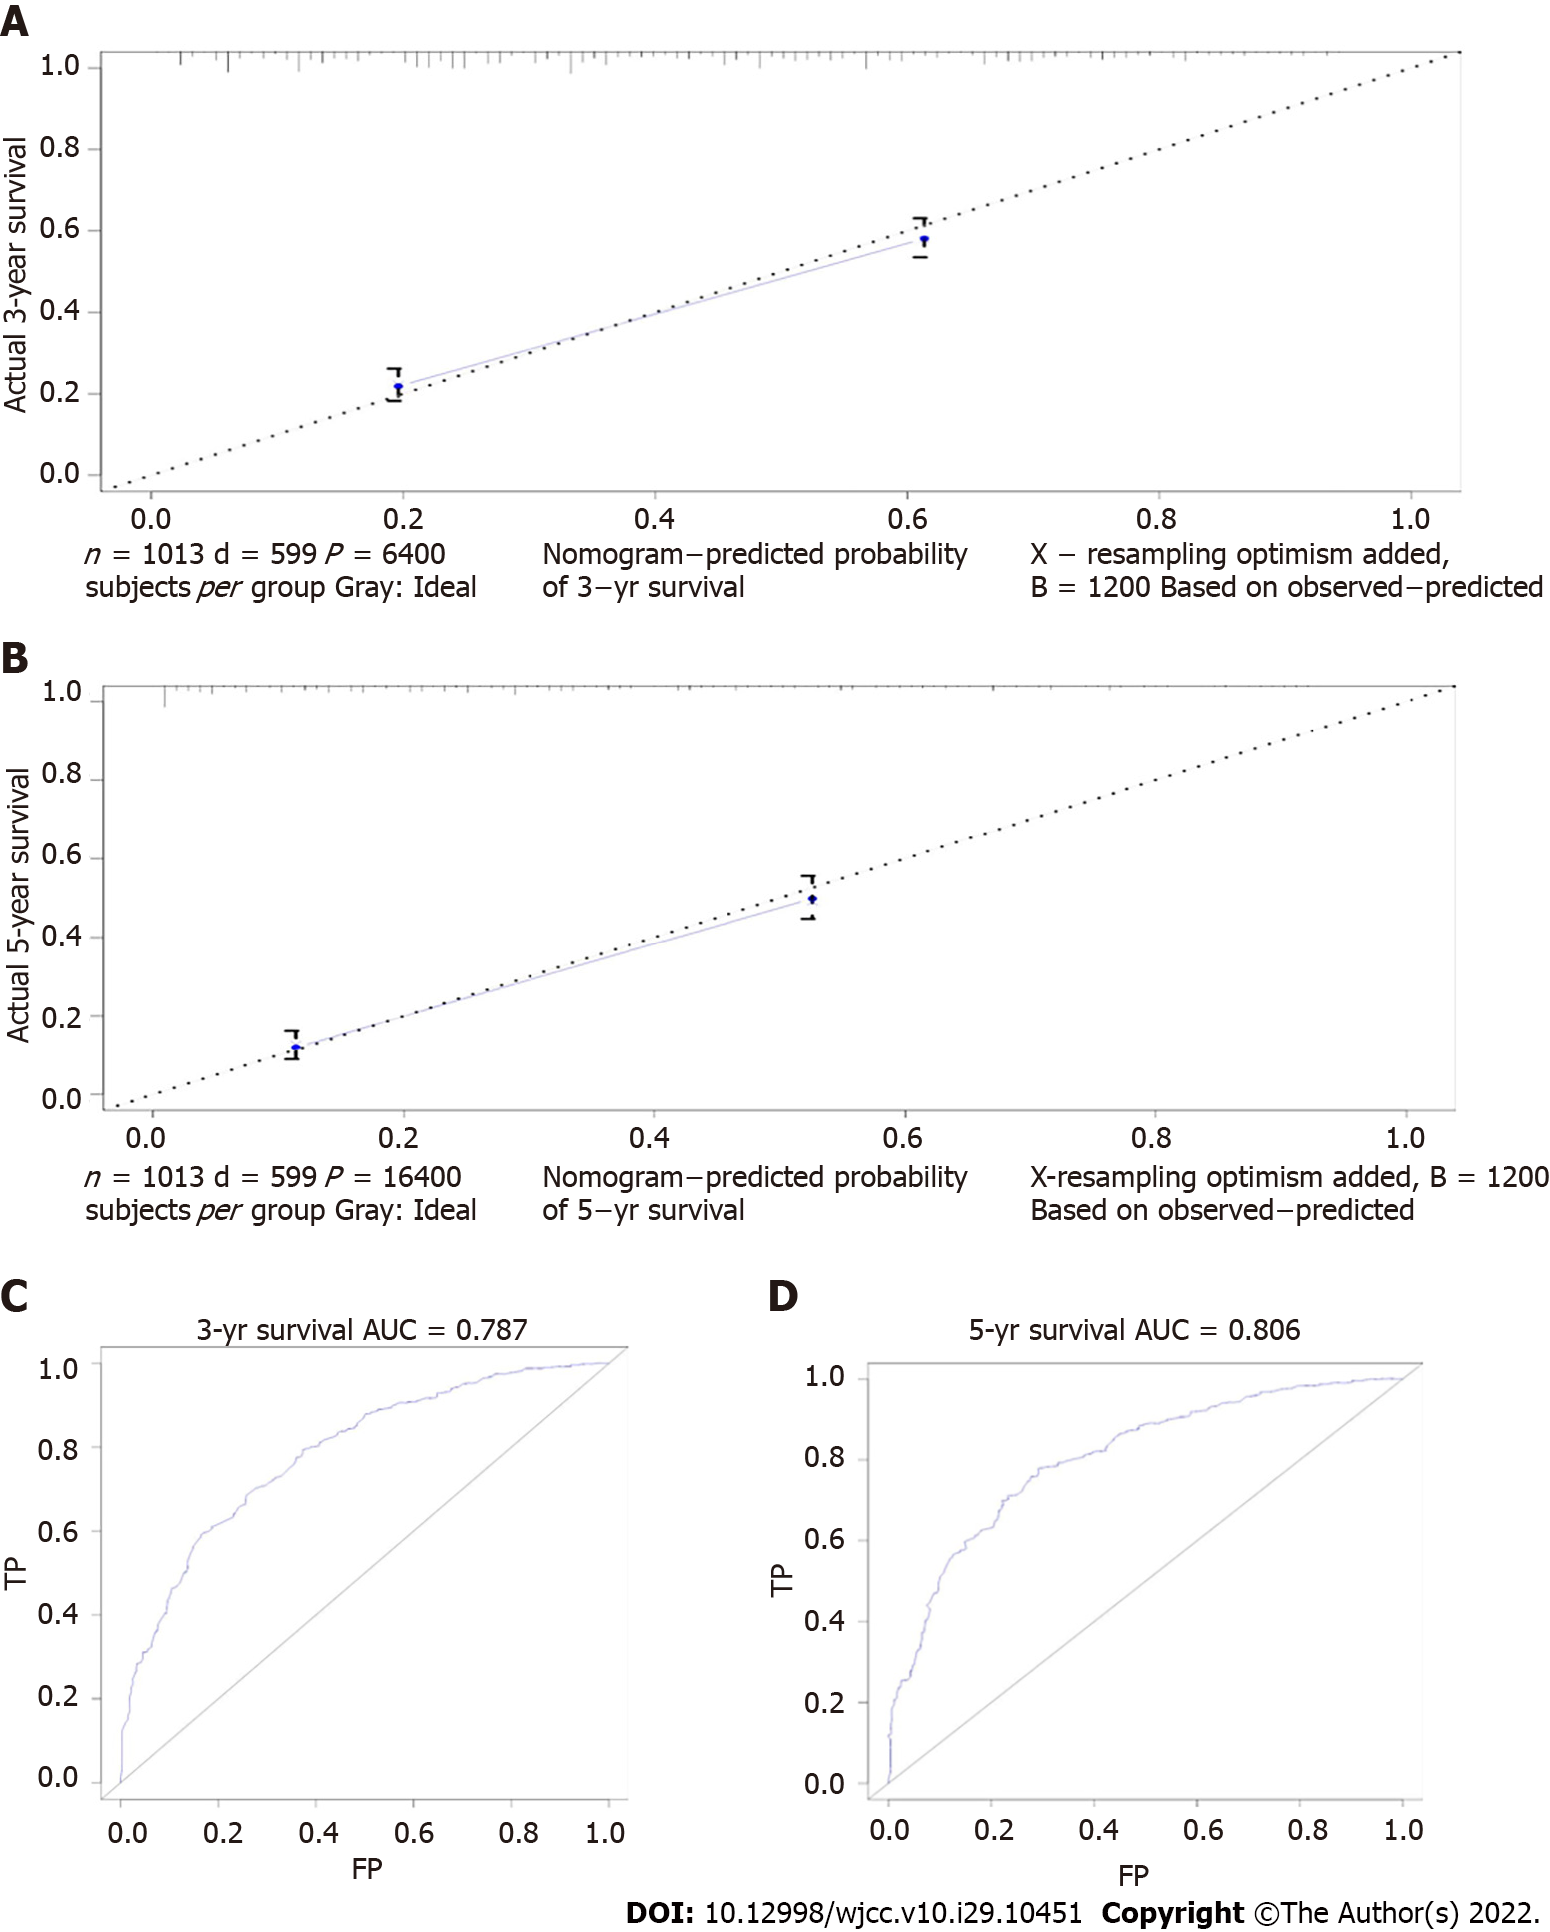
Figure 6 Prediction of 3- and 5-year overall survival.
A and B: Nomogram calibration plots to predict 3- and 5-year overall survival (OS); C and D: Nomogram ROC curves for predicting 3- and 5-year OS.
- Citation: Tian HK, Zhang Z, Ning ZK, Liu J, Liu ZT, Huang HY, Zong Z, Li H. Clinicopathological characteristics and prognosis of gastric signet ring cell carcinoma. World J Clin Cases 2022; 10(29): 10451-10466
- URL: https://www.wjgnet.com/2307-8960/full/v10/i29/10451.htm
- DOI: https://dx.doi.org/10.12998/wjcc.v10.i29.10451


