Copyright
©The Author(s) 2022.
World J Clin Cases. Aug 16, 2022; 10(23): 8141-8151
Published online Aug 16, 2022. doi: 10.12998/wjcc.v10.i23.8141
Published online Aug 16, 2022. doi: 10.12998/wjcc.v10.i23.8141
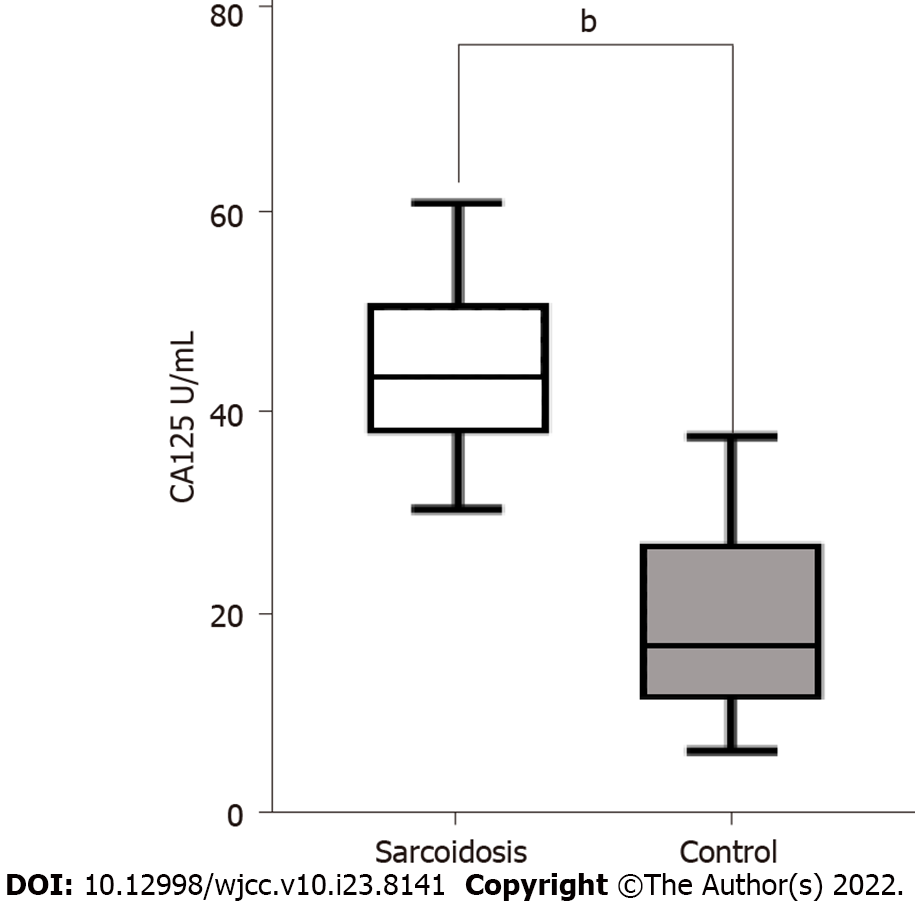
Figure 1 Carbohydrate antigen 125 levels.
Sarcoidosis patients had notably higher levels of plasma carbohydrate antigen 125 (bP < 0.001) in comparison with healthy control subjects. The solid horizontal lines indicate the medians. The boxes indicate the interquartile ranges. The black T-lines indicate the ranges of measurements. CA125: Carbohydrate antigen 125.
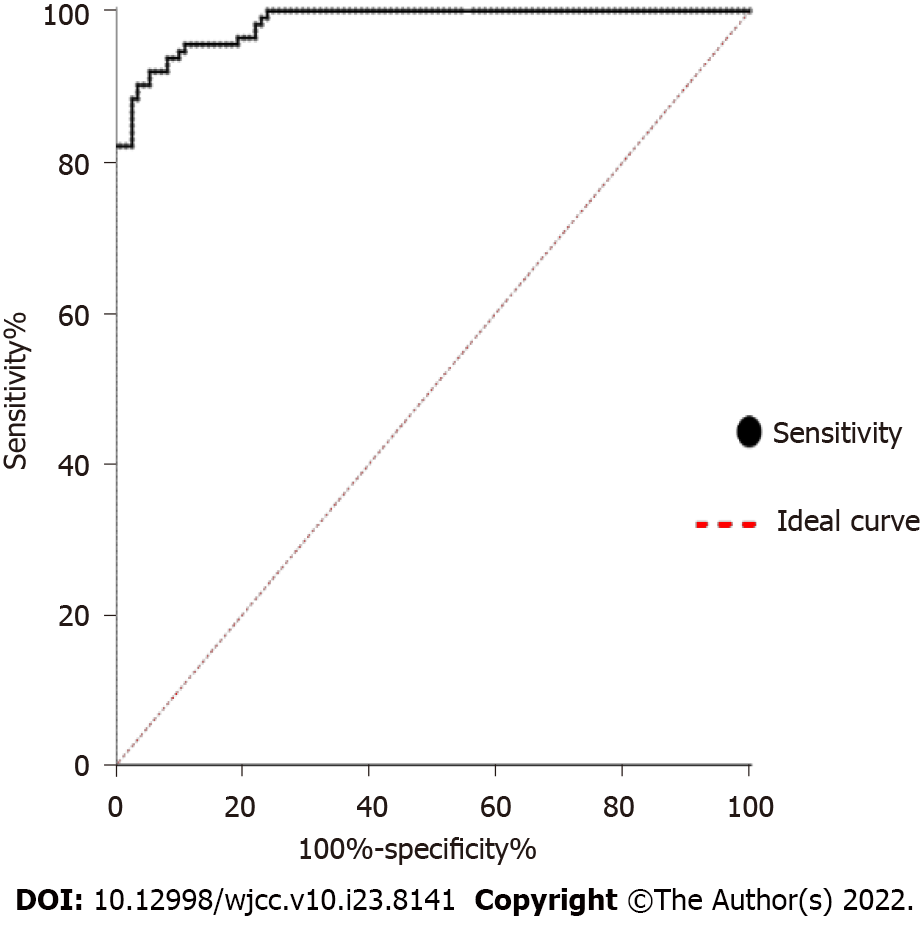
Figure 2 Receiver operating characteristic.
The curve shows the specificity and sensitivity percentages of carbohydrate antigen 125 in patients and controls. The area under the curve is 0.9833 (95%CI: 0.9717-0.9949). With a cutoff value of 32.33 U/mL, specificity is 90.2% and sensitivity is 96.3%. Positive (sarcoidosis); Negative (control).
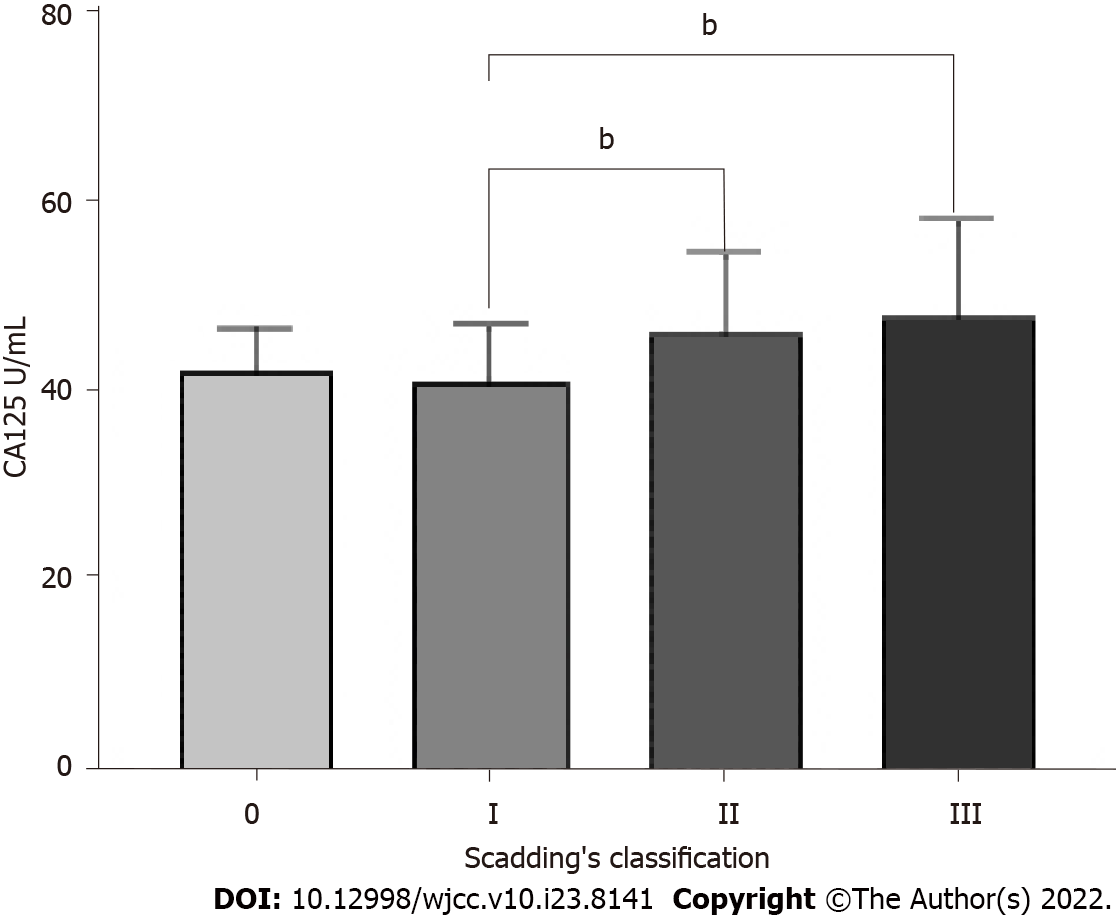
Figure 3 Comparison of serum carbohydrate antigen 125 concentration in sarcoidosis patients with different radiology stages of Scadding’s classification.
Data are expressed as mean ± SD. bP < 0.01; One-way analysis of variance. CA125: Carbohydrate antigen 125.
- Citation: Zhang Q, Jing XY, Yang XY, Xu ZJ. Diagnostic value of elevated serum carbohydrate antigen 125 level in sarcoidosis. World J Clin Cases 2022; 10(23): 8141-8151
- URL: https://www.wjgnet.com/2307-8960/full/v10/i23/8141.htm
- DOI: https://dx.doi.org/10.12998/wjcc.v10.i23.8141


