Copyright
©2013 Baishideng Publishing Group Co.
World J Nephrol. Nov 6, 2013; 2(4): 111-124
Published online Nov 6, 2013. doi: 10.5527/wjn.v2.i4.111
Published online Nov 6, 2013. doi: 10.5527/wjn.v2.i4.111
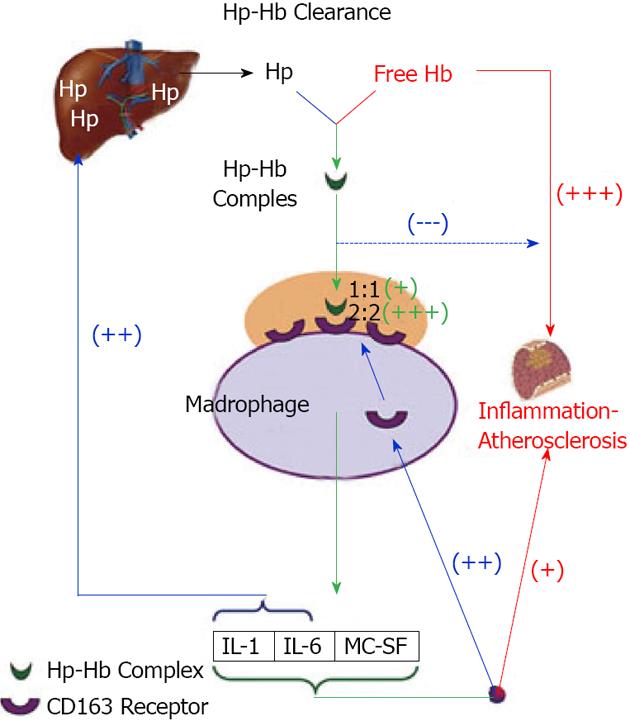
Figure 1 Hemoglobin-haptoglobin complex clearance by macrophage CD163 receptor.
Hp: Haptoglobin; Hb: Hemoglobin; MC-SF: Macrophage colony-stimulating factor; IL: Interleukin.
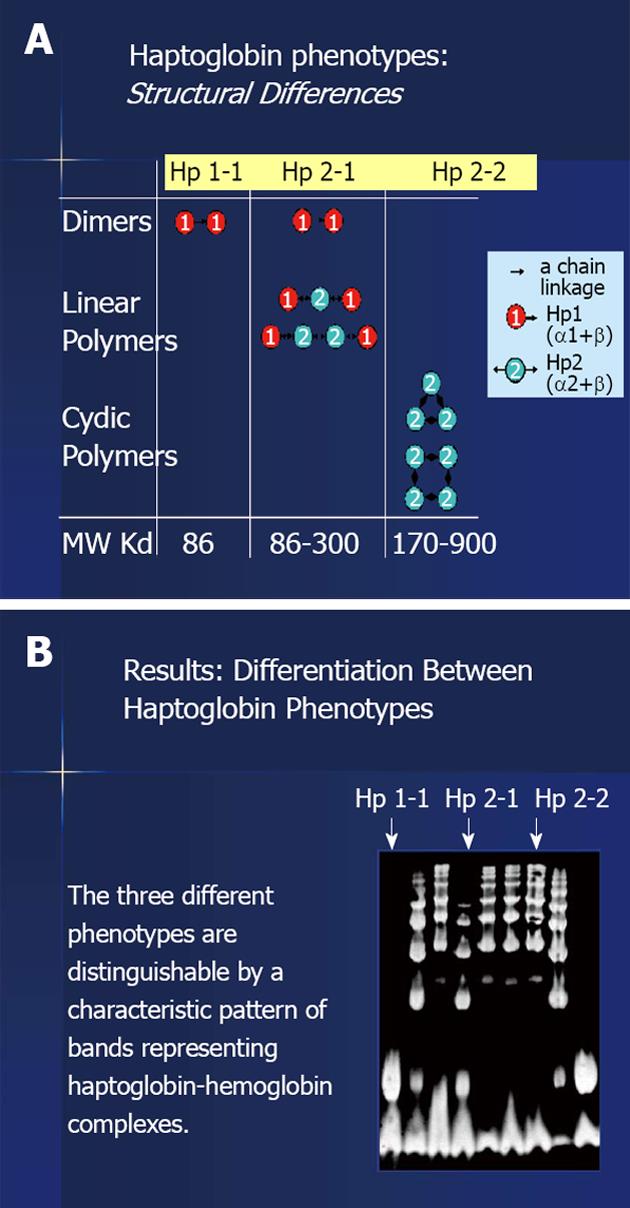
Figure 2 Haptoglobin structure and gel electrophoresis.
A: Haptoglobin phenoytpes; B: Results. Hp: Haptoglobin.
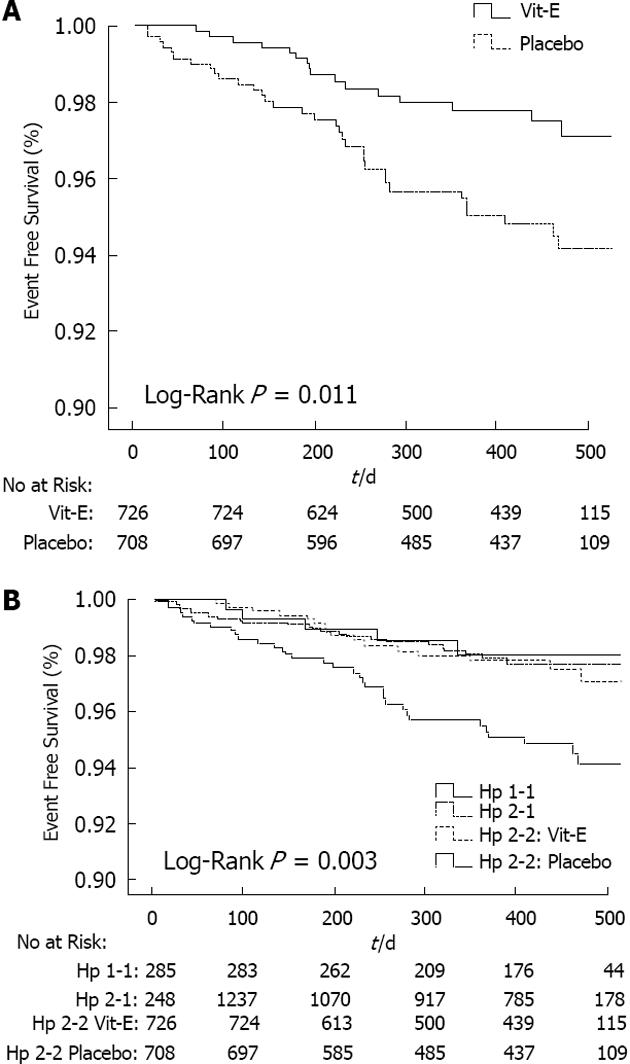
Figure 3 Kaplan-Meier plot.
A: The composite end point in haptoglobin (Hp) 2-2 Hp diabetes mellitus (DM) individuals allocated to vitamin (Vit) E or Placebo. Events are cardiovascular death, myocardial infarction or stroke. There was a significant decrease in the composite end point in the vitamin E group compared with placebo group (P = 0.01 by Log-Rank); B: The composit end point in Hp 1-1 and Hp 2-1 DM individuals compared with Hp 2-2 DM individuals receiving vitamin E or placebo.
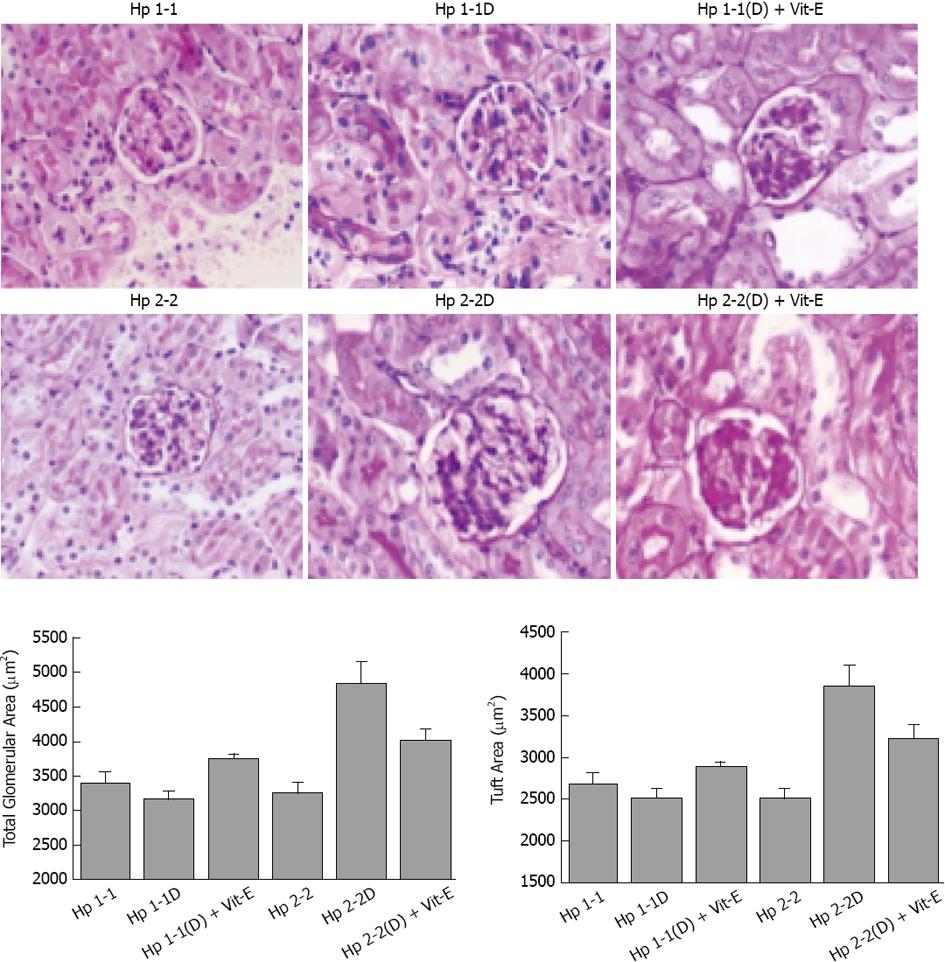
Figure 4 Total glomerular and glomerular tuft area is increased in haptoglobin 2-2 diabetes mellitus mice.
Periodic acid-Schiff stained, paraffin-embedded sections from kidneys of haptoglobin (Hp) 1-1 and Hp 2-2 mice with D or without diabetes mellitus (DM). Areas were measured using Image Pro software. Values are expressed as mean ± SE (30 glomeruli measured for each animal). There was a significant increase in total glomerular area in Hp 2-2 DM mice vs Hp 1-1 DM mice (P < 0.001) as well as between Hp 2-2 DM and Hp 2-2 non-DM mice (P < 0.001). There was a significant decrease in total glomerular area in Hp 2-2 DM mice with vitamin E (Vit-E; P < 0.05).
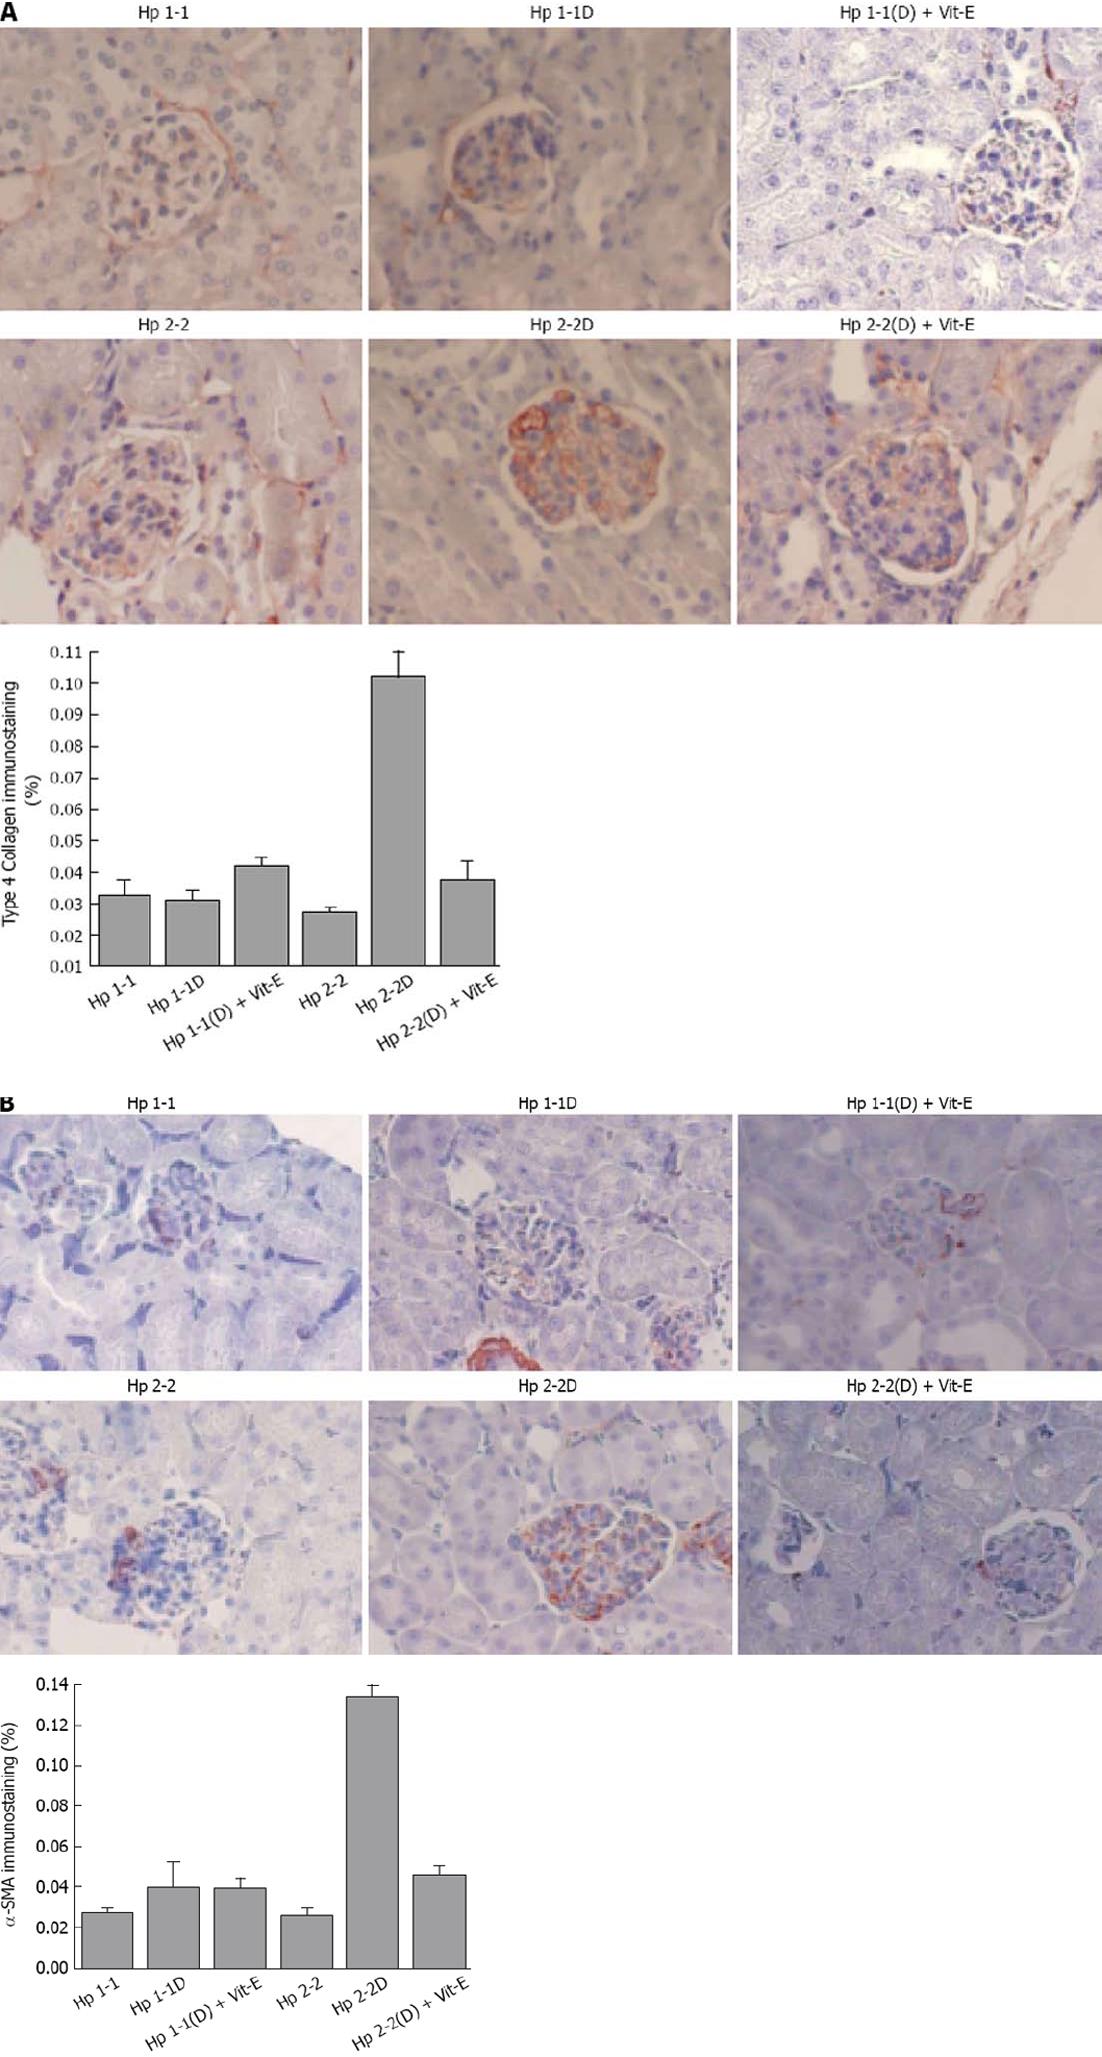
Figure 5 Increased mesangial collagen IV and smooth muscle actin in haptoglobin 2-2 diabetes mellitus mice.
A: Increased mesangial collagen IV in haptoglobin (Hp) 2-2 diabetes mellitus (DM) mice. Quantitation of the immunostaining area was reported in % area of the glomeruli. All values are expressed as means SE (30 glomeruli for each animal). There was a significant increase in collagen IV immunostaining (%) in Hp 2-2 DM vs Hp 1-1 DM mice (P < 0.001) and Hp 2-2 non-DM mice (P < 0.001). There was a significant decrease in collagen IV immunostaining area in Hp 2-2 DM mice with vitamin (Vit)-E (P < 0.05); B: Increased smooth muscle actin in Hp 2-2 DM mice. Immunohistochemical identification of smooth muscle actin (orange-red) was performed using a monoclonal antibody to mouse smooth muscle actin . All values are expressed as mean ± SE. Quantitation of actin staining was performed similar to collagen (as% of glomerular area) with a highly significant increase in actin staining in Hp 2-2 DM mice vs Hp 1-1 DM mice (P < 0.001) and Hp 2-2 non-DM mice (P < 0.001). There was a significant decrease in actin staining in Hp 2-2 DM mice treated with vitamin E (Vit-E) (P < 0.001).
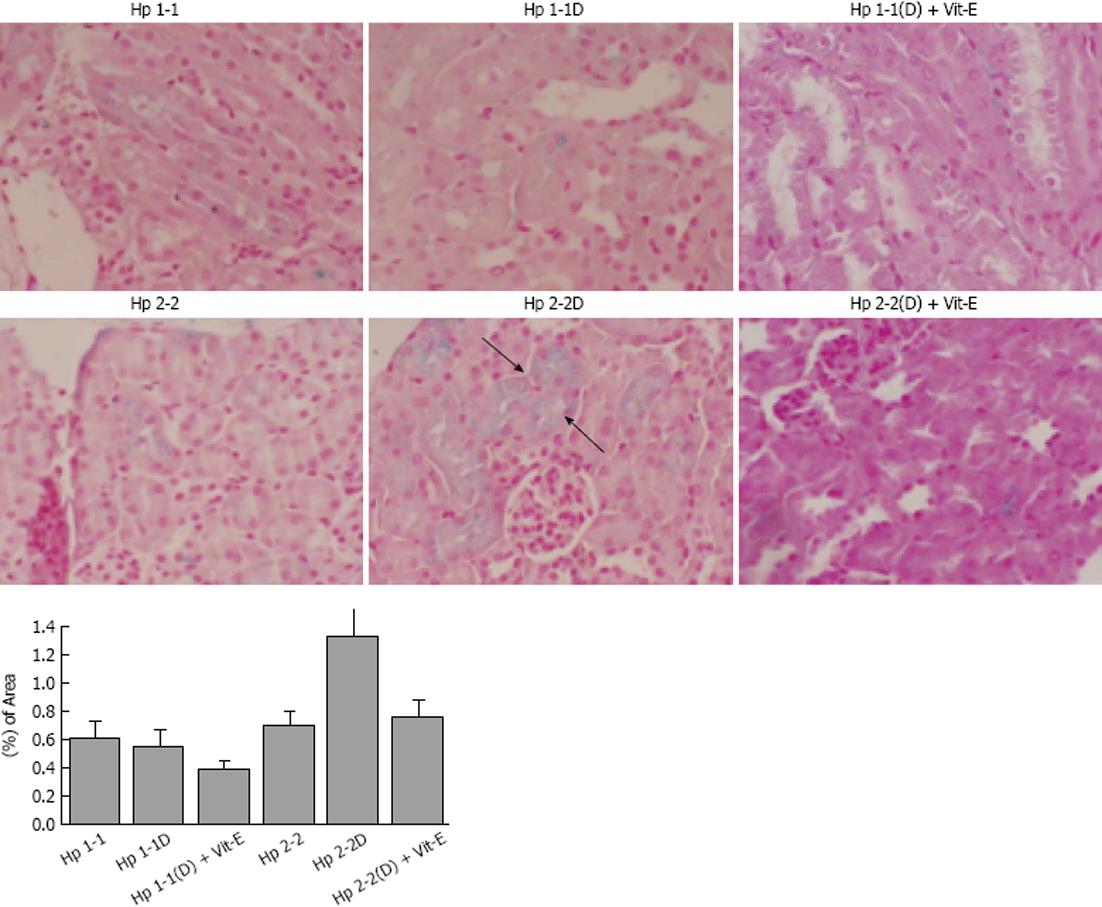
Figure 6 Increased renal iron deposition in the proximal tubule of haptoglobin 2-2 diabetes mellitus mice.
Perl’s iron stain was used to localize iron in paraffin-embedded kidney sections in haptoglobin (Hp) 1-1 and Hp 2-2 mice with and without diabetes mellitus (DM). Arrow indicates iron-induced stain in blue (× 400 magnification) located within proximal tubular cells. There was a significant increase in iron staining in the renal tissue of Hp 2-2 DM (D) vs Hp 1-1 DM (D) and Hp 2-2 non-DM mice (P < 0.001).
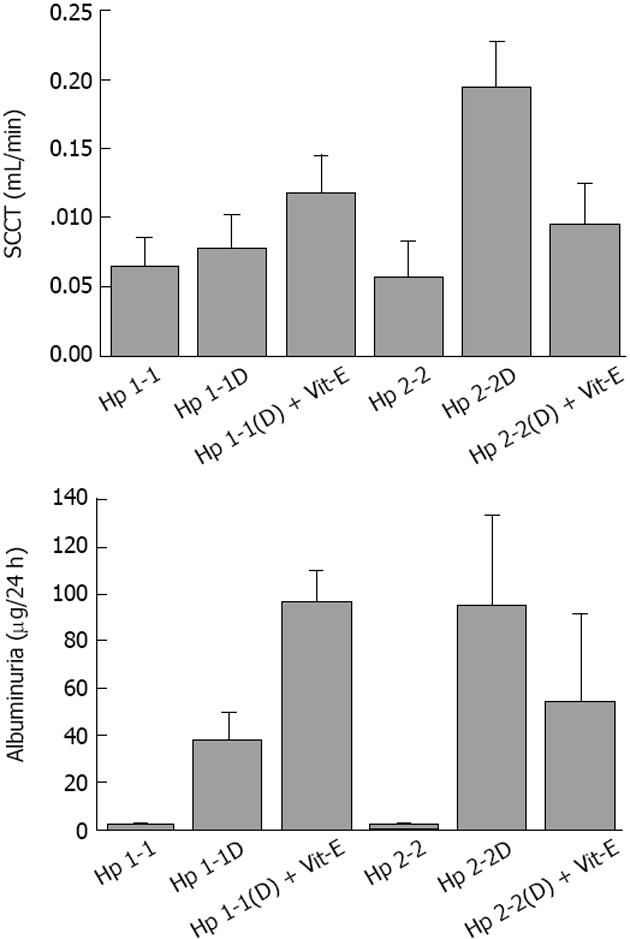
Figure 7 Creatinine clearance and albuminuria are increased in haptoglobin 2-2 diabetes mellitus mice.
Creatinine clearance time (CCT). Values are reported as mean ± SE in mL/min of a minimum of 5 animals from each group. There was a significant increase in CCT in haptoglobin (Hp) 2-2 diabetes mellitus (DM) mice compared with Hp 1-1 DM mice (P < 0.05) and Hp 2-2 non-DM mice (P < 0.05). There was a significant decrease in CCT in Hp 2-2 DM mice treated with vitamin (Vit)-E (P < 0.05). We found a marked increase in albuminuria in both Hp 1-1 DM and Hp 2-2 DM mice compared with their non-DM littermates and a nonsignificant 2- to 3-fold increase in albuminuria in Hp 2-2 DM mice compared with Hp 1-1 DM mice (95.3 ± 38.0 vs 37.9 ± 11.9, P < 0.16).
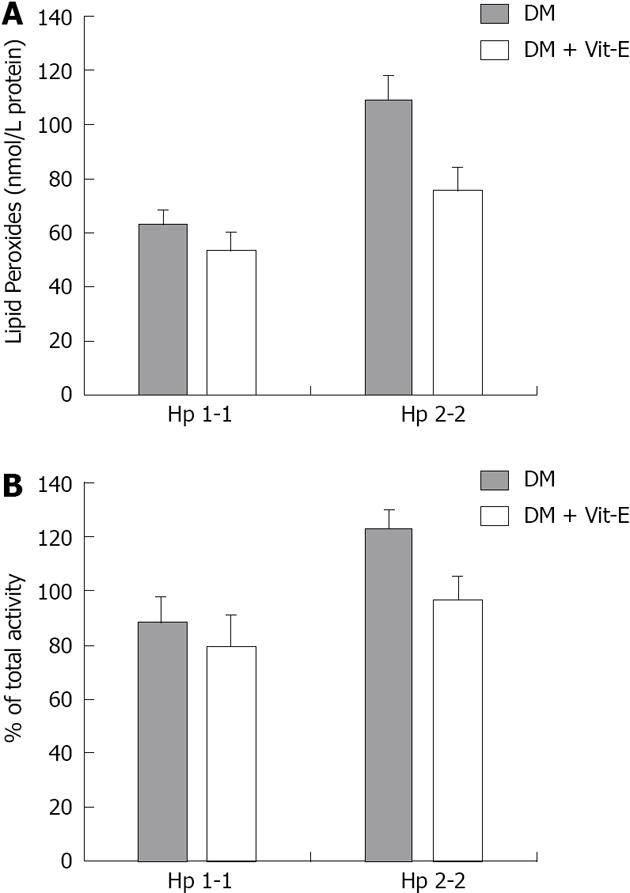
Figure 8 Effect of vitamin E supplementation on lysosomal membrane lipid peroxides and membrane integrity.
A: Lysosomal membrane lipid peroxides were significantly reduced in haptoglobin (Hp) 2-2 diabetes mellitus (DM) mice which received vitamin E supplementation as compared to Hp 2-2 DM mice receiving placebo (P = 0.03); B: Lysosomal membrane activity was reduced in Hp 2-2 DM mice received vitamin E (Vit-E) supplementation as compared to Hp 2-2 DM mice receiving placebo (P = 0.03).
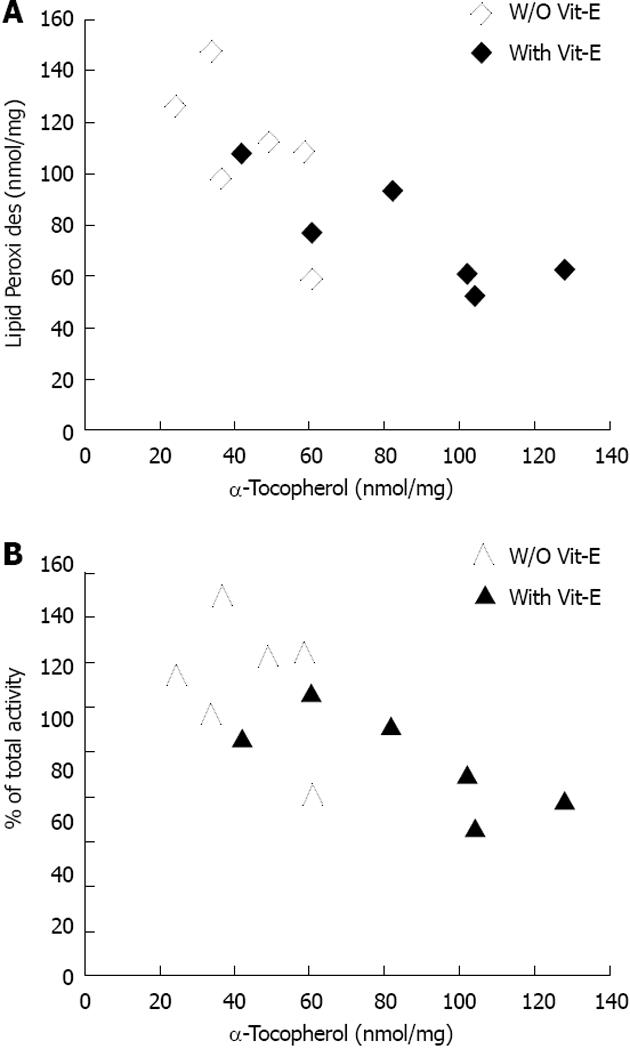
Figure 9 Lysosomal vitamin E.
A: Lysosomal vitamin E (Vit-E) concentration is correlated with lysosomal membrane lipid peroxidation and lysosomal membrane integrity. Filled symbols are data points for mice receiving Vit-E supplementation while empty symbols are data points for mice who received placebo; B: Lysosomal Vit-E and lysosomal membrane integrity.
- Citation: Farid N, Inbal D, Nakhoul N, Evgeny F, Miller-Lotan R, Levy AP, Rabea A. Vitamin E and diabetic nephropathy in mice model and humans. World J Nephrol 2013; 2(4): 111-124
- URL: https://www.wjgnet.com/2220-6124/full/v2/i4/111.htm
- DOI: https://dx.doi.org/10.5527/wjn.v2.i4.111


