Published online May 19, 2023. doi: 10.5498/wjp.v13.i5.234
Peer-review started: March 9, 2023
First decision: March 23, 2023
Revised: March 31, 2023
Accepted: April 7, 2023
Article in press: April 7, 2023
Published online: May 19, 2023
Processing time: 71 Days and 2.8 Hours
Developing methods to monitor exercise load and evaluate body fatigue and muscle injury over time in hiking training remains a key problem to be solved. A widely used psycho-physical tool to assess the subjective perception of effort during exercise is Borg’s rating of perceived exertion (BRPE) scale. Data on the relationships and validity of the BRPE compared to objectively assessed metabolic criteria are still lacking, especially urinary organic acid concentrations.
To verify whether the BRPE scale could be used in the prescription of outdoor hiking with weight-bearing and reveal the relationship between the BRPE scale and urinary physiological measures.
Eighty-nine healthy men (average age: 22 years) were enrolled in a 40 km (6 h) hiking training exercise with a 20 kg load. After training, the BRPE scale (6-20) was completed. All participants were divided into three groups according to the rating of the BRPE scale. Urine samples were collected before and after training. Urinary myoglobin levels were measured immediately using the fluorescent immunoassay method. The remaining urine was subpacked and frozen for the subsequent detection of urinary organic acids using gas chromatography and mass spectrometry.
The contents of organic acids and myoglobin in urine were significantly increased after participants hiked 40 km (6 h) with a 20 kg load. Only orthogonal partial least-squares discrimination analysis performed well in separating the group with a BRPE score of 6-12 from the group with a BRPE score of 13-20. Significant differences in the urine levels of several organic acids were observed between the two groups, and the heatmap also presented different metabolic profiles based on BRPE. According to the standard of a variable importance in the projection > 1, fold change > 1.5 and P < 0.05, 19 different metabolites of urinary organic acids were screened and enriched in pathways mainly including the citrate cycle (tricarboxylic acid cycle) and alanine, aspartate and glucose metabolism.
The BRPE scale identified significantly different urinary organic acid profiles between the higher and lower BRPE value groups, and, thus, could be used to monitor body fatigue in individuals participating in long-distance outdoor hiking with weight bearing.
Core Tip: Developing methods to monitor exercise load and evaluate body fatigue over time in endurance training is a key problem to be solved. Borg’s rating of perceived exertion (BRPE) scale has been widely used as a psycho-physical tool to assess the subjective perception of effort during exercise. In this study, we aimed to verify whether the BRPE scale could be used in the prescription of outdoor hiking with weight-bearing and reveal the relationship between the BRPE scale and urinary physiological measures, particularly urinary organic acid concentrations. Underlying mechanisms related to body fatigue and metabolic disorders were also analyzed in this study.
- Citation: Sang PP, Li J, Tan XD, Peng W, Zhou HH, Tian YP, Zhang ML. Associations between Borg’s rating of perceived exertion and changes in urinary organic acid metabolites after outdoor weight-bearing hiking. World J Psychiatry 2023; 13(5): 234-246
- URL: https://www.wjgnet.com/2220-3206/full/v13/i5/234.htm
- DOI: https://dx.doi.org/10.5498/wjp.v13.i5.234
Long-distance weight-bearing hiking in the field is an important part of physical training, that helps improve cardiopulmonary endurance and muscle endurance. Many countries use this type of exercise as an essential component of endurance training for soldiers[1,2]. In this process, an excessive exercise load may lead to fatigue accumulation, which imposes risks of physical and mental stress[3]. It represents an inconspicuous and gradual process. If overtraining continues, more severe injury in soft tissue or skeletal muscle will occur[4,5]. Therefore, developing methods to monitor exercise load and evaluate muscle injury and body fatigue over time remains a key problem to be solved.
Exercise tests have been conducted for more than 60 years[6]. Many indices, such as lactate, creatine kinase, and myoglobin, which are based on blood biochemical tests, have been applied during exercise monitoring[7,8]. However, these invasive tests with complex methodologies and high costs are difficult to implement in the field. Noninvasive tools and indices are needed to assess the intensity of physical activity during outdoor hiking exercise interventions.
A widely used psycho-physical tool to assess the subjective perception of effort during exercise is Borg’s rating of perceived exertion (BRPE) scale[9-11]. It assesses the mental load of exercise with the subjective level of physical exertion. First, the subjective level of physical exertion is divided into scores ranging from 6-20[9]. Later, other rating methods, such as methods with 10 levels and 100 levels, also appeared[12,13]. A BRPE value of 10 times was used to estimate the heart rate of the trainer. The American College of Sports Medicine has suggested that the BRPE value may be considered to add precision to heart rate when monitoring exercise intensity and even replace it once the relationship between the heart rate and BRPE value is known for an individual[14]. With the advantages of simplicity, economy and strong operability, the BRPE scale facilitates the collection of training load data efficiently and conveniently. Many studies have revealed that the BRPE value is useful both in the prescription of alternated-intensity training exercises and continuous tests in a laboratory[15-17], underlining the strong relationships between the BRPE value and the indices of physiological strains. Nevertheless, only a few studies have been performed within a more ecologically valid environment. Previous studies examining hiking have reported that the BRPE scale is significantly higher as load mass increases[18]. However, data revealing the relationships and validity of the BRPE value compared to objectively assessed metabolic criteria, especially urine organic acid concentrations, are still lacking.
In the present study, we examined the relationship between the BRPE scale and physiological measures (urinary organic acid metabolite and myoglobin levels) of exercise intensity after 40 km outdoor hiking with weight-bearing of approximately 20 kg. The aim of this study was to verify whether the BRPE score collected after hiking could be used to prescribe these training exercises.
This study included 89 healthy young men (average age: 22 years, range from 18 to 24 years). Individuals with basic diseases, such as heart and lung disease, anemia, bone injury, and hypertension, and those who were taking drugs were excluded. Individuals with fever or musculoskeletal or soft tissue injury in the 7 d before hiking were also excluded. All participants signed the informed consent form. This study was reviewed and approved by the Ethics Committee of Chinese PLA General Hospital (S2021-019-01).
All participants experienced a hiking training exercise of 40 km with 20 kg carriages in plain areas. The whole training exercise lasted from 8:00 to 14:00. Two short 10-min breaks were allotted to supply water and a longer 30-min break was provided at 11:00 am for the prescribed lunch.
At the end of training, everyone truthfully completed the BRPE scale (Table 1), and urine samples were collected before and after training. The level of myoglobin in urine was measured immediately, and the remaining urine was separated and frozen at -80 °C for organic acid measurements.
| Score | Perceived exertion |
| 6 | No exertion at all |
| 7 | Extremely light |
| 8 | |
| 9 | Very light |
| 10 | |
| 11 | Light |
| 12 | |
| 13 | Somewhat hard |
| 14 | |
| 15 | Hard |
| 16 | |
| 17 | Very hard |
| 18 | |
| 19 | Extremely hard |
| 20 | Maximal exertion |
According to the instructions of the myoglobin assay kit (fluorescence immunochromatography) (Beijing Danda Biotechnology Co., Ltd. Beijing, China), the level of myoglobin in urine was determined using a fluorescence immunoassay analyzer (Beijing Danda Biotechnology Co., Ltd. Beijing, China). First, information from the calibration card was input into the analyzer, and the standard curve of the urine sample type was selected. Then, the test card was removed, and 80 μL of the urine sample was added into the sampling hole of the test card. After 15 min, the test strip was placed into the dry fluorescent immunoassay analyzer to read the data. The chemical signal was measured and analyzed to quantitatively obtain the myoglobin concentration in the tested sample.
Sample prehandling: One hundred microliters of urine was mixed with 30 μL of urease and incubated at 37 °C for 30 min. Next, 100 μL of the internal standard (margaric acid, 100 ppm) and 1 mL of absolute ethanol were added and the mixture was centrifuged at 13000 rpm for 5 min at 4 °C. The supernatant was extracted, and after adding 2% hydroxylamine hydrochloride, it was added to the supernatant, it was incubated at 60 °C for 10 min. After cooling at room temperature, the supernatant was transferred to a glass bottle and dried with nitrogen. Finally, 100 μL of BSTFA + TMCS (99:1) were added and incubated at 80 °C for 30 min, and gas chromatography and mass spectrometry (GC/MS, TSQ 8000 EVO, Thermo Scientific, United States) was used for the organic acid analysis.
GC/MS parameters: The chromatography column was a DB-5 column (30 m × 0.25 mm × 0.25 μm) purchased from Agilent Technologies Inc. The injection temperature and transfer line temperature were set to 250 °C and 290 °C, respectively. The injection volume was 1 μL, the split mode was selected with a ratio of 1:20, and the flow rate of high purity helium was 1 mL/min. The initial oven temperature was set to 100 °C and maintained for 4 min; then it was heated at a rate of 4 °C/min to 280 °C and maintained for 7 min.
GC/MS acquisition: Standard solutions (Zhejiang Biosan Biochemical Technologies Co., Ltd., China) of organic acids were prepared using the procedures described above and analyzed with a scan range of 50-550 m/z using Xcalibur software (ver. 2.1, Thermo Scientific, United States). The characteristic retention time and fragment ions of each organic acid were determined, and an organic acid database was established. Next, the instrument acquisition method was established by performing timed acquisition with the scan type of single iron monitoring (SIM). Timed acquired SIM data were analyzed using Trance Founder software (ver. 3.0, Thermo Scientific, United States). The GC/MS data of urine samples were qualitatively compared with the spectrometry database, and the final results were reported as the ratio of the peak area of the detected compound to the peak area of the internal standard.
Data are presented as the means ± SD for normally distributed data or medians + interquartile ranges for nonnormally distributed data. For statistical comparisons, independent sample t tests or Mann-Whitney U tests (nonnormally distributed data) were performed using SPSS 25.0 and GraphPad Prism 8.0 software. SIMCA14.1.0 software was used for principal component analysis (PCA) and orthogonal partial least-squares discrimination analysis (OPLS-DA). Heatmaps and radar charts were processed on the Xiantao website (http://www.xiantao.love). The pathway analysis was performed using MetaboAnalyst 5.0 (https: //www.metaboanalyst.ca/).
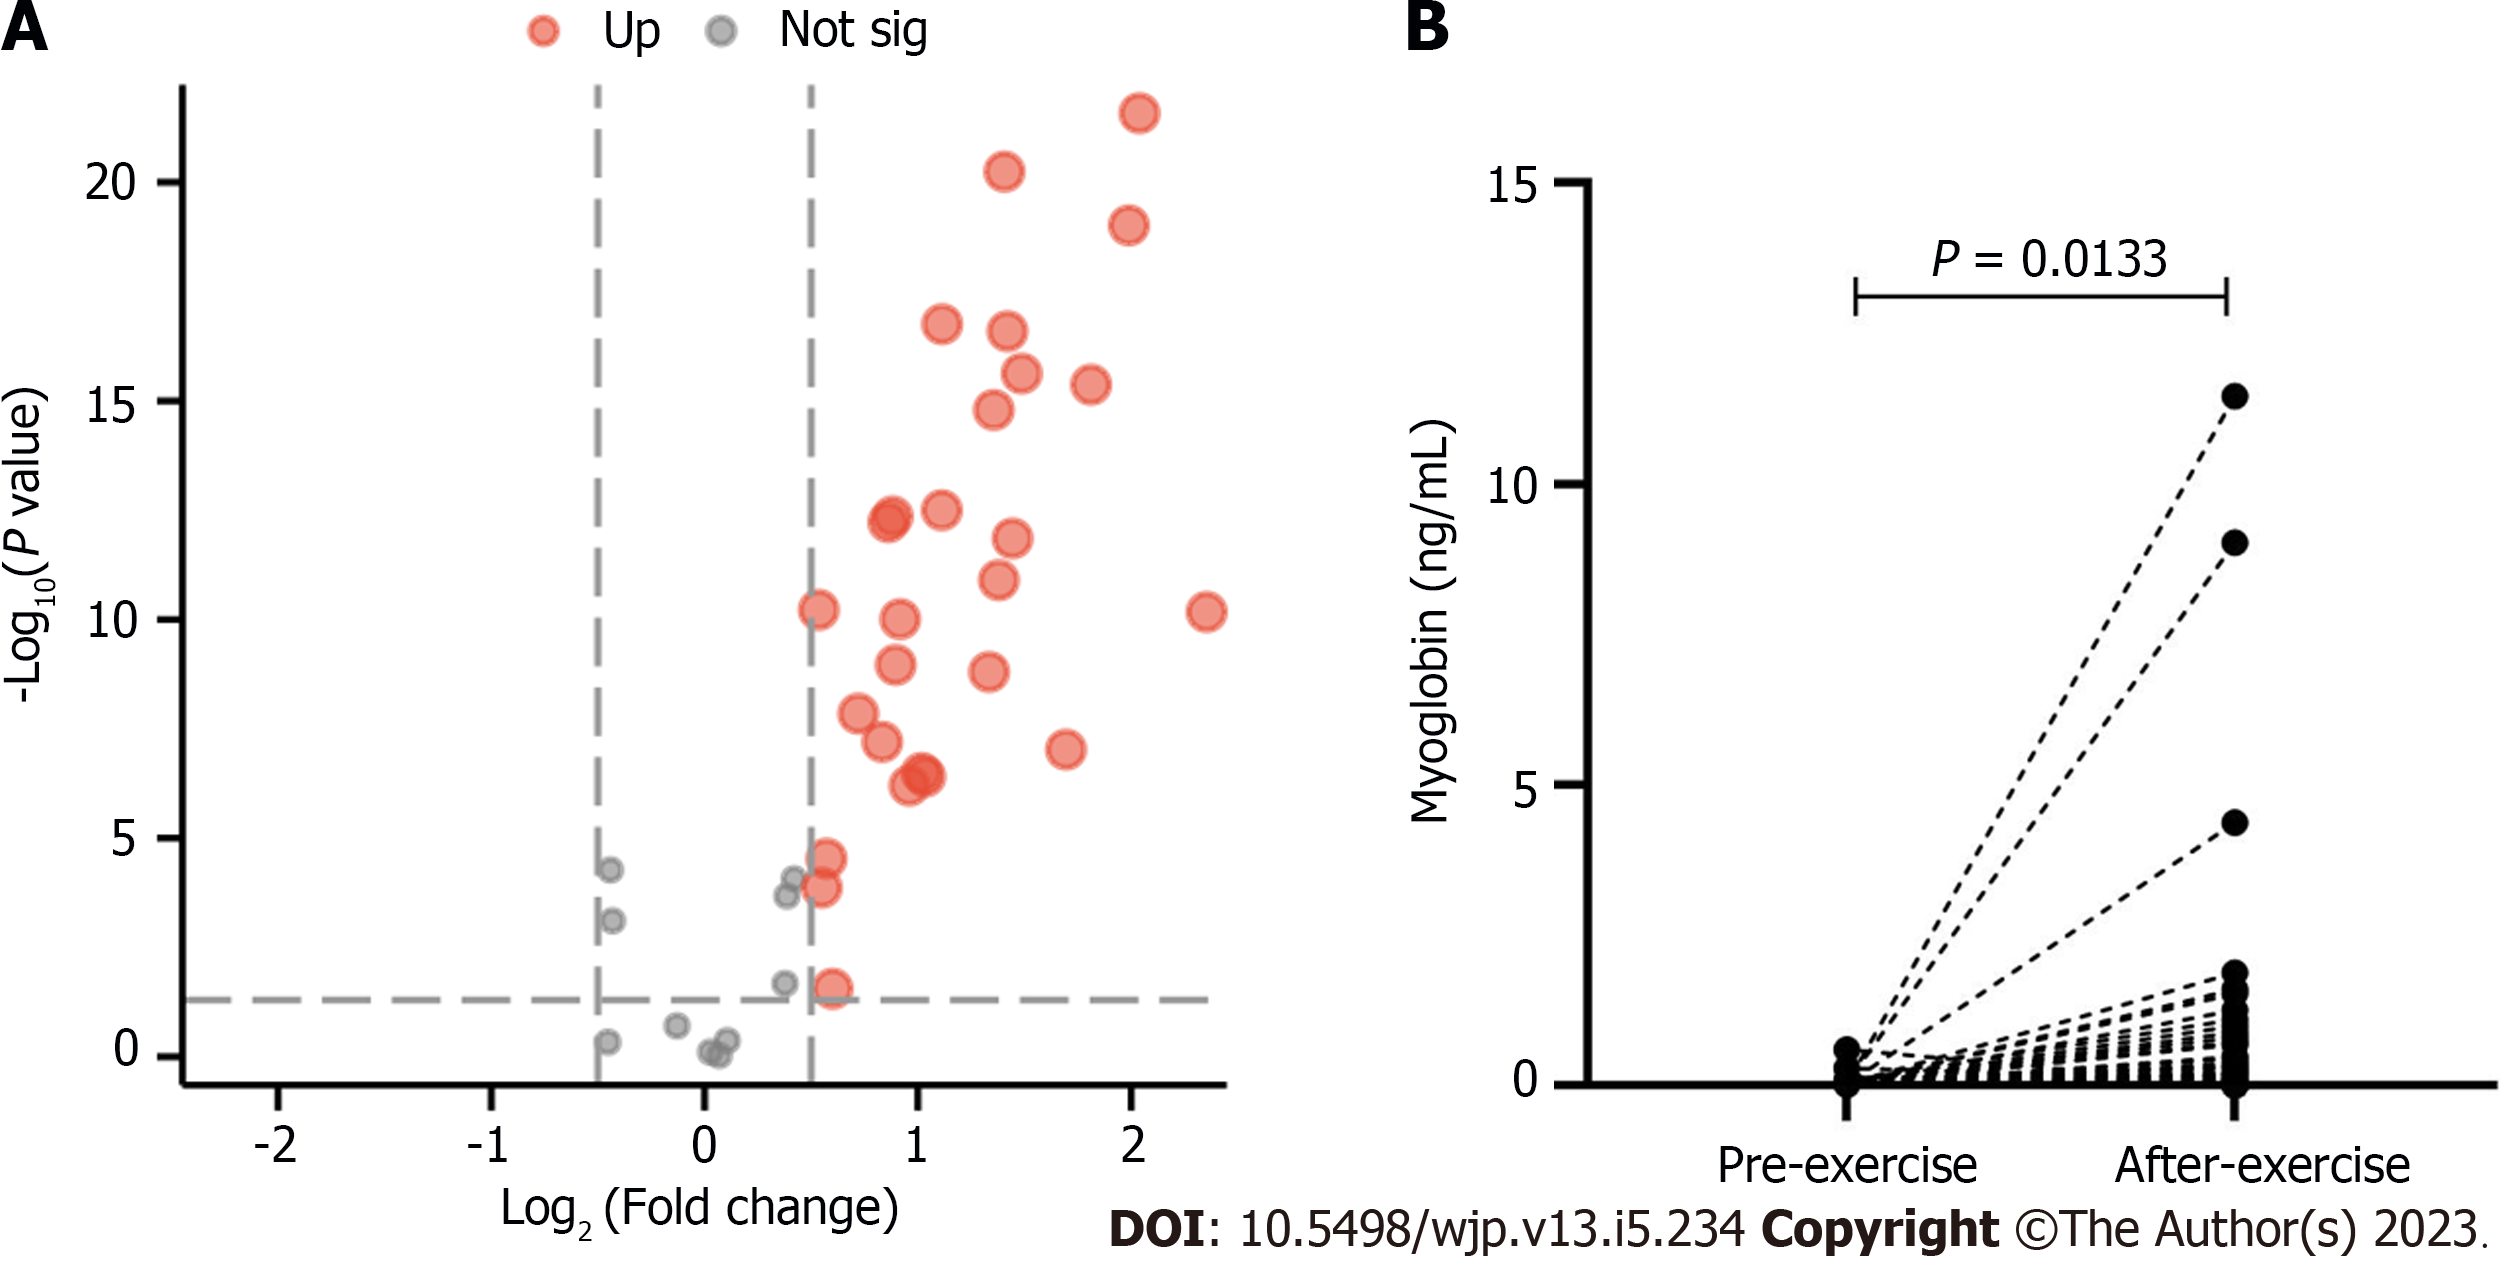
The volcano map of the results for organic acid metabolism before and after exercise is shown in Figure 1. Log2 (fold change) was set as the abscissa and -Log10 (P value) was set as the ordinate. The results showed that the levels of oxalic acid, pyruvic acid, 3-OH-butyric acid, 2-OH-isovaleric acid, 2-methyl-3-OH-butyric acid, benzoic acid, maleic acid, glyceric acid, fumaric acid, 3-methylglutaric acid, 3-methylglutaconic acid, glutaconic acid, decanoic acid, malic acid, adipic acid, creatinine, 2-OH-glutaric acid, pimelic acid, 2-ketoglutaric acid, phenylpyruvic acid, aconitic acid, vanillic acid, homovanillic acid, azelaic acid, citric acid, sebacic acid and palmitic acid were significantly increased after exercise. The myoglobin level was also increased after exercise (P = 0.0133).
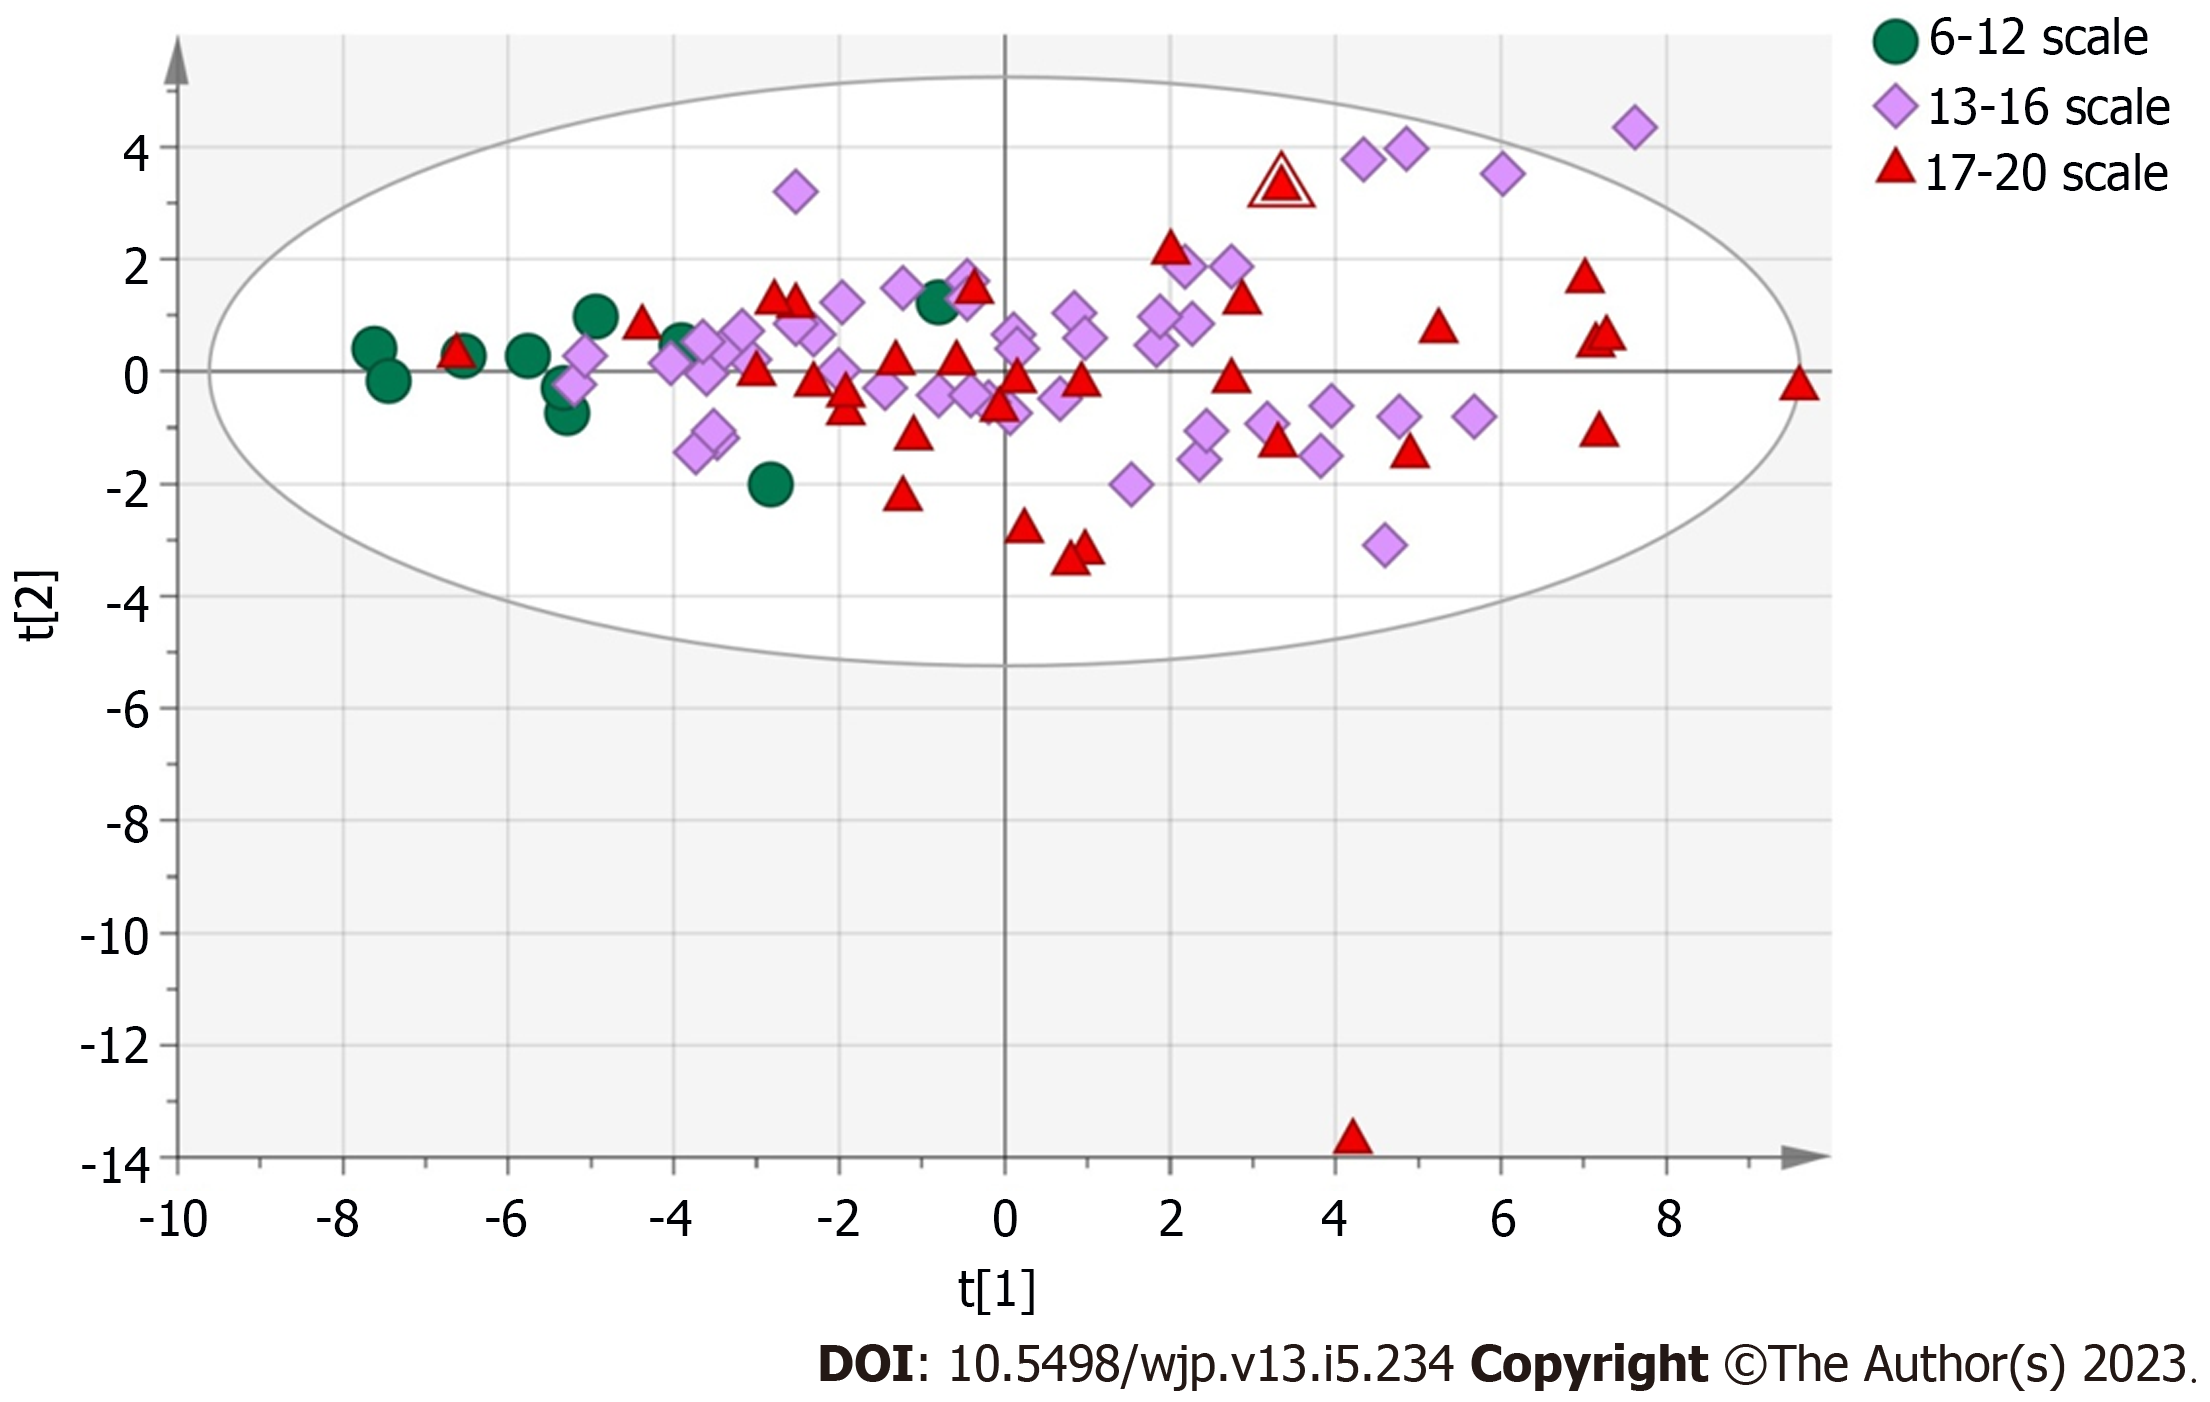
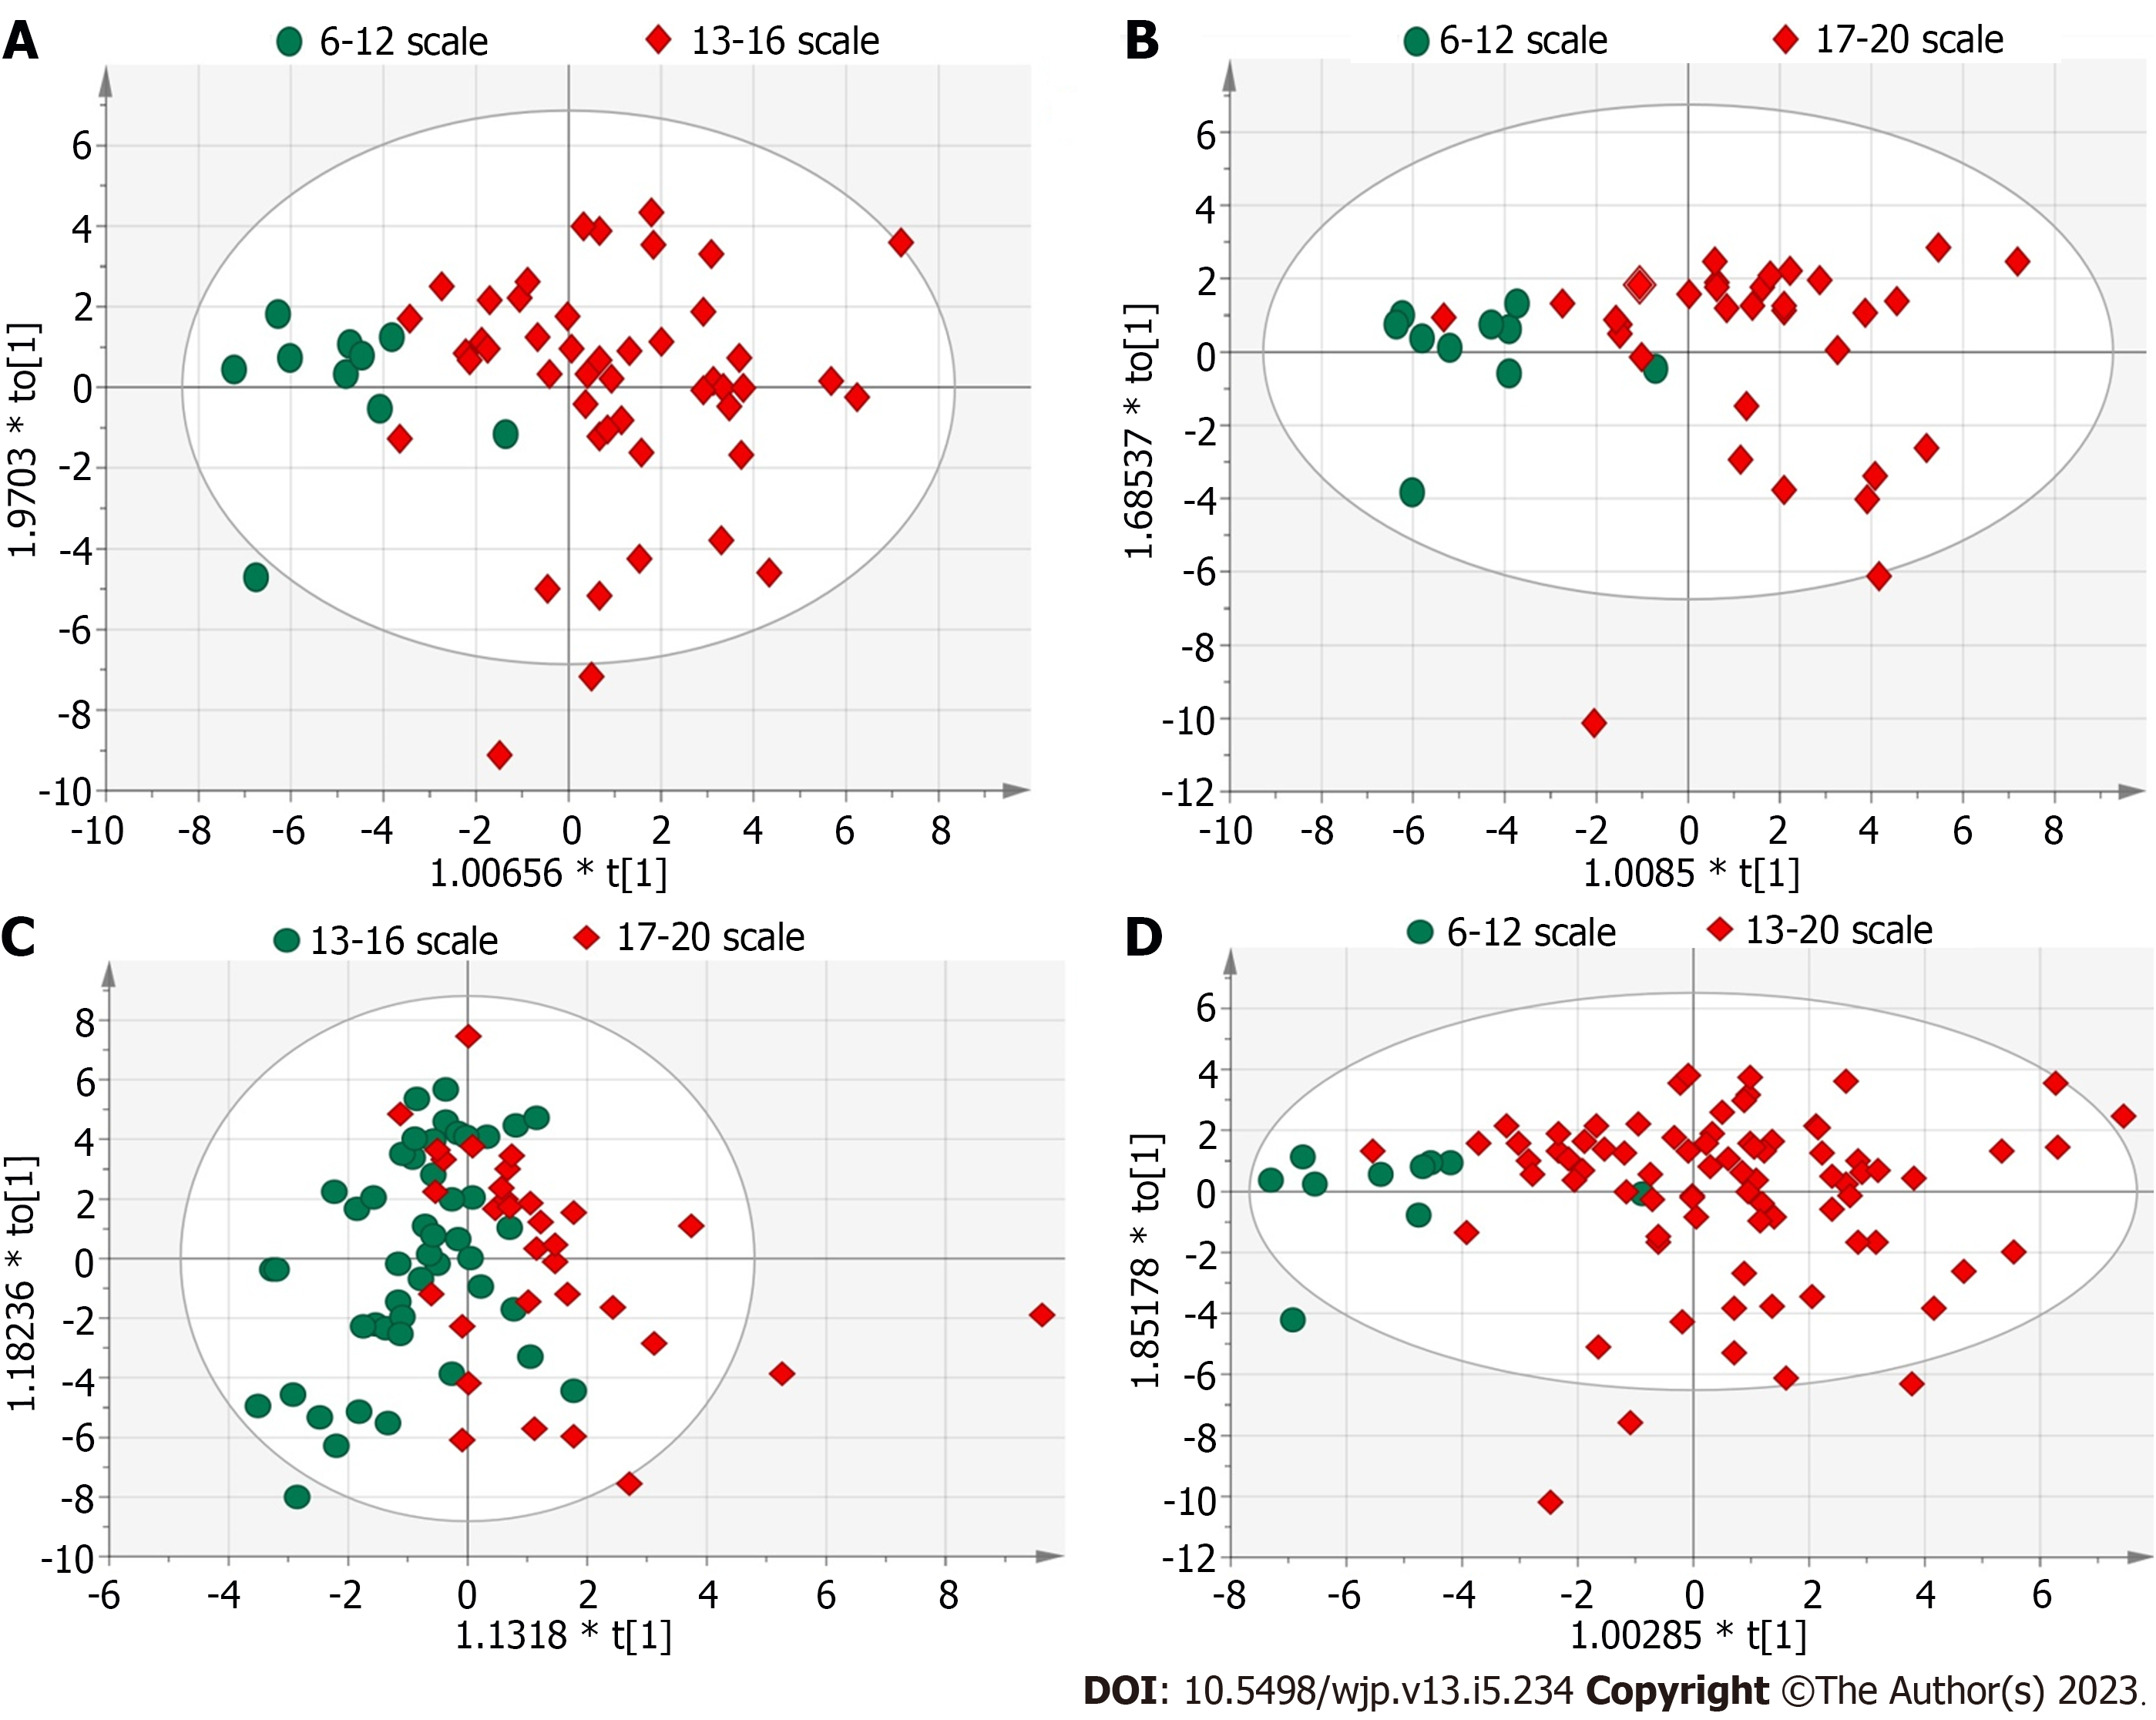
Figure 2 shows the PCA and OPLS-DA scores of the BRPE scale and urine organic acid levels. An unsupervised PCA was performed as the statistical analysis to evaluate the difference in organic acid metabolites among the groups with scores of 6-12, 13-16 and 17-20. PCA results showed no significant separation among the three groups. The supervised OPLS-DA model was subsequently used for analysis, and the results showed a clear separation between the groups with scores of 6-12 and 13-16 (Figure 3A) and between the groups with scores of 6-12 and 17-20 (Figure 3B). The model parameters of Q2Y and R2Y for those two group separations were 0.315 and 0.452 and 0.299 and 0.527, respectively. Although the groups with scores of 12-15 and 16-20 could not be separated (Figure 3C), the model parameters of Q2Y and R2Y were 0.0777 and 0.312, respectively.
Since the distinction between the groups with scores of 13-16 and 17-20 was not obvious, groups with scores of 13-16 and 17-20 were combined into one group (score of 13-20) for analysis. The OPLS-DA results showed that the two groups were separated (Figure 3D), and the model parameters of Q2Y and R2Y were 0.236 and 0.368, respectively. The statistical results also showed significant differences in the levels of most of the organic acid indicators between the two groups (Table 2).
| Compound | 6-12 scale (n = 10), mean ± SD (range) | 13-20 scale (n = 79), mean ± SD (range) | t | P value | Freedom | Effect size |
| Lactic acid | 0.016 (0.013, 0.018), 0.008-0.038 | 0.028 ± 0.024 (0.010-0.150) | -2.933 | 0.006 | 32.954 | -0.295 |
| 2-OH-isobutyric acid | 0.003 ± 0.002 (0.001-0.006) | 0.005 ± 0.003 (0.002-0.026) | -2.371 | 0.028 | 19.844 | -0.279 |
| Glycolic acid | 0.246 ± 0.095 (0.098-0.393) | 0.347 ± 0.115 (0.111-0.617) | -3.086 | 0.009 | 87 | -0.431 |
| 2-OH-butyric acid | 0.001 ± 0.000 (0.000-0.002) | 0.002 ± 0.001 (0.001-0.008) | -5.425 | 0.000 | 26.692 | -0.517 |
| Glyoxylic acid | 0.005 (0.004, 0.007), 0.004-0.010 | 0.009 (0.007, 0.011), 0.004-0.023 | -4.554 | 0.000 | 14.629 | -0.540 |
| Oxalic acid | 0.006 ± 0.003 (0.003-0.011) | 0.008 ± 0.005 (0.000-0.031) | -1.382 | 0.182 | 20.192 | -0.166 |
| Pyruvic acid | 0.026 ± 0.007 (0.013-0.036) | 0.044 ± 0.021 (0.017-0.149) | -5.621 | 0.000 | 35.797 | -0.503 |
| 3-OH-butyric acid | 0.092 ± 0.035 (0.053-0.173) | 0.219 ± 0.148 (0.054-1.025) | -2.689 | 0.009 | 87 | -0.508 |
| 2-OH-isovaleric acid | 0.007 ± 0.003 (0.004-0.013) | 0.014 ± 0.009 (0.003-0.073) | -5.280 | 0.000 | 41.164 | -0.468 |
| 2-methyl-3-OH-butyric acid | 0.002 (0.002, 0.003), 0.001-0.015 | 0.004 (0.003, 0.006), 0.001-0.012 | -3.159 | 0.002 | 87 | -0.548 |
| 2-keto-isovaleric acid | 0.001 ± 0.000 (0.000-0.001) | 0.001 ± 0.001 (0.000-0.004) | -3.589 | 0.001 | 87 | -0.614 |
| Benzoic acid | 0.001 (0.001, 0.001), 0.001-0.015 | 0.003 ± 0.002 (0.001-0.013) | -2.77 | 0.787 | 9.575 | -0.056 |
| 2-keto-3-methylvaleric acid | 0.001 ± 0.000 (0.000-0.001) | 0.001 ± 0.001 (0.000-0.006) | -2.869 | 0.005 | 87 | -0.535 |
| Maleic acid | 0.001 ± 0.000 (0.000-0.001) | 0.001 ± 0.001 (0.000-0.003) | -4.047 | 0.001 | 16.432 | -0.474 |
| Succinic acid | 0.007 ± 0.005 (0.002-0.019) | 0.018 (0.013, 0.022), 0.005-0.032 | -4.814 | 0.000 | 87 | -0.673 |
| Glyceric acid | 0.003 ± 0.002 (0.001-0.006) | 0.004 (0.003, 0.007), 0.002-0.014 | -3.959 | 0.001 | 16.204 | -0.468 |
| Fumaric acid | 0.019 ± 0.010 (0.004-0.042) | 0.050 ± 0.030 (0.012-0.183) | -3.261 | 0.002 | 87 | -0.573 |
| Glutaric acid | 0.002 ± 0.001 (0.000-0.004) | 0.006 (0.004, 0.010), 0.002-0.018 | -4.359 | 0.000 | 87 | -0.684 |
| 3-methylglutaric acid | 0.003 ± 0.003 (0.001-0.010) | 0.006 (0.004, 0.009), 0.001-0.020 | -3.262 | 0.006 | 13.322 | -0.438 |
| 3-methylglutaconic acid | 0.006 ± 0.004 (0.002-0.013) | 0.016 ± 0.008 (0.004-0.043) | -6.149 | 0.000 | 19.746 | -0.603 |
| Glutaconic acid | 0.006 ± 0.004 (0.001-0.014) | 0.016 ± 0.011 (0.001-0.052) | -2.857 | 0.005 | 87 | -0.516 |
| Decanoic acid | 0.000 (0.000, 0.001), 0.000-0.001 | 0.001 (0.001, 0.001), 0.000-0.004 | -2.754 | 0.007 | 87 | -0.486 |
| Malic acid | 0.002 (0.002, 0.004), 0.001-0.010 | 0.009 ± 0.008 (0.001-0.057) | -4.364 | 0.000 | 29.065 | -0.429 |
| Adipic acid | 0.006 ± 0.007 (0.001-0.024) | 0.019 ± 0.021 (0.003-0.123) | -3.932 | 0.000 | 35.442 | -0.378 |
| Creatinine | 2.717 ± 3.056 (0.279-10.426) | 5.955 ± 3.663 (0.012-13.452) | -3.157 | 0.008 | 12.488 | -0.433 |
| Mandelic acid | 0.002 ± 0.002 (0.001-0.003) | 0.003 ± 0.001 (0.001-0.007) | -5.460 | 0.000 | 15.516 | -0.598 |
| 2-OH-glutaric acid | 0.006 ± 0.003 (0.002-0.013) | 0.017 ± 0.009 (0.000-0.044) | -3.867 | 0.000 | 87 | -0.634 |
| Pimelic acid | 0.002 ± 0.001 (0.000-0.004) | 0.005 ± 0.003 (0.000-0.014) | -3.978 | 0.000 | 87 | -0.645 |
| 2-keto-glutaric acid | 0.002 ± 0.003 (0.000-0.009) | 0.020 ± 0.013 (0.000-0.087) | -4.268 | 0.000 | 87 | -0.684 |
| Phenylpyruvic acid | 0.013 ± 0.008 (0.005-0.032) | 0.034 (0.023, 0.043), 0.005-0.136 | -7.031 | 0.000 | 31.925 | -0.599 |
| Aconitic acid | 0.002 (0.001, 0.012), 0.000-0.028 | 0.053 ± 0.041 (0.001-0.174) | -8.287 | 0.000 | 64.322 | -0.605 |
| Vanillic acid | 0.023 ± 0.025 (0.001-0.075) | 0.035 (0.016, 0.080), 0.000-0.357 | -3.146 | 0.004 | 27.007 | -0.330 |
| Homovanillic acid | 0.011 (0.007, 0.017), 0.004-0.060 | 0.044 ± 0.022 (0.009-0.129) | -4.900 | 0.000 | 13.464 | -0.588 |
| Azelaic acid | 0.008 ± 0.007 (0.000-0.022) | 0.017 ± 0.012 (0.002-0.084) | -3.418 | 0.003 | 16.749 | -0.410 |
| Citric acid | 0.001 ± 0.001 (0.000-0.003) | 0.005 ± 0.005 (0.000-0.030) | -2.517 | 0.014 | 87 | -0.487 |
| Sebacic acid | 0.078 (0.042, 0.168), 0.023-0.481 | 0.252 ± 0.183 (0.034-1.039) | -2.135 | 0.053 | 12.500 | -0.316 |
| Palmitic acid | 0.025 ± 0.007 (0.014-0.033) | 0.040 ± 0.012 (0.024-0.095) | -6.076 | 0.000 | 16.511 | -0.627 |
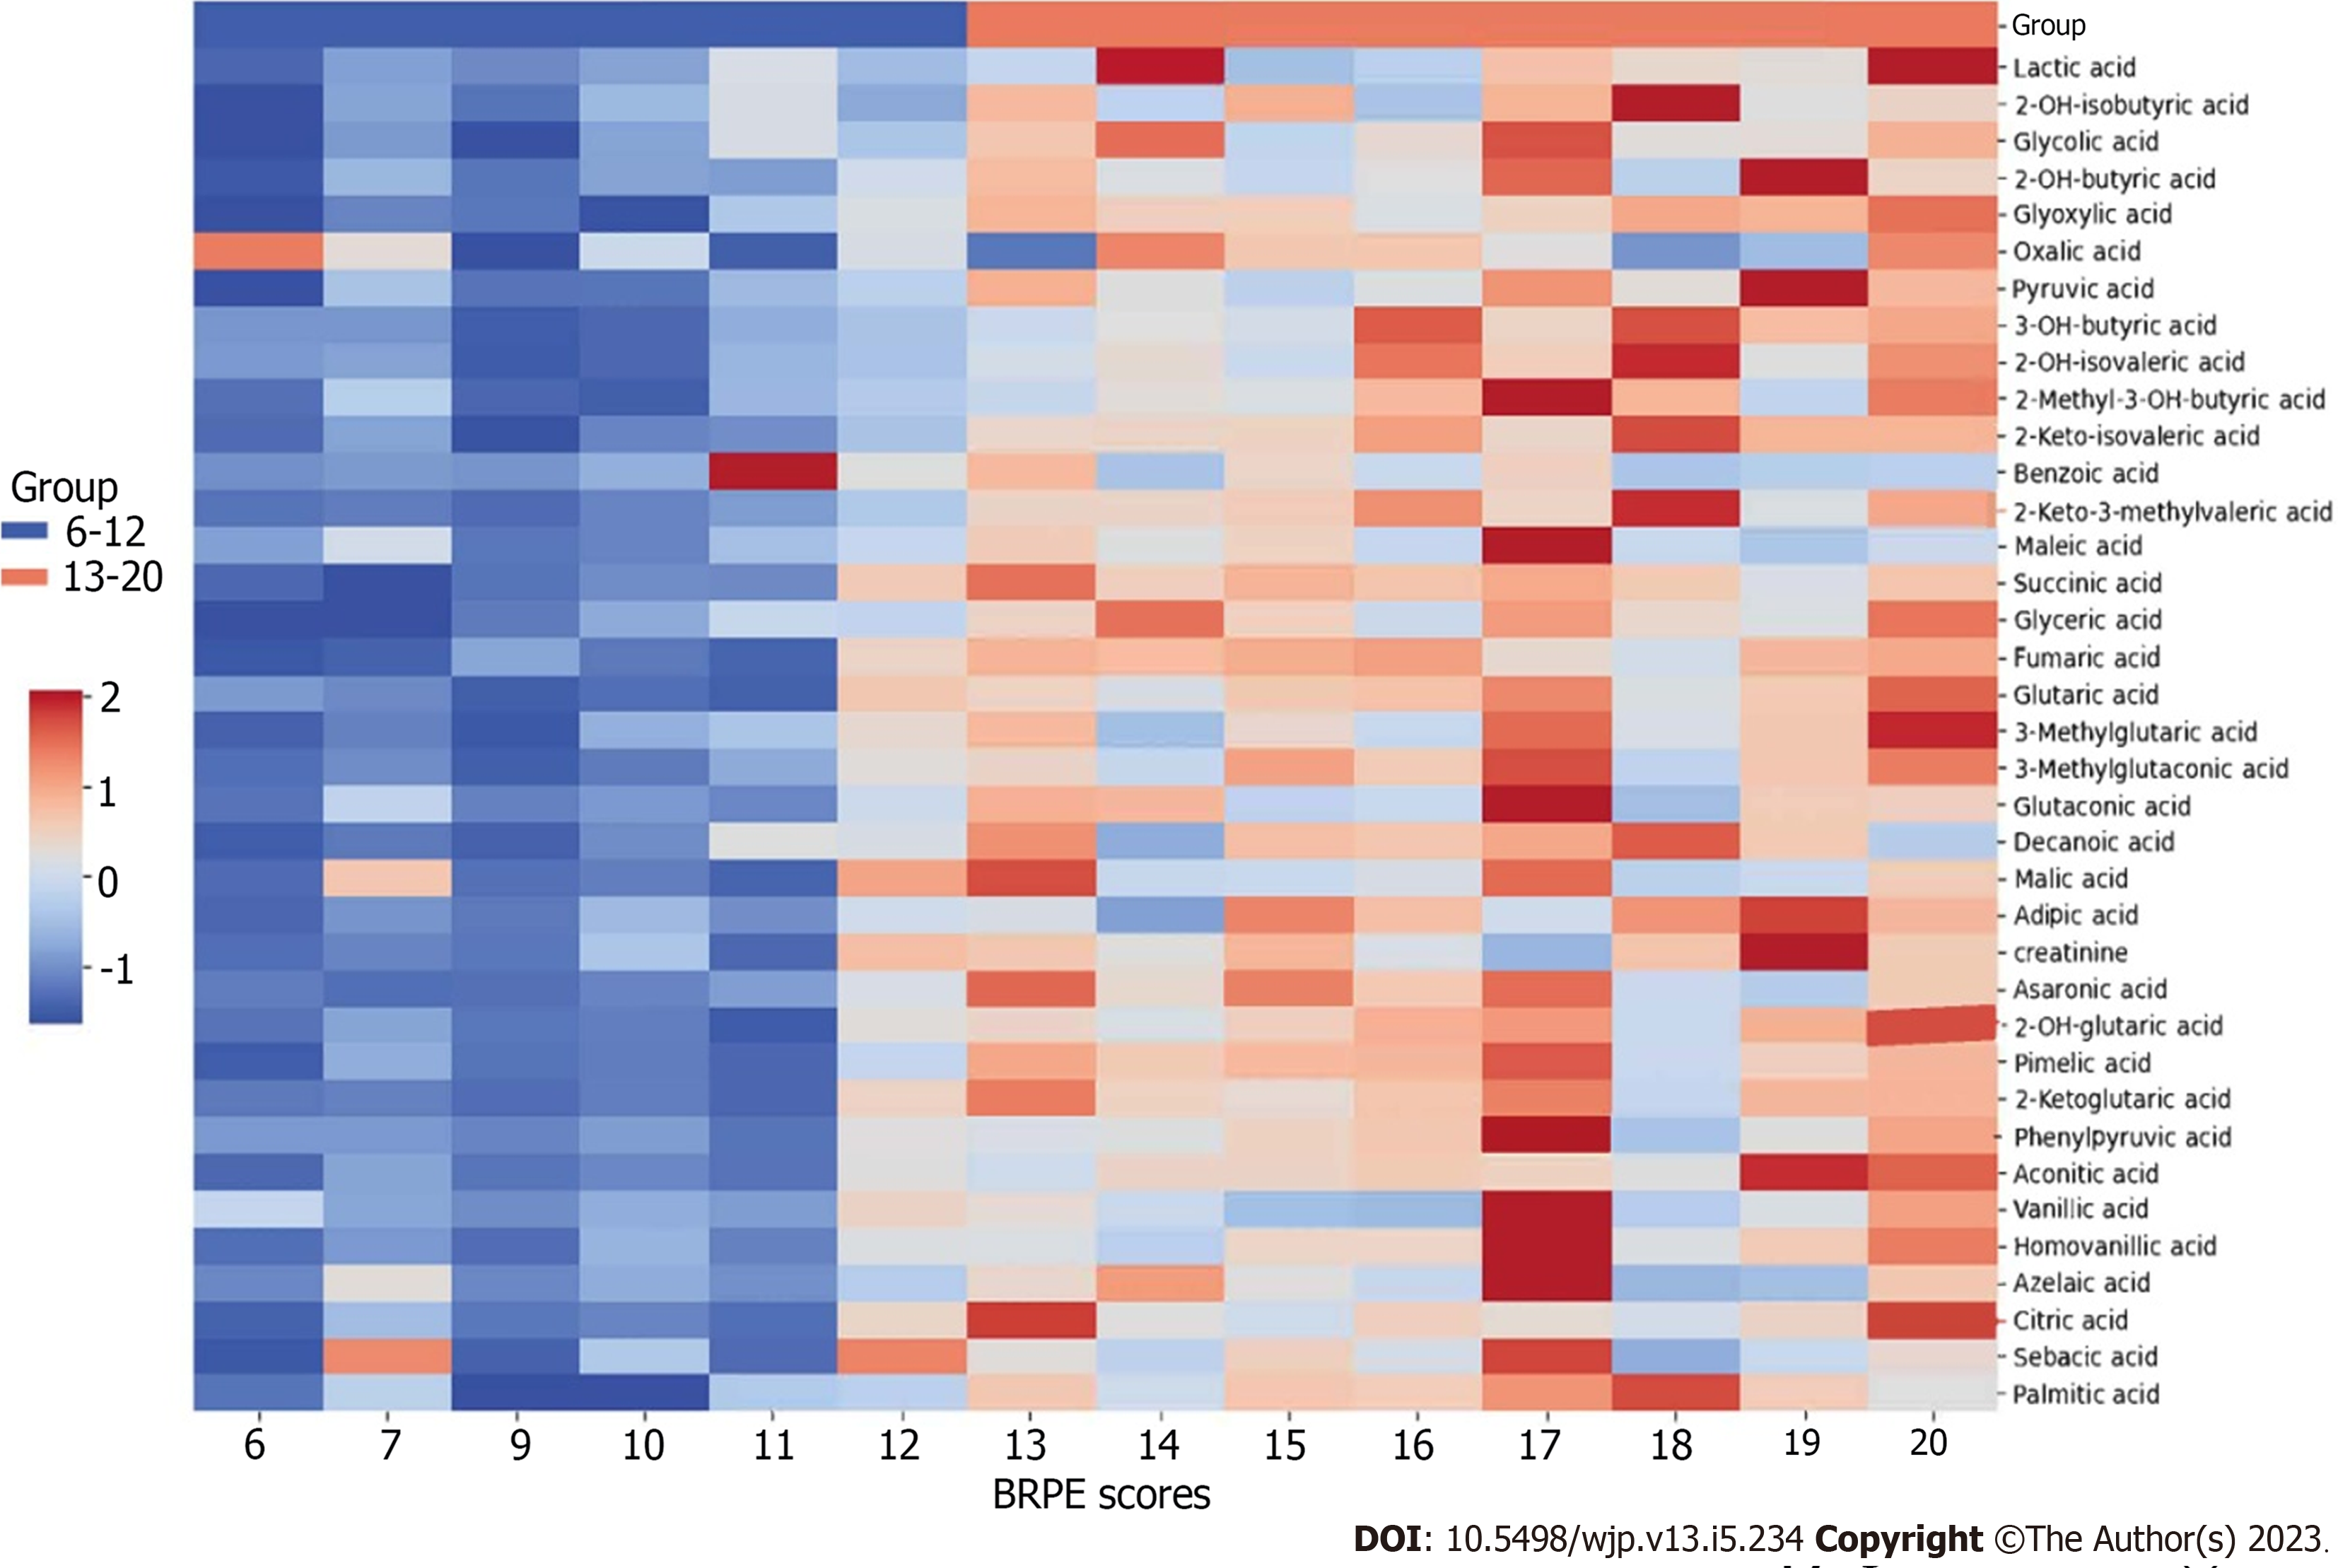
The heatmap cluster analysis (Figure 4) revealed the metabolic profiles of organic acids between the groups with scores of 6-12 (low BRPE score group) and 13-20 (high BRPE score group). The redder color represents a higher content. The urine contents of organic acids in the group with a score of 6-12 were generally low.
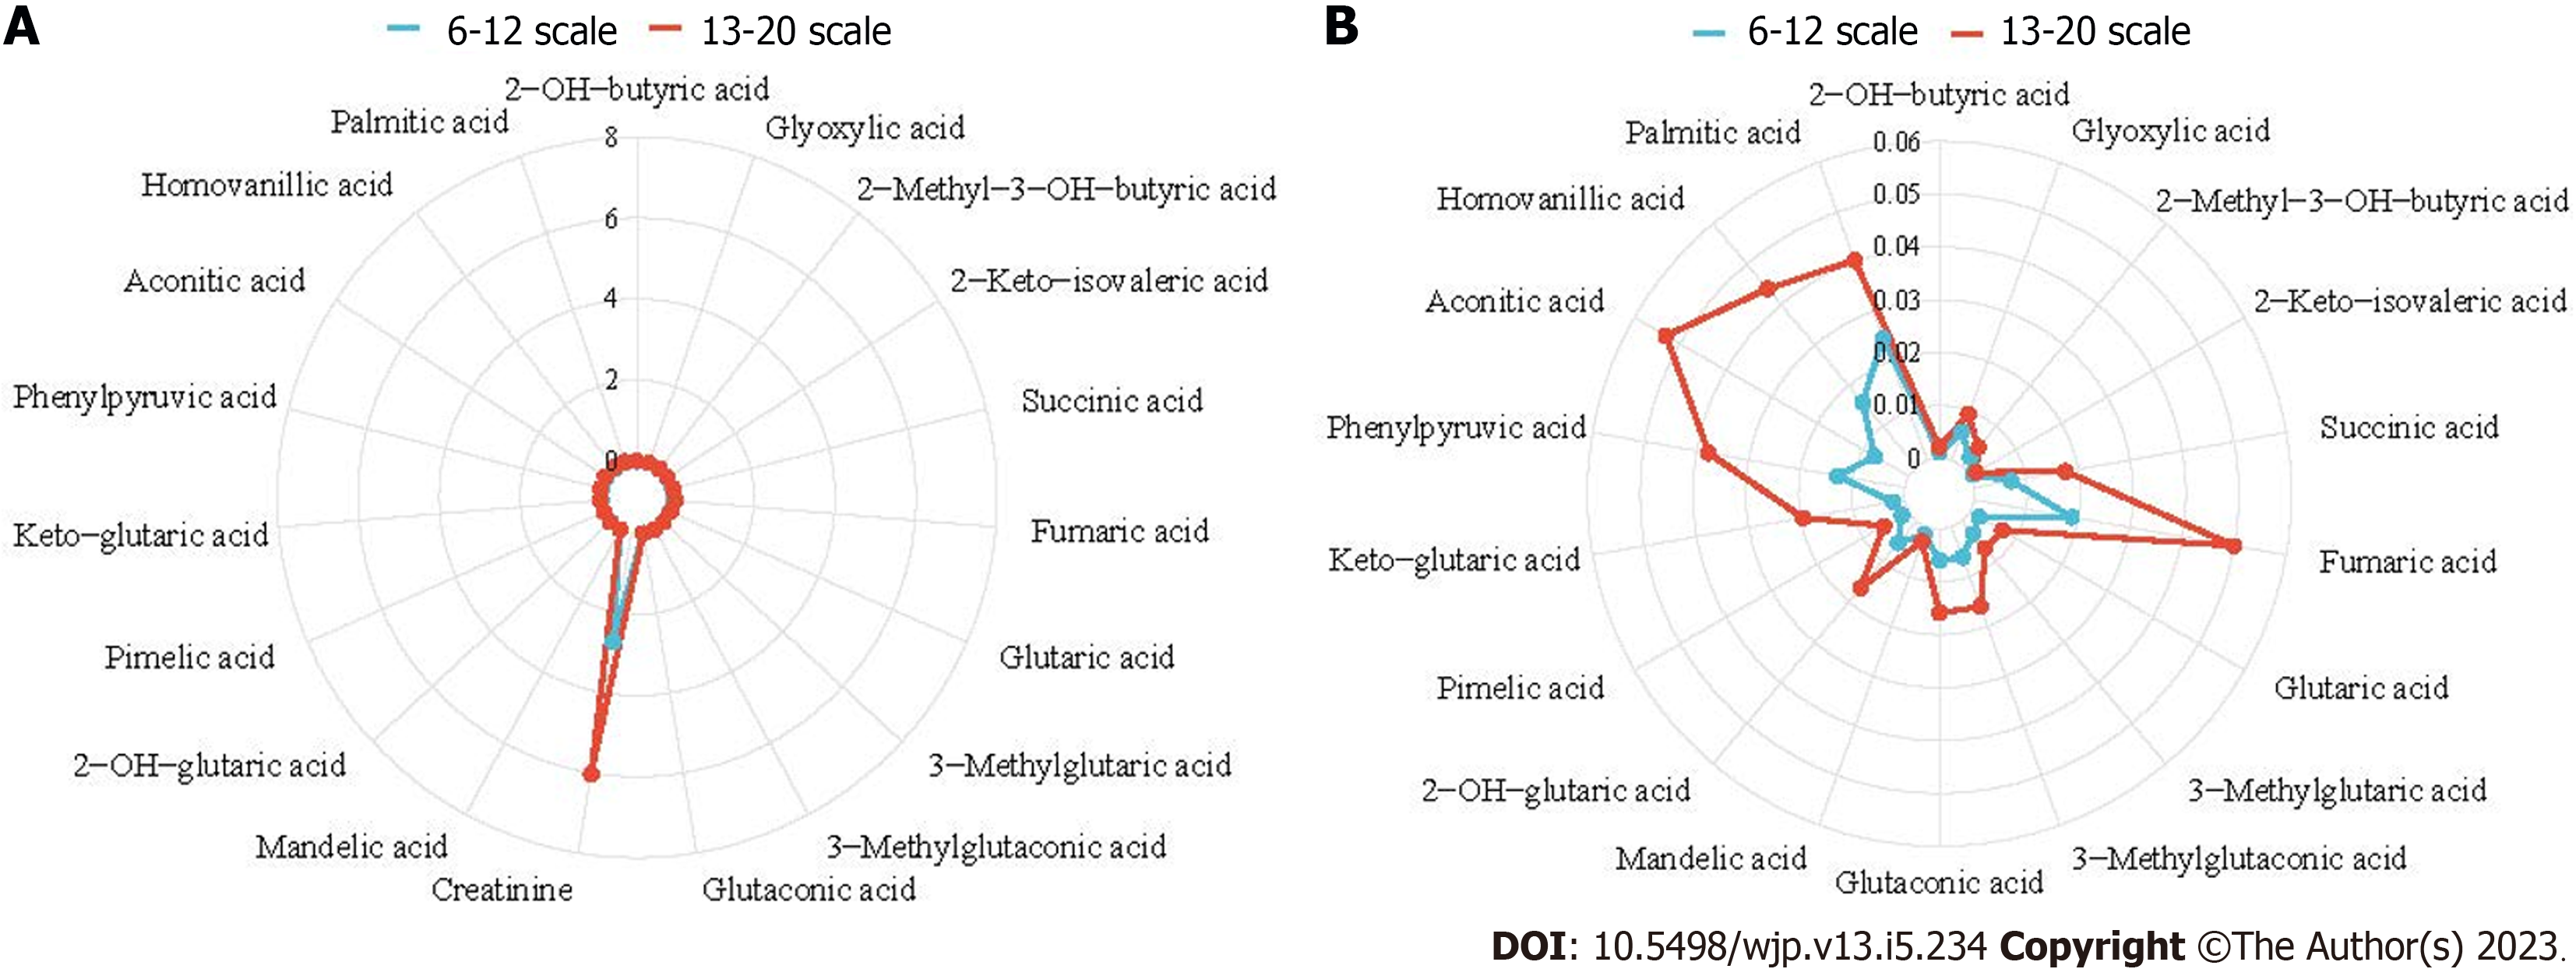
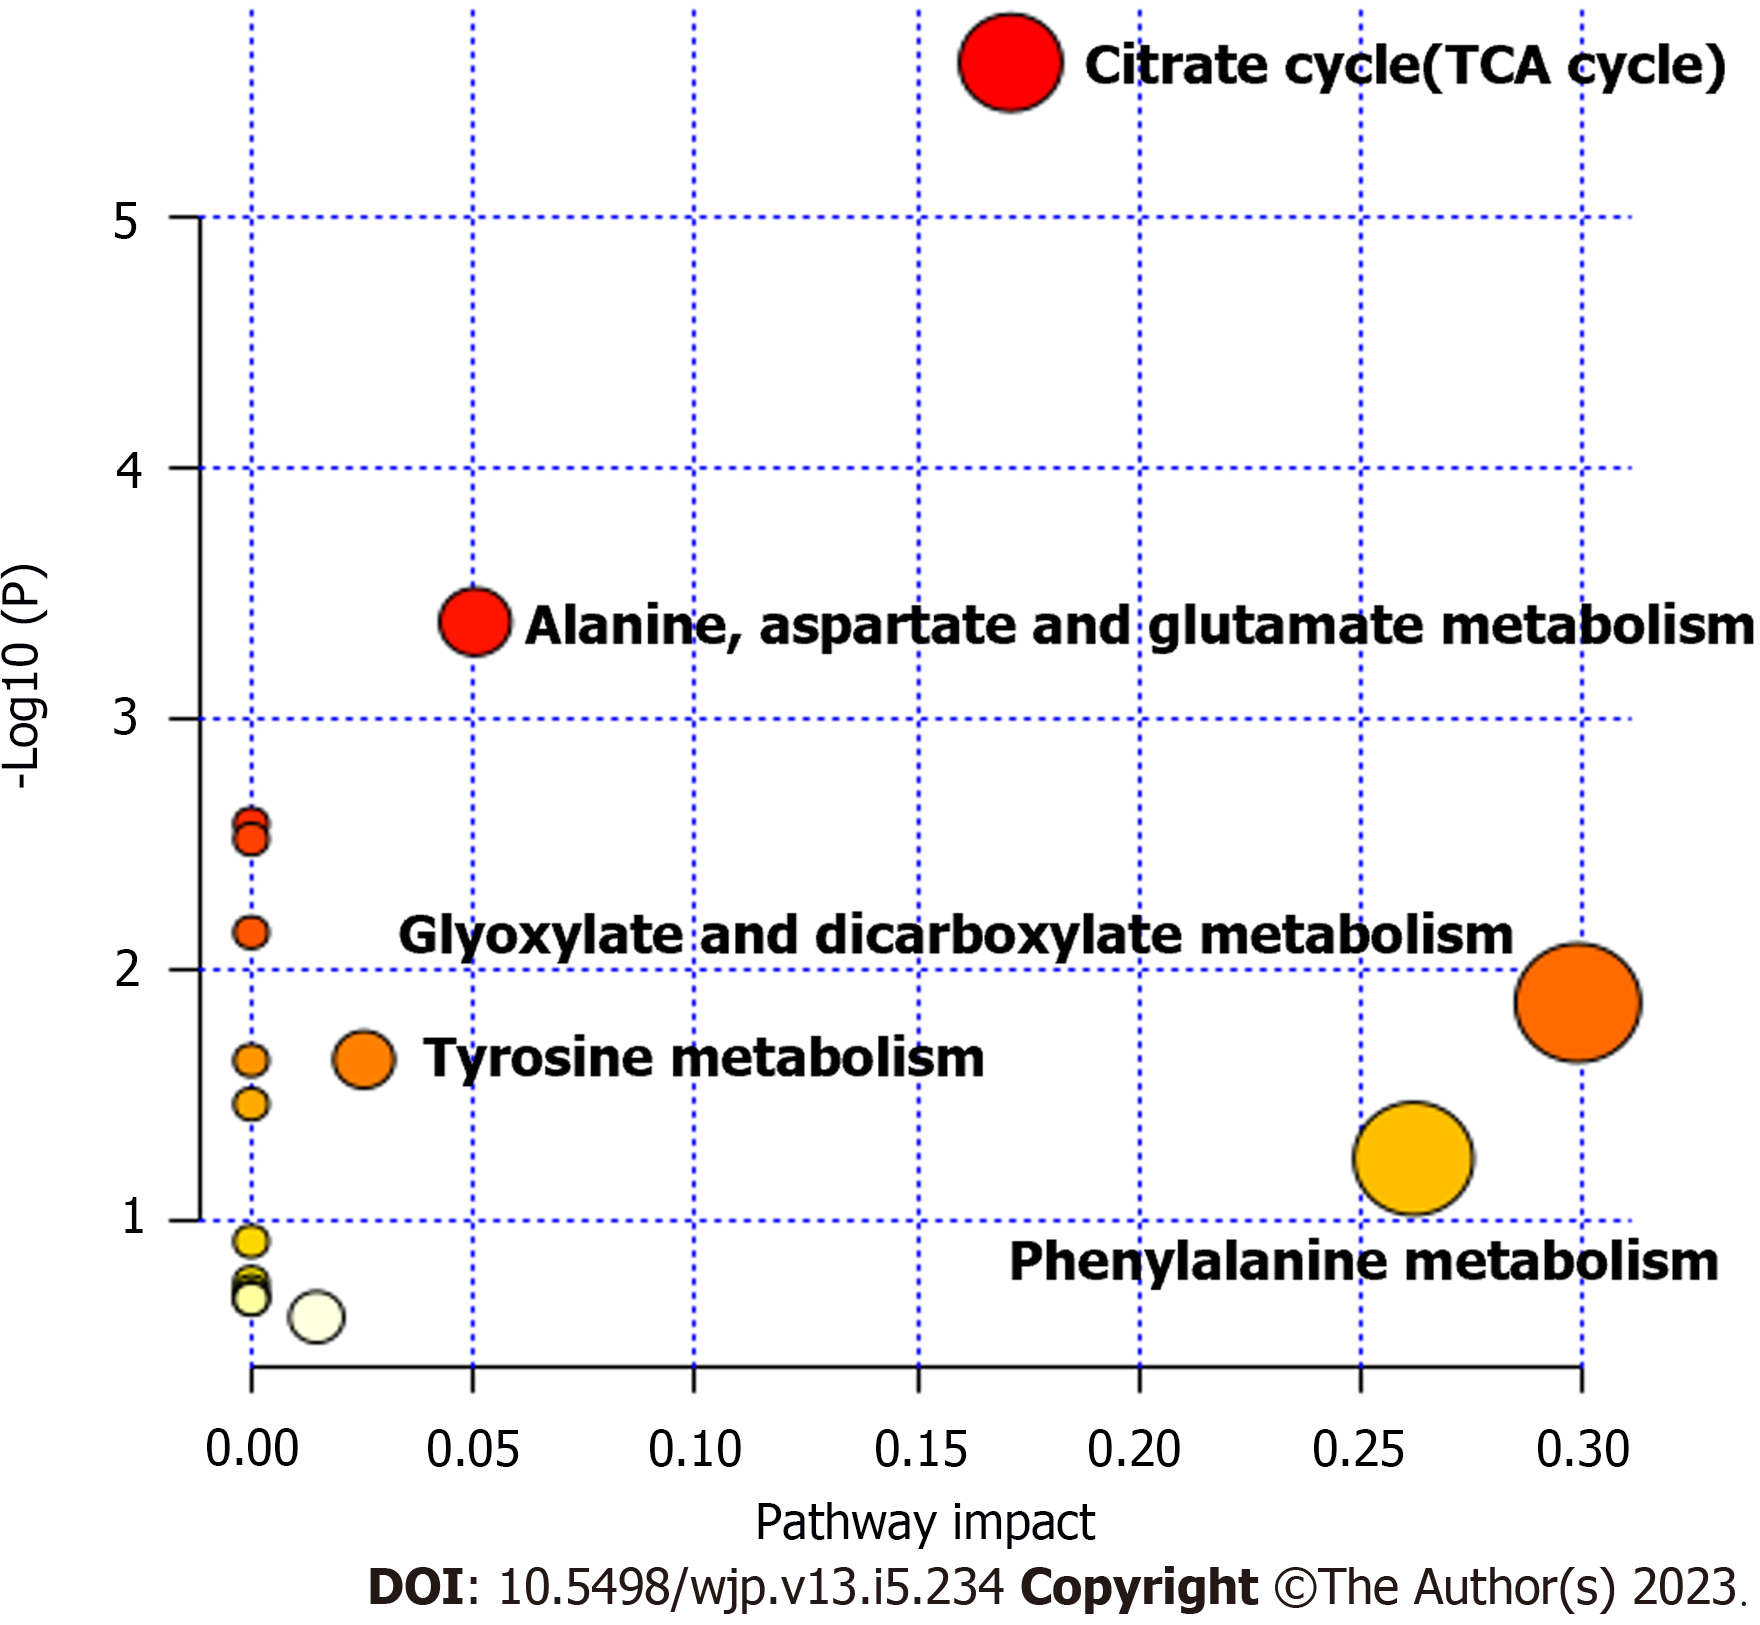
According to a fold change > 1.5, variable importance in the projection > 1 and P < 0.05 for organic acids, the differentially abundant compounds between the groups with scores of 6-12 and 13-20 were screened, and 19 differentially abundant compounds were identified (Table 3). A radar chart of these metabolites was then constructed based on the abundance of organic acids (Figure 5). Compared with the group with a score of 6-12, the organic acid levels in the group with a score of 13-20 were significantly increased. Because of the high order of magnitude for creatinine, which was significantly different from the other organic acids, the creatinine index was removed, and a radar chart without creatinine was constructed, as shown in Figure 5B. Figure 6 shows the metabolic pathways of the differentially abundant metabolites, and the results revealed significant differences in the metabolic pathways of the citrate cycle [tricarboxylic acid (TCA) cycle] and alanine, aspartate and glucose metabolism.
| Compound | KEGG ID | VIP | Fold change | P value |
| Succinic acid | C00042 | 1.38 | 2.45 | 0.000 |
| Homovanillic acid | C05582 | 1.29 | 2.76 | 0.000 |
| Glutaric acid | C00489 | 1.27 | 3.52 | 0.000 |
| Palmitic acid | C00249 | 1.25 | 1.64 | 0.000 |
| 3-methylglutaconic acid | - | 1.21 | 2.64 | 0.000 |
| Pimelic acid | C02656 | 1.19 | 3.54 | 0.000 |
| 2-keto-glutaric acid | C00026 | 1.19 | 8.52 | 0.000 |
| 2-OH-glutaric acid | - | 1.18 | 3.00 | 0.000 |
| Mandelic acid | C01984 | 1.16 | 1.91 | 0.000 |
| Glyoxylic acid | C00048 | 1.15 | 1.63 | 0.000 |
| 3-methylglutaric acid | - | 1.11 | 2.08 | 0.006 |
| 2-keto-isovaleric acid | - | 1.09 | 2.01 | 0.001 |
| Aconitic acid | C00417 | 1.08 | 7.11 | 0.000 |
| Phenylpyruvic acid | C00166 | 1.08 | 2.92 | 0.000 |
| Glutaconic acid | C02214 | 1.05 | 2.64 | 0.005 |
| 2-methyl-3-OH-butyric acid | - | 1.04 | 2.00 | 0.002 |
| 2-OH-butyric acid | C05984 | 1.04 | 1.89 | 0.000 |
| Fumaric acid | C00122 | 1.01 | 2.66 | 0.002 |
| Creatinine | C00791 | 1.00 | 2.22 | 0.008 |
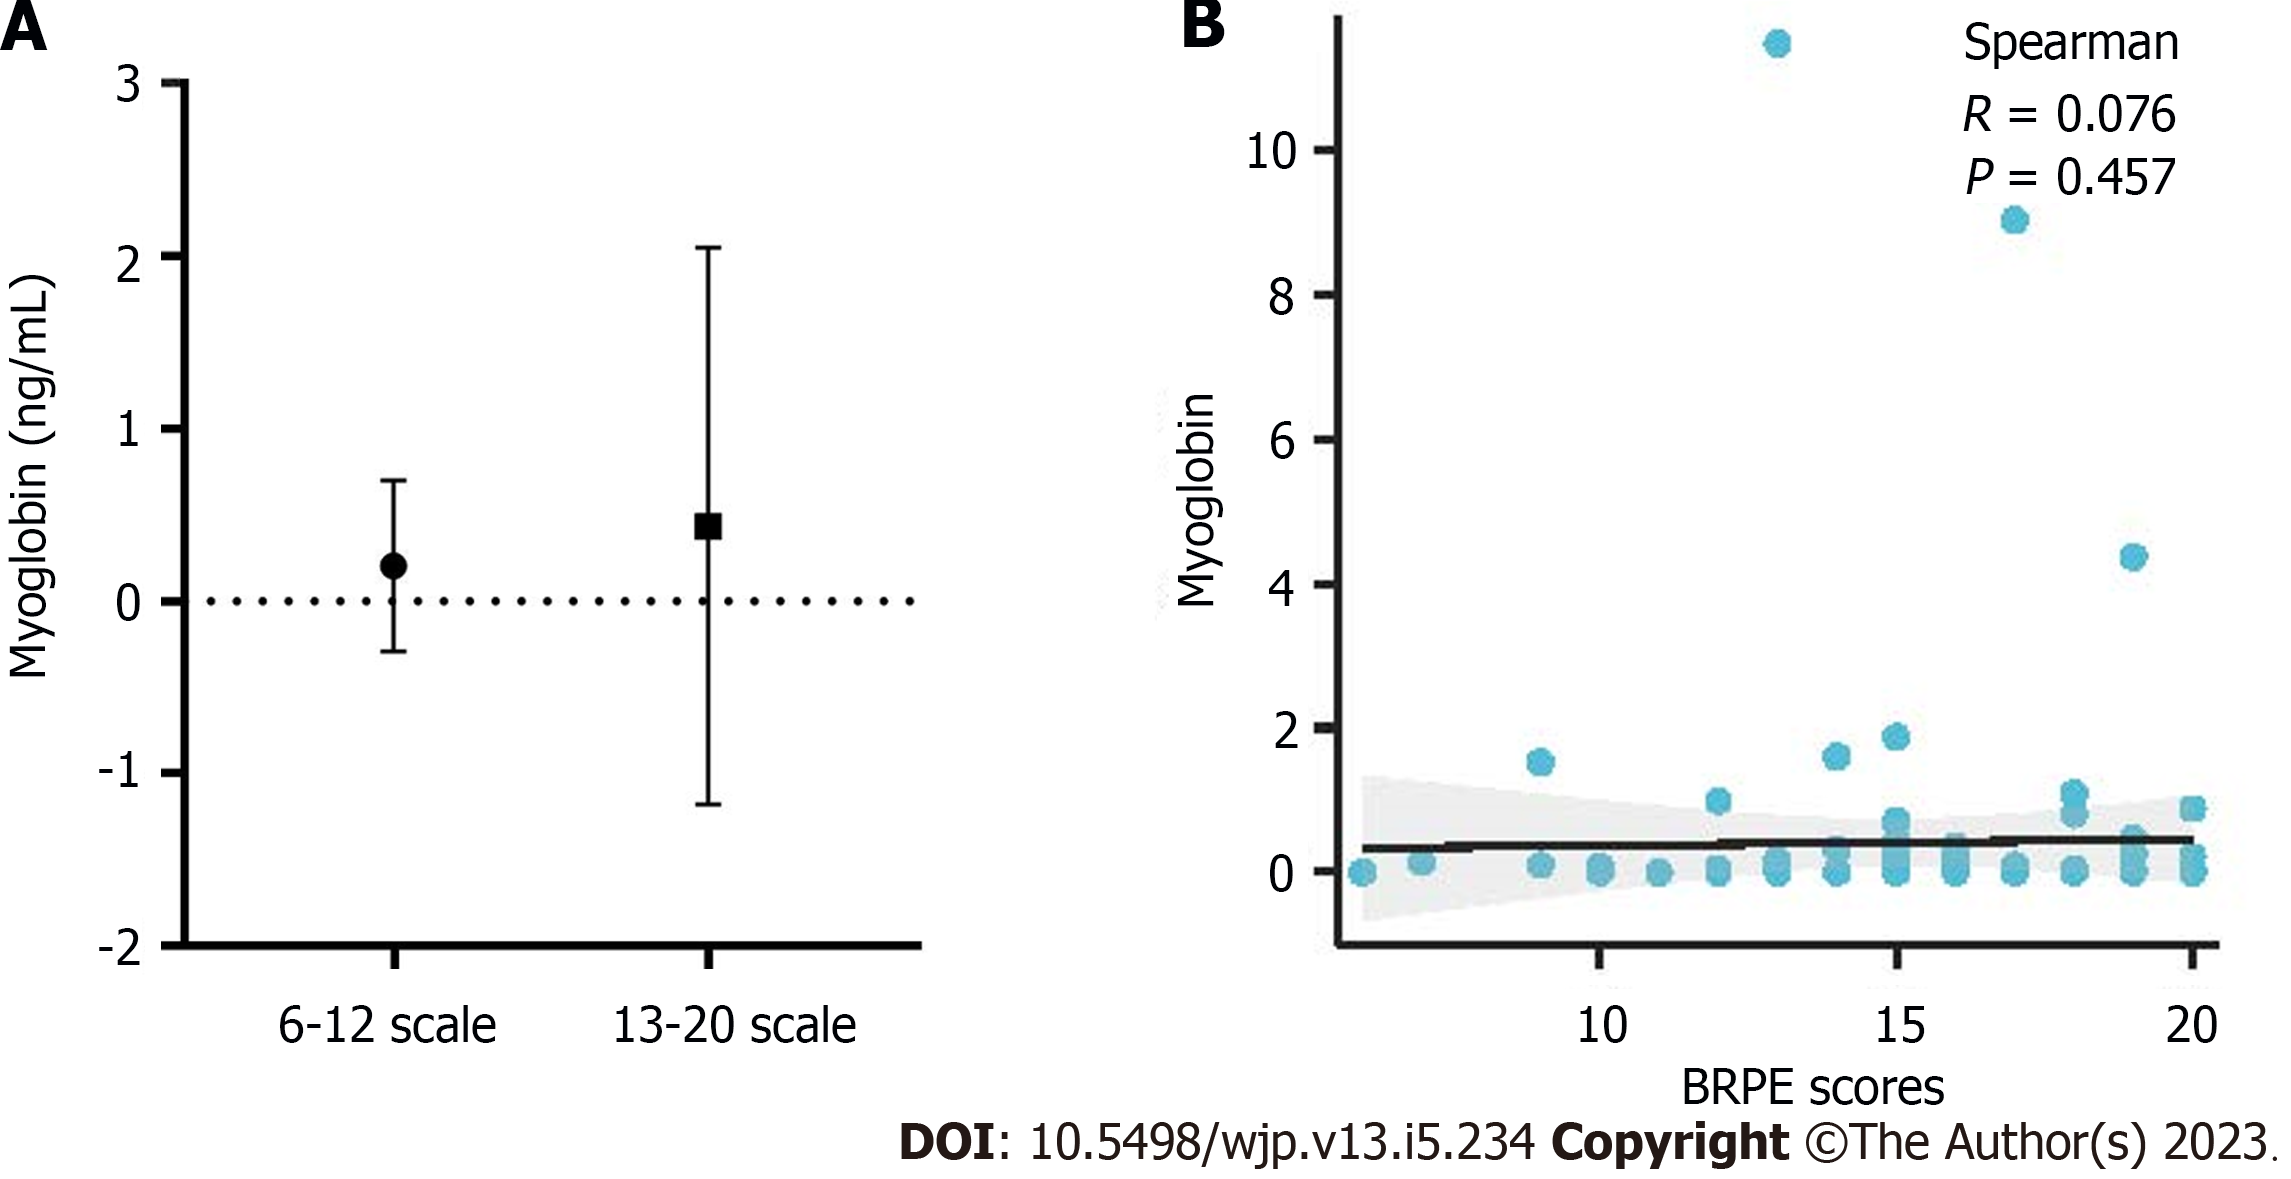
The statistical results for the myoglobin levels among the groups with BRPE scores of 6-12 and 13-20 are shown in Figure 7A. No significant differences were observed between the groups with scores of 6-12 and 13-20. The results of Spearman’s analysis of the Borg scale showed no significant correlation between the Borg scale and myoglobin level (Figure 7B).
In this study, 89 healthy young men were enrolled in a 40 km (6 h) outdoor hiking training exercise. We compared urine organic acid and myoglobin levels before and after hiking and analyzed the underlying correlation between the BRPE score and urine organic acid levels.
The results showed that the levels of most of the organic acid metabolites increased after hiking. Organic acids are a class of carboxylic acids produced from amino acids, fats and carbohydrates in the metabolic process of the body, which directly participate in many biochemical reactions involved in life activities. They are also related to the metabolic activities and mutual transformation of sugar, fat and protein. Previous studies have shown an increased level of glycolysis products, such as TCA cycle intermediates, nucleotide products and branched-chain amino acids, which are usually related to energy metabolism, during endurance training[19-21].
Urine myoglobin levels were also detected before and after exercise. Myoglobin exists in cardiac muscle and skeletal muscle cells and has a close relationship with exercise-related fatigue and sports injury[22,23]. When exercise causes skeletal muscle injury, the content of myoglobin in blood or urine may consequently increase. Our results showed that urinary myoglobin levels increased after exercise but were within the normal range, indicating that exercise-related fatigue may have occurred after exercise, but we could not clearly determine what extent of fatigue occurred.
The BRPE scale is a simple method to quantify the degree of self-perceived exertion of the human body, particularly in fatigue evaluations[24,25]. We collected the BRPE scores of the trainees after exercise and divided them into groups with scores of 6-12, 13-16 and 17-20 according to self-perceived exertion measured using the BRPE scale. Only the supervised OPLS-DA model performed well in separating trends between groups. We observed that the 6-12 score group was significantly separated from the 13-16 and 17-20 score groups. However, the latter two groups were not separated because no obvious differences in metabolism were detected between the two groups. Therefore, we combined those two groups into a 13-20 score group. This result indicates that organic acid metabolism changed when “somewhat hard” was reported as a psychological perception of exercise. The heatmap of the BRPE score and organic acid metabolites directly showed that the contents of organic acids increased in the higher BRPE score group (13-20). These findings support the results of our study that individuals with higher BRPE values experienced more metabolic changes related to body fatigue. There is a need to individualize the recovery or training strategies in the same excises. Our study is the first to compare metabolomic responses controlled by the BRPE in hiking training. Our data indicate that for individuals undergoing the same training, the BRPE score may discriminate those with different stress ranges at a biochemistry level. This result is also consistent with previous research that the BRPE could show the relevance of individual recovery treatments and the sensitivity and predictability of metabolomics to prevent biochemical and physiological disturbances[26].
Then, we screened differentially abundant metabolites according to the multivariate and univariate statistical significance criteria. Nineteen differentially abundant metabolites identified between the groups with scores of 6-12 and 13-20 are shown in Table 3 and Figure 5. A subsequent pathway enrichment analysis showed that the TCA cycle and alanine, aspartate and glutamate metabolism were the main distinctive metabolomic characteristics in the 13-20 score group. The TCA cycle is the process supplying energy through aerobic metabolism in the body[27]. Aerobic metabolism has a long oxygen supply capacity and is an important pathway of energy metabolism[28]. Exercise-related fatigue after long and intense exercise is related to metabolic changes in TCA cycle[29]. High intensity training significantly increased the content of intermediates in the TCA cycle, Tsai et al[30] reported that succinic acid and fumaric acid were significantly elevated after exhaustion. In this study, we also observed higher levels of intermediate products of the TCA cycle in the higher BRPE scale group, which is consistent with previous studies mentioned above, suggesting fatigue occurrence in higher BRPE scale individuals. Interactions between the amino acid pool and the TCA cycle are suggested to play a central role in the energy metabolism of the exercising muscle[31]. These results were consistent with the current “wear out doctrine” and “blockage doctrine” for the mechanism of training-induced fatigue; namely, the consumption of a large amount of energy substances and accumulation of metabolites during physical exercise/training leads to a decrease in the functional capacity of tissues, muscles, and organs, ultimately resulting in fatigue[1].
In addition, there was no significant difference between groups with scores of 6-12 and 13-20, and no correlation between myoglobin levels and BPRE scores. This result explains why serious muscle injury does not occur in the body even if a participant feels very tired psychologically during the 40 km exercise. However, at this time, organic acid metabolism has changed significantly and precedes the occurrence of muscle injury.
There are still some limitations in this research. First, the number of people in the group with a score of 6-12 was slightly small, which may have affected the data to a certain degree. Second, the population in this study only included men, and the difference between men and women was not assessed. Third, there was an absence of more direct assessment indicators, such as heart rate, blood biomarkers and others, which might be correlated with metabolic data. Combining all of these data might further help to confirm the ability of higher and lower BRPE values to differentiate metabolic profiles.
In conclusion, our results showed that after long-distance hiking with weight bearing, individuals with high BRPE values have a significant higher disturbance in organic acid metabolism. The differentially abundant metabolites are concentrated in the energy metabolism pathway. The BRPE value is not correlated with urine myoglobin levels but was shown to be able to discriminate individuals with exercise-related fatigue as a convenient predictor.
The Borg’s rating of perceived exertion (BRPE) scale was widely used to access subjective perception of effort during exercise, but the relationship between BRPE scale and urinary organic acids metabolism has not been studied.
Our article mainly explored the relationship of urinary organic acids metabolism and the BRPE scale during exercise and reflected the psychological perception degree of effort from an objective physiological perspective.
In this work, we aimed to evaluate whether the BRPE scale could be used in the prescription of outdoor hiking with weight-bearing based on urinary organic acids metabolism, which provides an objective physiological data support for the application of BRPE scale in outdoor hiking training.
Eighty-nine healthy men participated in this project and underwent 40 km (6 h) training with 20 kg carriages. After the training, they truthfully filled in the BRPE scale and urinary organic acids were detected. We used multidimensional statistical analysis including principal component (PCA) analysis and orthogonal partial least-squares discrimination (OPLS-DA) analysis and heat map analysis to explore the differences in metabolic profiles of organic acids with different BRPE scale. At last, differential metabolites were screened and pathway analysis was performed.
There were significant statistical differences in urinary organic acids before and after exercise. According to the BRPE scale, individuals were divided into groups of 6-12 scale (easy), 13-16 scale (somewhat hard) and 17-20 scale (very hard). PCA results showed no separation trend among the three groups. Further analysis with OPLS-DA showed that, group of 6-12 scale and 13-16 scale, 6-12 scale and 17-20 scale could be separated obviously, and group of 13-16 scale and 17-20 scale could not be separated, so group of 13-16 scale and 17-20 scale were combined into group 13-20 scale. OPLS-DA results showed that group 6-12 scale and 13-20 scale could be separated. Heat map results also showed significant metabolic differences between group of 6-12 scale and 13-20 scale. According to the standard of a variable importance in the projection > 1, fold change > 1.5 and P < 0.05, 19 different metabolites were screened, which mainly in citrate cycle (tricarboxylic acid cycle) and alanine, aspartate and glucose metabolism.
Our results showed that the BRPE scale could be used to monitor body fatigue in long-distance outdoor hiking with weight bearing.
We provide an objective method to evaluate body fatigue in outdoor-hiking exercise.
Provenance and peer review: Unsolicited article; Externally peer reviewed.
Peer-review model: Single blind
Specialty type: Psychology
Country/Territory of origin: China
Peer-review report’s scientific quality classification
Grade A (Excellent): 0
Grade B (Very good): B
Grade C (Good): C
Grade D (Fair): 0
Grade E (Poor): 0
P-Reviewer: Gokce MI, Turkey; Narain R, Canada S-Editor: Wang JJ L-Editor: A P-Editor: Cai YX
| 1. | Rice H, Fallowfield J, Allsopp A, Dixon S. Influence of a 12.8-km military load carriage activity on lower limb gait mechanics and muscle activity. Ergonomics. 2017;60:649-656. [RCA] [PubMed] [DOI] [Full Text] [Cited by in Crossref: 23] [Cited by in RCA: 15] [Article Influence: 1.9] [Reference Citation Analysis (0)] |
| 2. | Jensen AE, Laird M, Jameson JT, Kelly KR. Prevalence of Musculoskeletal Injuries Sustained During Marine Corps Recruit Training. Mil Med. 2019;184:511-520. [RCA] [PubMed] [DOI] [Full Text] [Cited by in Crossref: 14] [Cited by in RCA: 14] [Article Influence: 2.3] [Reference Citation Analysis (0)] |
| 3. | Ruan Y, Song SJ, Yin ZF, Wang M, Huang N, Gu W, Ling CQ. Comprehensive evaluation of military training-induced fatigue among soldiers in China: A Delphi consensus study. Front Public Health. 2022;10:1004910. [RCA] [PubMed] [DOI] [Full Text] [Cited by in RCA: 6] [Reference Citation Analysis (0)] |
| 4. | da Silva DK, Jacinto JL, de Andrade WB, Roveratti MC, Estoche JM, Balvedi MCW, de Oliveira DB, da Silva RA, Aguiar AF. Citrulline Malate Does Not Improve Muscle Recovery after Resistance Exercise in Untrained Young Adult Men. Nutrients. 2017;9. [RCA] [PubMed] [DOI] [Full Text] [Full Text (PDF)] [Cited by in Crossref: 34] [Cited by in RCA: 29] [Article Influence: 3.6] [Reference Citation Analysis (0)] |
| 5. | Romagnoli M, Sanchis-Gomar F, Alis R, Risso-Ballester J, Bosio A, Graziani RL, Rampinini E. Changes in muscle damage, inflammation, and fatigue-related parameters in young elite soccer players after a match. J Sports Med Phys Fitness. 2016;56:1198-1205. [PubMed] |
| 6. | Balady GJ, Arena R, Sietsema K, Myers J, Coke L, Fletcher GF, Forman D, Franklin B, Guazzi M, Gulati M, Keteyian SJ, Lavie CJ, Macko R, Mancini D, Milani RV; American Heart Association Exercise, Cardiac Rehabilitation, and Prevention Committee of the Council on Clinical Cardiology; Council on Epidemiology and Prevention; Council on Peripheral Vascular Disease; Interdisciplinary Council on Quality of Care and Outcomes Research. Clinician's Guide to cardiopulmonary exercise testing in adults: a scientific statement from the American Heart Association. Circulation. 2010;122:191-225. [RCA] [PubMed] [DOI] [Full Text] [Cited by in Crossref: 1144] [Cited by in RCA: 1437] [Article Influence: 95.8] [Reference Citation Analysis (0)] |
| 7. | Koch AJ, Pereira R, Machado M. The creatine kinase response to resistance exercise. J Musculoskelet Neuronal Interact. 2014;14:68-77. [PubMed] |
| 8. | Doma K, Singh U, Boullosa D, Connor JD. The effect of branched-chain amino acid on muscle damage markers and performance following strenuous exercise: a systematic review and meta-analysis. Appl Physiol Nutr Metab. 2021;46:1303-1313. [RCA] [PubMed] [DOI] [Full Text] [Cited by in Crossref: 3] [Cited by in RCA: 17] [Article Influence: 4.3] [Reference Citation Analysis (0)] |
| 9. | Borg GA. Psychophysical bases of perceived exertion. Med Sci Sports Exerc. 1982;14:377-381. [PubMed] |
| 10. | Garnacho-Castaño MV, Domínguez R, Muñoz González A, Feliu-Ruano R, Serra-Payá N, Maté-Muñoz JL. Exercise Prescription Using the Borg Rating of Perceived Exertion to Improve Fitness. Int J Sports Med. 2018;39:115-123. [RCA] [PubMed] [DOI] [Full Text] [Cited by in Crossref: 14] [Cited by in RCA: 24] [Article Influence: 3.0] [Reference Citation Analysis (0)] |
| 11. | Ciolac EG, Mantuani SS, Neiva CM, Verardi C, Pessôa-Filho DM, Pimenta L. Rating of perceived exertion as a tool for prescribing and self regulating interval training: a pilot study. Biol Sport. 2015;32:103-108. [RCA] [PubMed] [DOI] [Full Text] [Full Text (PDF)] [Cited by in Crossref: 28] [Cited by in RCA: 31] [Article Influence: 3.1] [Reference Citation Analysis (0)] |
| 12. | Borg G, Ljunggren G, Ceci R. The increase of perceived exertion, aches and pain in the legs, heart rate and blood lactate during exercise on a bicycle ergometer. Eur J Appl Physiol Occup Physiol. 1985;54:343-349. [RCA] [PubMed] [DOI] [Full Text] [Cited by in Crossref: 271] [Cited by in RCA: 268] [Article Influence: 6.7] [Reference Citation Analysis (0)] |
| 13. | Borg E, Borg G. A comparison of AME and CR100 for scaling perceived exertion. Acta Psychol (Amst). 2002;109:157-175. [RCA] [PubMed] [DOI] [Full Text] [Cited by in Crossref: 95] [Cited by in RCA: 104] [Article Influence: 4.5] [Reference Citation Analysis (0)] |
| 14. | Thompson PD, Arena R, Riebe D, Pescatello LS; American College of Sports Medicine. ACSM's new preparticipation health screening recommendations from ACSM's guidelines for exercise testing and prescription, ninth edition. Curr Sports Med Rep. 2013;12:215-217. [RCA] [PubMed] [DOI] [Full Text] [Cited by in Crossref: 341] [Cited by in RCA: 485] [Article Influence: 44.1] [Reference Citation Analysis (0)] |
| 15. | Edwards RH, Melcher A, Hesser CM, Wigertz O, Ekelund LG. Physiological correlates of perceived exertion in continuous and intermittent exercise with the same average power output. Eur J Clin Invest. 1972;2:108-114. [RCA] [PubMed] [DOI] [Full Text] [Cited by in Crossref: 62] [Cited by in RCA: 66] [Article Influence: 1.2] [Reference Citation Analysis (0)] |
| 16. | Utter AC, Nieman DC, Dumke CL, McAnulty SR, Kang J, McAnulty LS. Ratings of perceived exertion during intermittent and continuous exercise. Percept Mot Skills. 2007;104:1079-1087. [RCA] [PubMed] [DOI] [Full Text] [Cited by in Crossref: 2] [Cited by in RCA: 2] [Article Influence: 0.1] [Reference Citation Analysis (0)] |
| 17. | Simpson KM, Munro BJ, Steele JR. Effect of load mass on posture, heart rate and subjective responses of recreational female hikers to prolonged load carriage. Appl Ergon. 2011;42:403-410. [RCA] [PubMed] [DOI] [Full Text] [Cited by in Crossref: 43] [Cited by in RCA: 41] [Article Influence: 2.9] [Reference Citation Analysis (0)] |
| 18. | Zinoubi B, Zbidi S, Vandewalle H, Chamari K, Driss T. Relationships between rating of perceived exertion, heart rate and blood lactate during continuous and alternated-intensity cycling exercises. Biol Sport. 2018;35:29-37. [RCA] [PubMed] [DOI] [Full Text] [Full Text (PDF)] [Cited by in Crossref: 11] [Cited by in RCA: 21] [Article Influence: 3.0] [Reference Citation Analysis (0)] |
| 19. | Schranner D, Kastenmüller G, Schönfelder M, Römisch-Margl W, Wackerhage H. Metabolite Concentration Changes in Humans After a Bout of Exercise: a Systematic Review of Exercise Metabolomics Studies. Sports Med Open. 2020;6:11. [RCA] [PubMed] [DOI] [Full Text] [Full Text (PDF)] [Cited by in Crossref: 61] [Cited by in RCA: 146] [Article Influence: 29.2] [Reference Citation Analysis (0)] |
| 20. | Kirwan GM, Coffey VG, Niere JO, Hawley JA, Adams MJ. Spectroscopic correlation analysis of NMR-based metabonomics in exercise science. Anal Chim Acta. 2009;652:173-179. [RCA] [PubMed] [DOI] [Full Text] [Cited by in Crossref: 33] [Cited by in RCA: 33] [Article Influence: 2.1] [Reference Citation Analysis (0)] |
| 21. | Enea C, Seguin F, Petitpas-Mulliez J, Boildieu N, Boisseau N, Delpech N, Diaz V, Eugène M, Dugué B. (1)H NMR-based metabolomics approach for exploring urinary metabolome modifications after acute and chronic physical exercise. Anal Bioanal Chem. 2010;396:1167-1176. [RCA] [PubMed] [DOI] [Full Text] [Cited by in Crossref: 80] [Cited by in RCA: 87] [Article Influence: 5.4] [Reference Citation Analysis (0)] |
| 22. | Lee LK, Kim JH, Kim MY, Lee JU, Yang SM, Jeon HJ, Lee WD, Noh JW, Kwak TY, Jang SH, Lee TH, Kim JY, Kim J. A Pilot Study on Pain and the Upregulation of Myoglobin through Low-frequency and High-amplitude Electrical Stimulation-induced Muscle Contraction. J Phys Ther Sci. 2014;26:985-988. [RCA] [PubMed] [DOI] [Full Text] [Full Text (PDF)] [Cited by in Crossref: 8] [Cited by in RCA: 7] [Article Influence: 0.6] [Reference Citation Analysis (0)] |
| 23. | Del Coso J, Salinero JJ, Abián-Vicen J, González-Millán C, Garde S, Vega P, Pérez-González B. Influence of body mass loss and myoglobinuria on the development of muscle fatigue after a marathon in a warm environment. Appl Physiol Nutr Metab. 2013;38:286-291. [RCA] [PubMed] [DOI] [Full Text] [Cited by in Crossref: 21] [Cited by in RCA: 22] [Article Influence: 1.7] [Reference Citation Analysis (0)] |
| 24. | Mateus GAS, Assumpção CO, Cabido CET, Veneroso CE, Oliveira SFM, Fermino RC, Mortatti A, Lima LCR, Vilas Boas JP, Banja Fernandes TL. Effect of Fatigue and Graded Running on Kinematics and Kinetics Parameters in Triathletes. Int J Sports Med. 2022;43:797-803. [RCA] [PubMed] [DOI] [Full Text] [Reference Citation Analysis (0)] |
| 25. | Noor D, McCall A, Jones M, Duncan C, Ehrmann F, Meyer T, Duffield R. Perceived load, fatigue and recovery responses during congested and non-congested micro-cycles in international football tournaments. J Sci Med Sport. 2021;24:1278-1283. [RCA] [PubMed] [DOI] [Full Text] [Cited by in RCA: 10] [Reference Citation Analysis (0)] |
| 26. | Marinho AH, Sousa FAB, Vilela RAMP, Balikian P Jr, de Souza Bento E, de Mendonça Aquino T, Crispim A, Ataide-Silva T, de Araujo GG. The rating of perceived exertion is able to differentiate the post-matches metabolomic profile of elite U-20 soccer players. Eur J Appl Physiol. 2022;122:371-382. [RCA] [PubMed] [DOI] [Full Text] [Cited by in Crossref: 4] [Reference Citation Analysis (0)] |
| 27. | Kang W, Suzuki M, Saito T, Miyado K. Emerging Role of TCA Cycle-Related Enzymes in Human Diseases. Int J Mol Sci. 2021;22. [RCA] [PubMed] [DOI] [Full Text] [Full Text (PDF)] [Cited by in Crossref: 41] [Cited by in RCA: 65] [Article Influence: 16.3] [Reference Citation Analysis (0)] |
| 28. | Hargreaves M, Spriet LL. Skeletal muscle energy metabolism during exercise. Nat Metab. 2020;2:817-828. [RCA] [PubMed] [DOI] [Full Text] [Cited by in Crossref: 261] [Cited by in RCA: 614] [Article Influence: 122.8] [Reference Citation Analysis (0)] |
| 29. | Kume S, Yamato M, Tamura Y, Jin G, Nakano M, Miyashige Y, Eguchi A, Ogata Y, Goda N, Iwai K, Yamano E, Watanabe Y, Soga T, Kataoka Y. Potential biomarkers of fatigue identified by plasma metabolome analysis in rats. PLoS One. 2015;10:e0120106. [RCA] [PubMed] [DOI] [Full Text] [Full Text (PDF)] [Cited by in Crossref: 31] [Cited by in RCA: 34] [Article Influence: 3.4] [Reference Citation Analysis (0)] |
| 30. | Tsai HH, Chang SC, Chou CH, Weng TP, Hsu CC, Wang JS. Exercise Training Alleviates Hypoxia-induced Mitochondrial Dysfunction in the Lymphocytes of Sedentary Males. Sci Rep. 2016;6:35170. [RCA] [PubMed] [DOI] [Full Text] [Full Text (PDF)] [Cited by in Crossref: 23] [Cited by in RCA: 35] [Article Influence: 3.9] [Reference Citation Analysis (0)] |
| 31. | Wagenmakers AJ. Muscle amino acid metabolism at rest and during exercise: role in human physiology and metabolism. Exerc Sport Sci Rev. 1998;26:287-314. [PubMed] |


