Copyright
©The Author(s) 2015.
World J Psychiatr. Sep 22, 2015; 5(3): 260-272
Published online Sep 22, 2015. doi: 10.5498/wjp.v5.i3.260
Published online Sep 22, 2015. doi: 10.5498/wjp.v5.i3.260
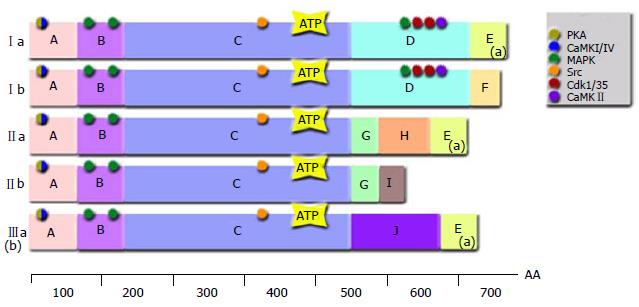
Figure 1 Illustration demonstrating the various mammalian synapsin gene products.
Various domains are indicated as well as known phosphorylation sites and their respective kinases (colour coded)[8,11,16]. (a): Domain “E” has been implicated in phospholipid vesicle clustering and dimerization; (b): Only a single version of synapsin III is illustrated.
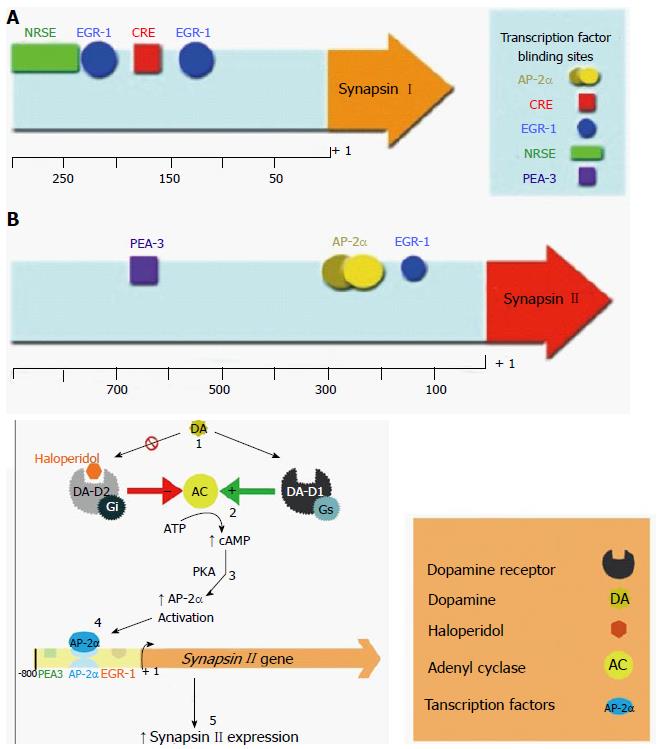
Figure 2 Illustration of the promoter regions of synapsin I and II respectively and proposed mechanism of dopaminergic regulation of synapsin II.
A: Illustration of the promoter regions of synapsin I and II respectively. Transcription factor binding sites have been indicated, showing their various positions in the promoter region; B: Proposed mechanism of dopaminergic regulation of synapsin II. Evidence: (1) Immunocytochemstry results indicate that ligand - DA Rc binding results in changes to synapsin protein levels dependant on Rc subtype; (2) Ligand binding causes changes to intercellular cAMP levels; (3) PKA inhibitors (5-24 amide trifluoroacetate salt, Rp-cAMPS) cause changes in synapsin II translation; (4) DA-D1 stimulation may cause AP-2 to bind to synapsin II promoter. Synapsin II expression levels were inhibited when cells were treated with AP-2 ADONs. Subsequent treatment with DA-D1 or -D2 agonists showed to effect on synapsin II expression; and (5) Synapsin 2 expression can be altered via upstream alteration at various points. Additional information: (1) EGR-1 levels are not affected by chronic treatment with DA-D1 or DA-D2 antagonists; (2) Antisense deoxyoligonucleotides for AP-2 reduces synapsin II expression levels; and (3) Antisense deoxyoligonucleotides for EGR-1 and PEA3 have no effect on the expression of synapsin II. EGR-1: Early growth response factor-1; PKA: Protein kinase A; cAMP: Cyclic AMP; AP-2α: Activating protein 2-alpha.
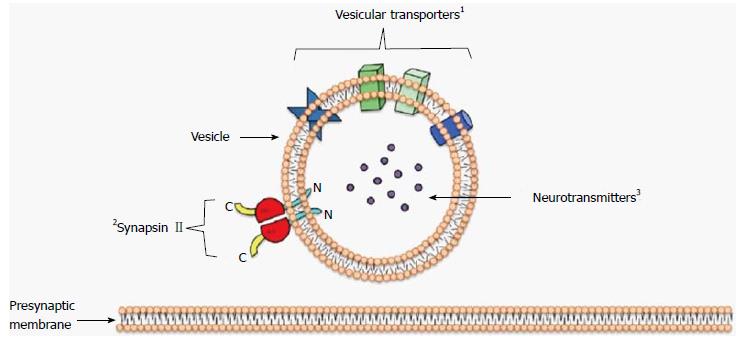
Figure 3 Illustrated depiction of a synaptic vesicle and associated pre-synaptic membrane.
This is a simplified depiction containing proteins and neurotransmitters that are most pertinent to the subject matter of this review; others have been omitted for simplicity sake (ex. Synapsin I, various transporter proteins, etc.). 1Vesicular transporters (also specific to the type and function of synapse) may include: VGLUT1, VGLUT2, VGAT and VMAT2; 2Various synapsin isoforms have been implicated in the tethering of synaptic vesicles (depending on the type of neurotransmitter and vesicular transporters associated). Synapsin isoforms include Ia-b, IIa-b, and IIa-e; 3Neurotransmitters contain within synaptic vesicle, may include: glutamate, GABA, DA, etc. VGLUT: Vesicular glutamate transporter; VGAT: Vesicular GABA transporter; VMAT2: Vesicular monoamine transporter 2; GABA: γ-aminobutyric acid.
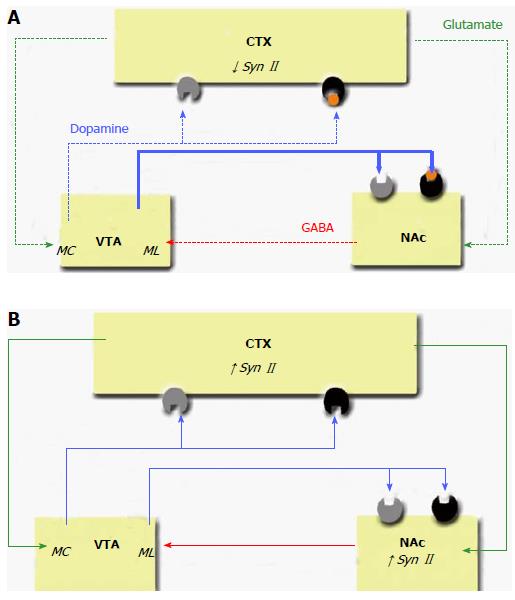
Figure 4 Oversimplified diagram of mesolimbic dysregulation in schizophrenia and the mesolimbic system following Antipsychotic drug treatment[94,95].
A: Oversimplified diagram of mesolimbic dysregulation in schizophrenia; B: Oversimplified diagram the mesolimbic system following APD treatment. Difference in neurotransmitter output is indicated through the various line colours (green = glutamatergic, red = GABAergic, blue = dopaminergic). Line thickness is reflective of neurotransmitter activity (thicker lines represent increased activity, dotted lines represent reduced activity). The various impacted brain regions are represented within boxes. CTX: Cortex; NAc: Nucleus accumbens; VTA: Ventral tegmental area; APD: Antipsychotic drug.
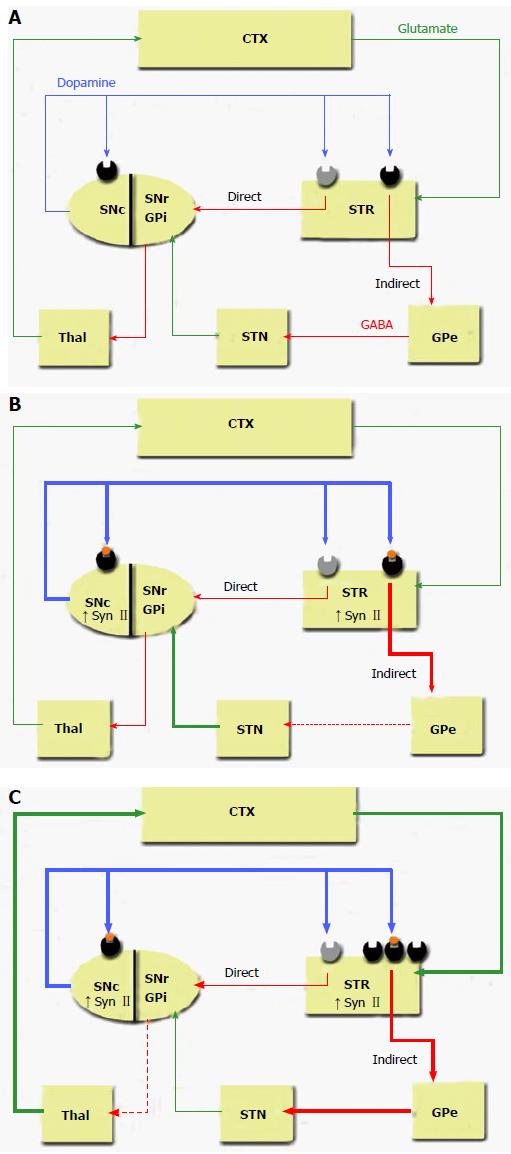
Figure 5 Depiction of basal ganglia interconnectivity.
Diagrams showcase both the direct and indirect pathways[94,95]. A: Normal basal ganglia regulation; B: Basal ganglia regulation following sub-chronic haloperidol treatment. Synapsin II levels also indicated; C: Basal ganglia regulation following chronic haloperidol treatment and manifestation of EPS. Synapsin levels are also indicated. Difference in neurotransmitter output is indicated through the various line colours (green = glutamatergic, red = GABAergic, blue = dopaminergic). Line thickness is reflective of neurotransmitter activity (thicker lines represent increased activity, dotted lines represent reduced activity). The various impacted brain regions are represented within boxes. Ghose and Tamminga. Handbook of Contemporary Neuropharmacology 2007: 251-283. CTX: Cortex; GPe: Globus pallidus external segment; GPi: Globus pallidus internal segment; SNc: Substantia nigra pars compacta; SNr: Substantia nigra pars reticulata; STN: Subthalamic nucleus; STR: Striatum; EPS: Extrapyramidal symptoms.
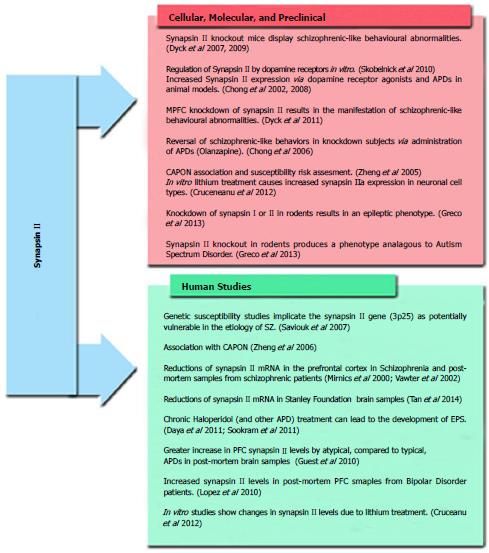
Figure 6 Empirical basis and experimental evidence suggesting the involvement of synapsin II in schizophrenia.
Image is a modified version of existing figure[10].
- Citation: Molinaro L, Hui P, Tan M, Mishra RK. Role of presynaptic phosphoprotein synapsin II in schizophrenia. World J Psychiatr 2015; 5(3): 260-272
- URL: https://www.wjgnet.com/2220-3206/full/v5/i3/260.htm
- DOI: https://dx.doi.org/10.5498/wjp.v5.i3.260


