Copyright
©The Author(s) 2015.
World J Psychiatr. Sep 22, 2015; 5(3): 260-272
Published online Sep 22, 2015. doi: 10.5498/wjp.v5.i3.260
Published online Sep 22, 2015. doi: 10.5498/wjp.v5.i3.260
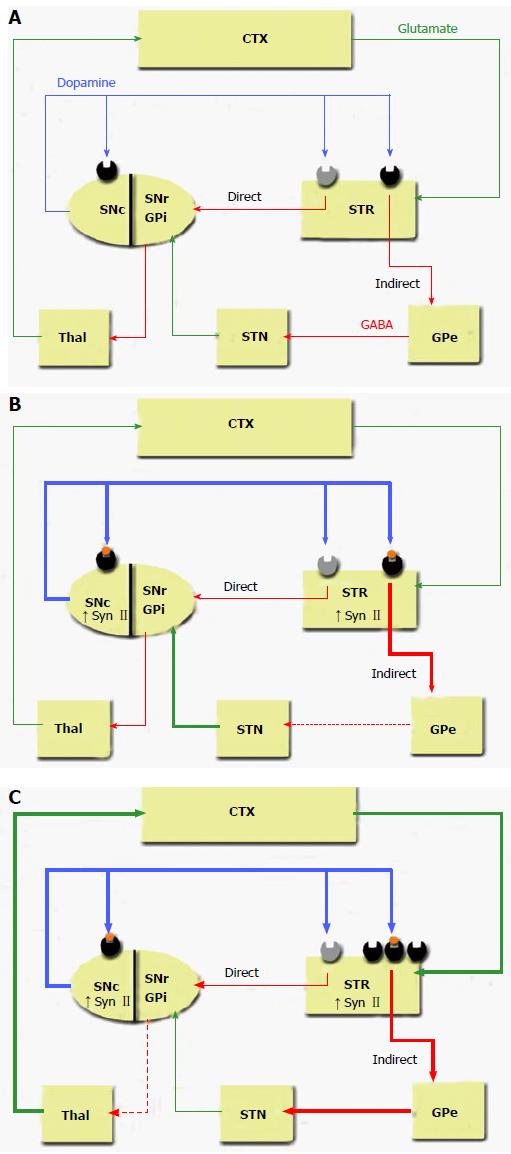
Figure 5 Depiction of basal ganglia interconnectivity.
Diagrams showcase both the direct and indirect pathways[94,95]. A: Normal basal ganglia regulation; B: Basal ganglia regulation following sub-chronic haloperidol treatment. Synapsin II levels also indicated; C: Basal ganglia regulation following chronic haloperidol treatment and manifestation of EPS. Synapsin levels are also indicated. Difference in neurotransmitter output is indicated through the various line colours (green = glutamatergic, red = GABAergic, blue = dopaminergic). Line thickness is reflective of neurotransmitter activity (thicker lines represent increased activity, dotted lines represent reduced activity). The various impacted brain regions are represented within boxes. Ghose and Tamminga. Handbook of Contemporary Neuropharmacology 2007: 251-283. CTX: Cortex; GPe: Globus pallidus external segment; GPi: Globus pallidus internal segment; SNc: Substantia nigra pars compacta; SNr: Substantia nigra pars reticulata; STN: Subthalamic nucleus; STR: Striatum; EPS: Extrapyramidal symptoms.
- Citation: Molinaro L, Hui P, Tan M, Mishra RK. Role of presynaptic phosphoprotein synapsin II in schizophrenia. World J Psychiatr 2015; 5(3): 260-272
- URL: https://www.wjgnet.com/2220-3206/full/v5/i3/260.htm
- DOI: https://dx.doi.org/10.5498/wjp.v5.i3.260


