Copyright
©The Author(s) 2015.
World J Psychiatr. Sep 22, 2015; 5(3): 260-272
Published online Sep 22, 2015. doi: 10.5498/wjp.v5.i3.260
Published online Sep 22, 2015. doi: 10.5498/wjp.v5.i3.260
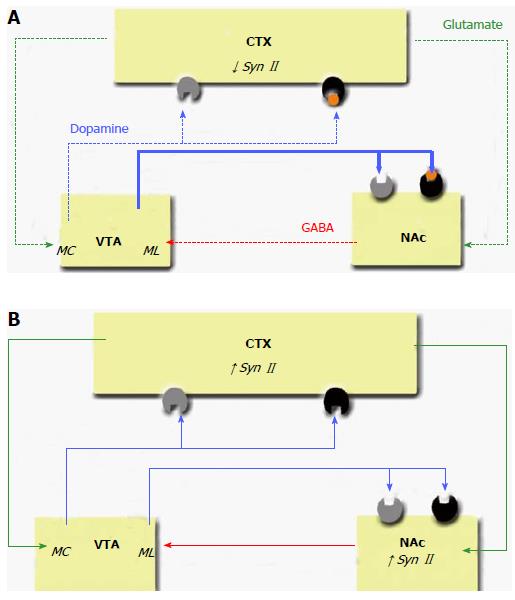
Figure 4 Oversimplified diagram of mesolimbic dysregulation in schizophrenia and the mesolimbic system following Antipsychotic drug treatment[94,95].
A: Oversimplified diagram of mesolimbic dysregulation in schizophrenia; B: Oversimplified diagram the mesolimbic system following APD treatment. Difference in neurotransmitter output is indicated through the various line colours (green = glutamatergic, red = GABAergic, blue = dopaminergic). Line thickness is reflective of neurotransmitter activity (thicker lines represent increased activity, dotted lines represent reduced activity). The various impacted brain regions are represented within boxes. CTX: Cortex; NAc: Nucleus accumbens; VTA: Ventral tegmental area; APD: Antipsychotic drug.
- Citation: Molinaro L, Hui P, Tan M, Mishra RK. Role of presynaptic phosphoprotein synapsin II in schizophrenia. World J Psychiatr 2015; 5(3): 260-272
- URL: https://www.wjgnet.com/2220-3206/full/v5/i3/260.htm
- DOI: https://dx.doi.org/10.5498/wjp.v5.i3.260


