
















Copyright: ©Author(s) 2026.
World J Psychiatry. Nov 19, 2026; 16(11): 124306
Published online Nov 19, 2026. doi: 10.5498/wjp.124306
Published online Nov 19, 2026. doi: 10.5498/wjp.124306
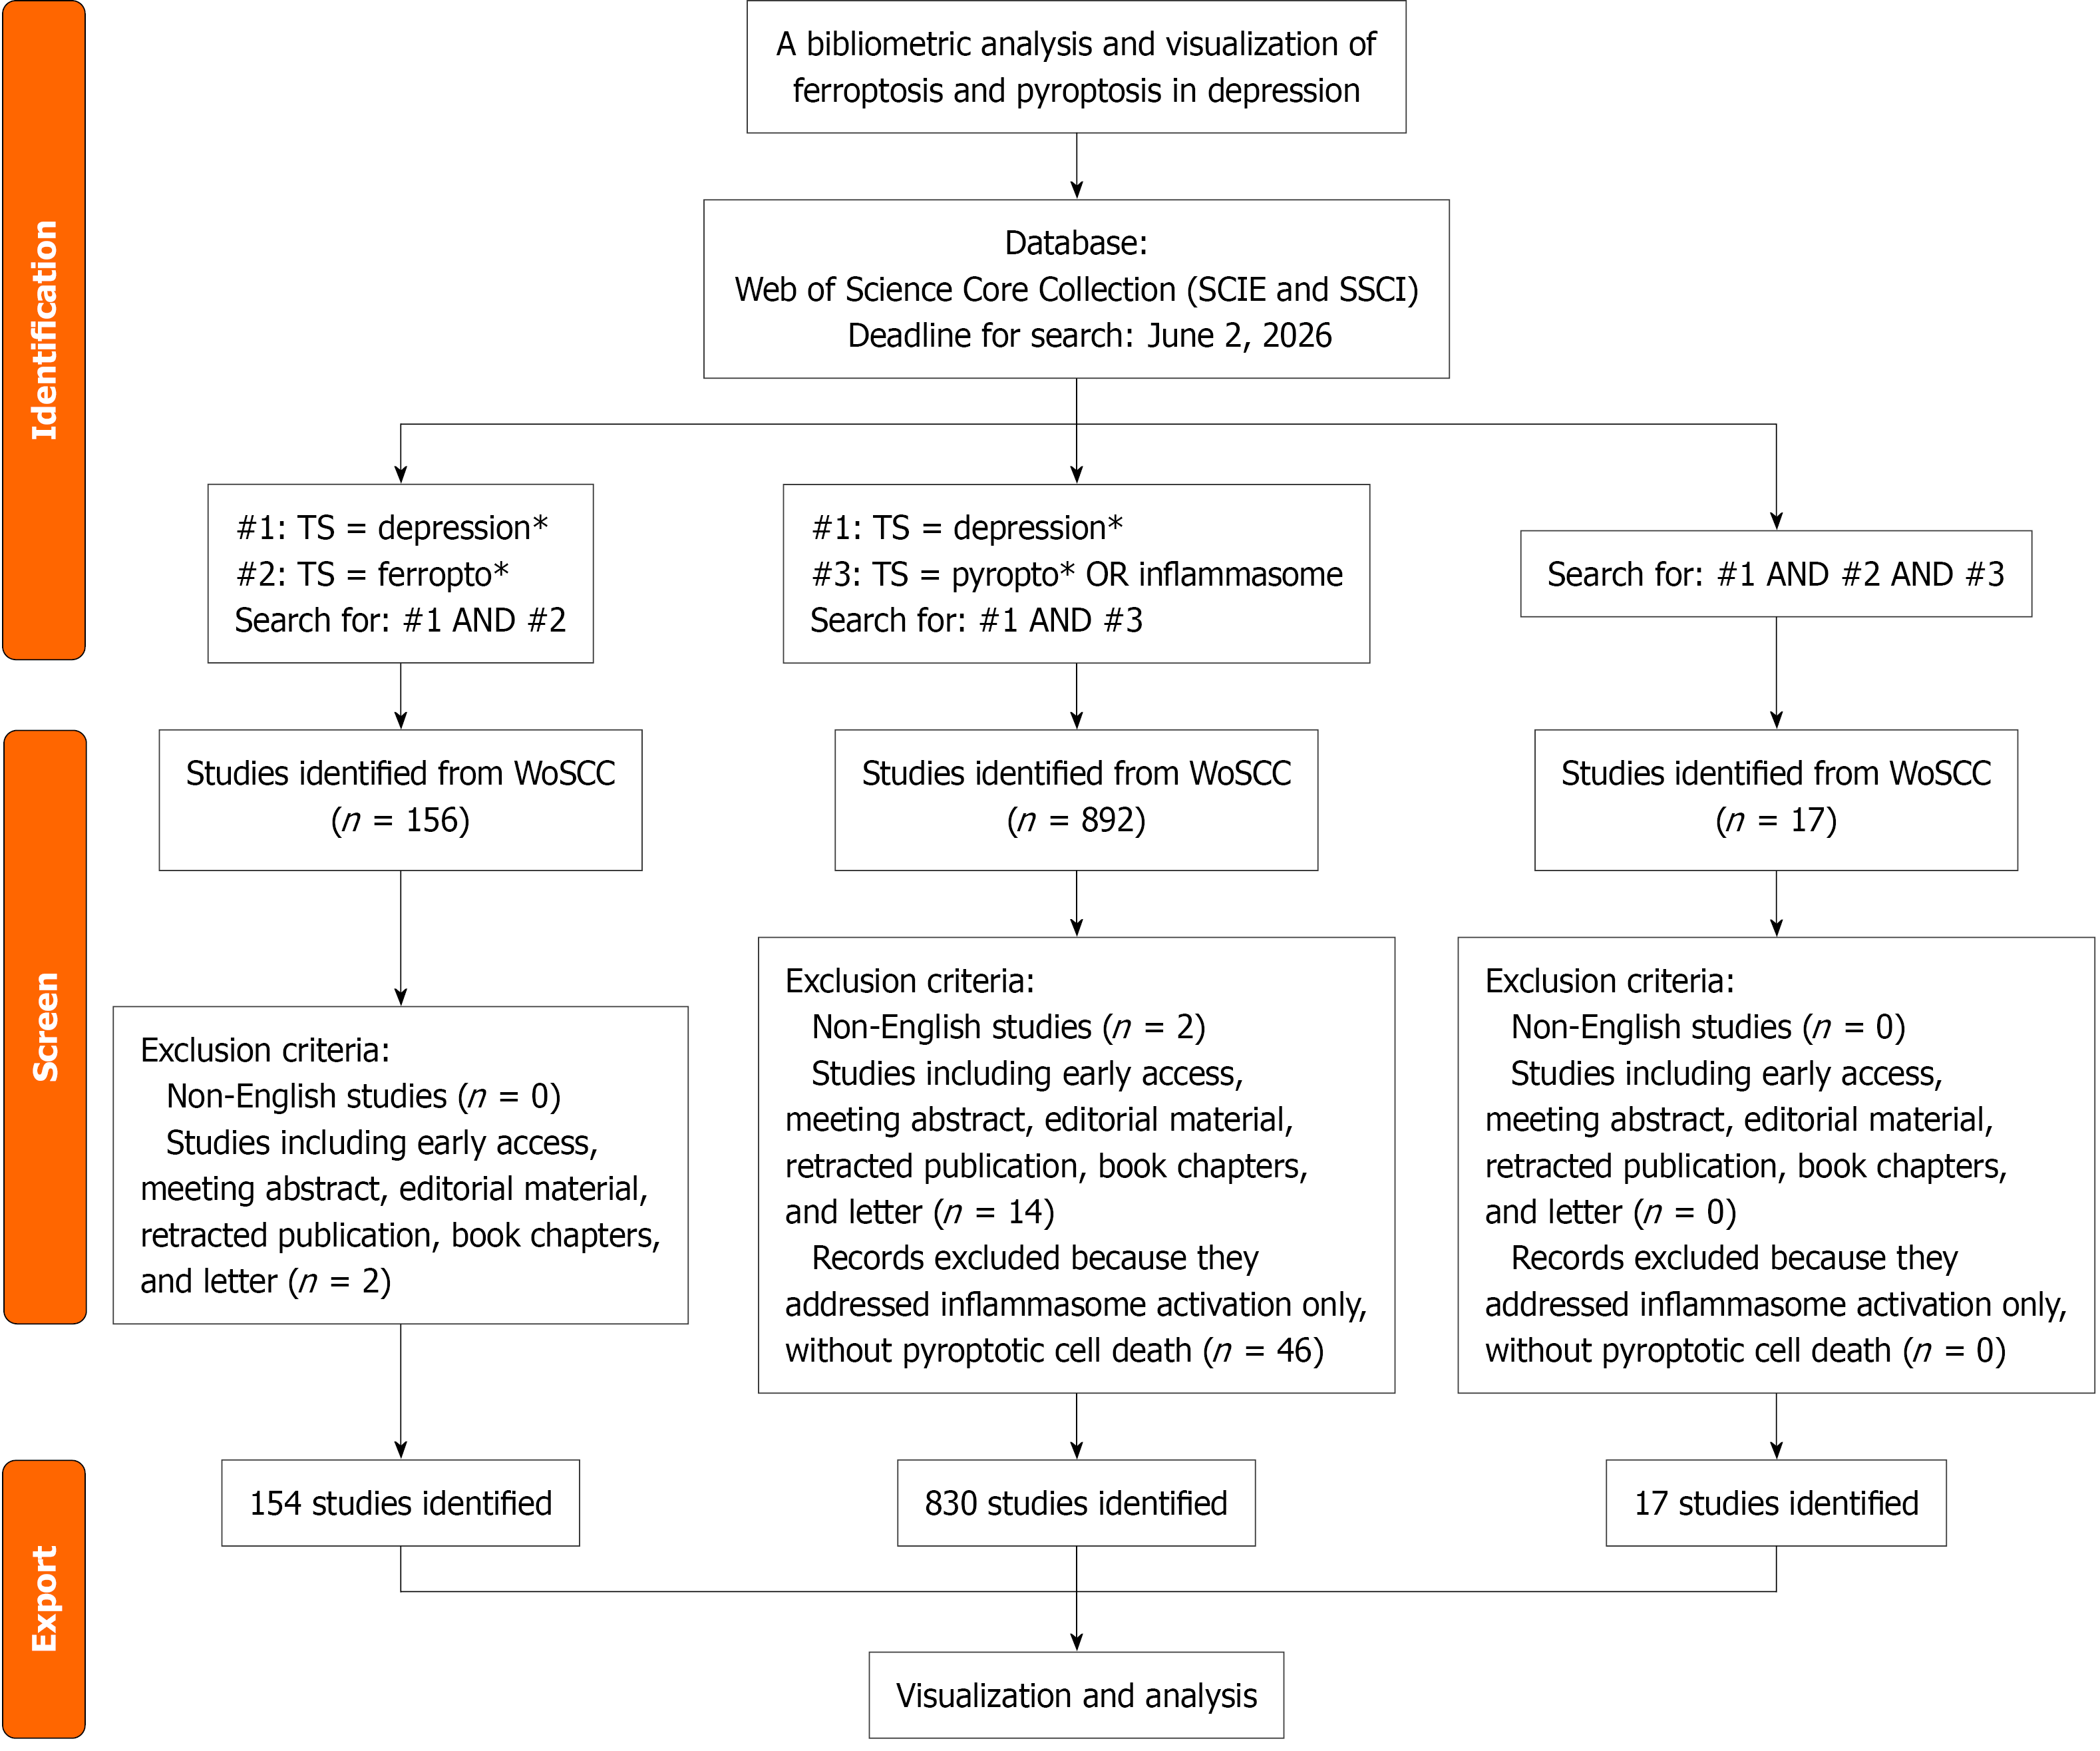
Figure 1 Flow diagram of document identification, screening, and inclusion for the ferroptosis-related and pyroptosis-related depression datasets retrieved from the Web of Science Core Collection.
The diagram shows the search strategies, record-selection procedures, eligibility criteria, reasons for exclusion, and final datasets included in the bibliometric analyses. Separate screening pathways are shown for the ferroptosis-related and pyroptosis-related datasets. For the pyroptosis-related dataset, studies addressing inflammasome activation without evidence of pyroptotic cell death or pyroptosis-related execution mechanisms were excluded. SCIE: Science Citation Index Expanded; SSCI: Social Sciences Citation Index; TS: Topic search; WoSCC: Web of Science Core Collection.
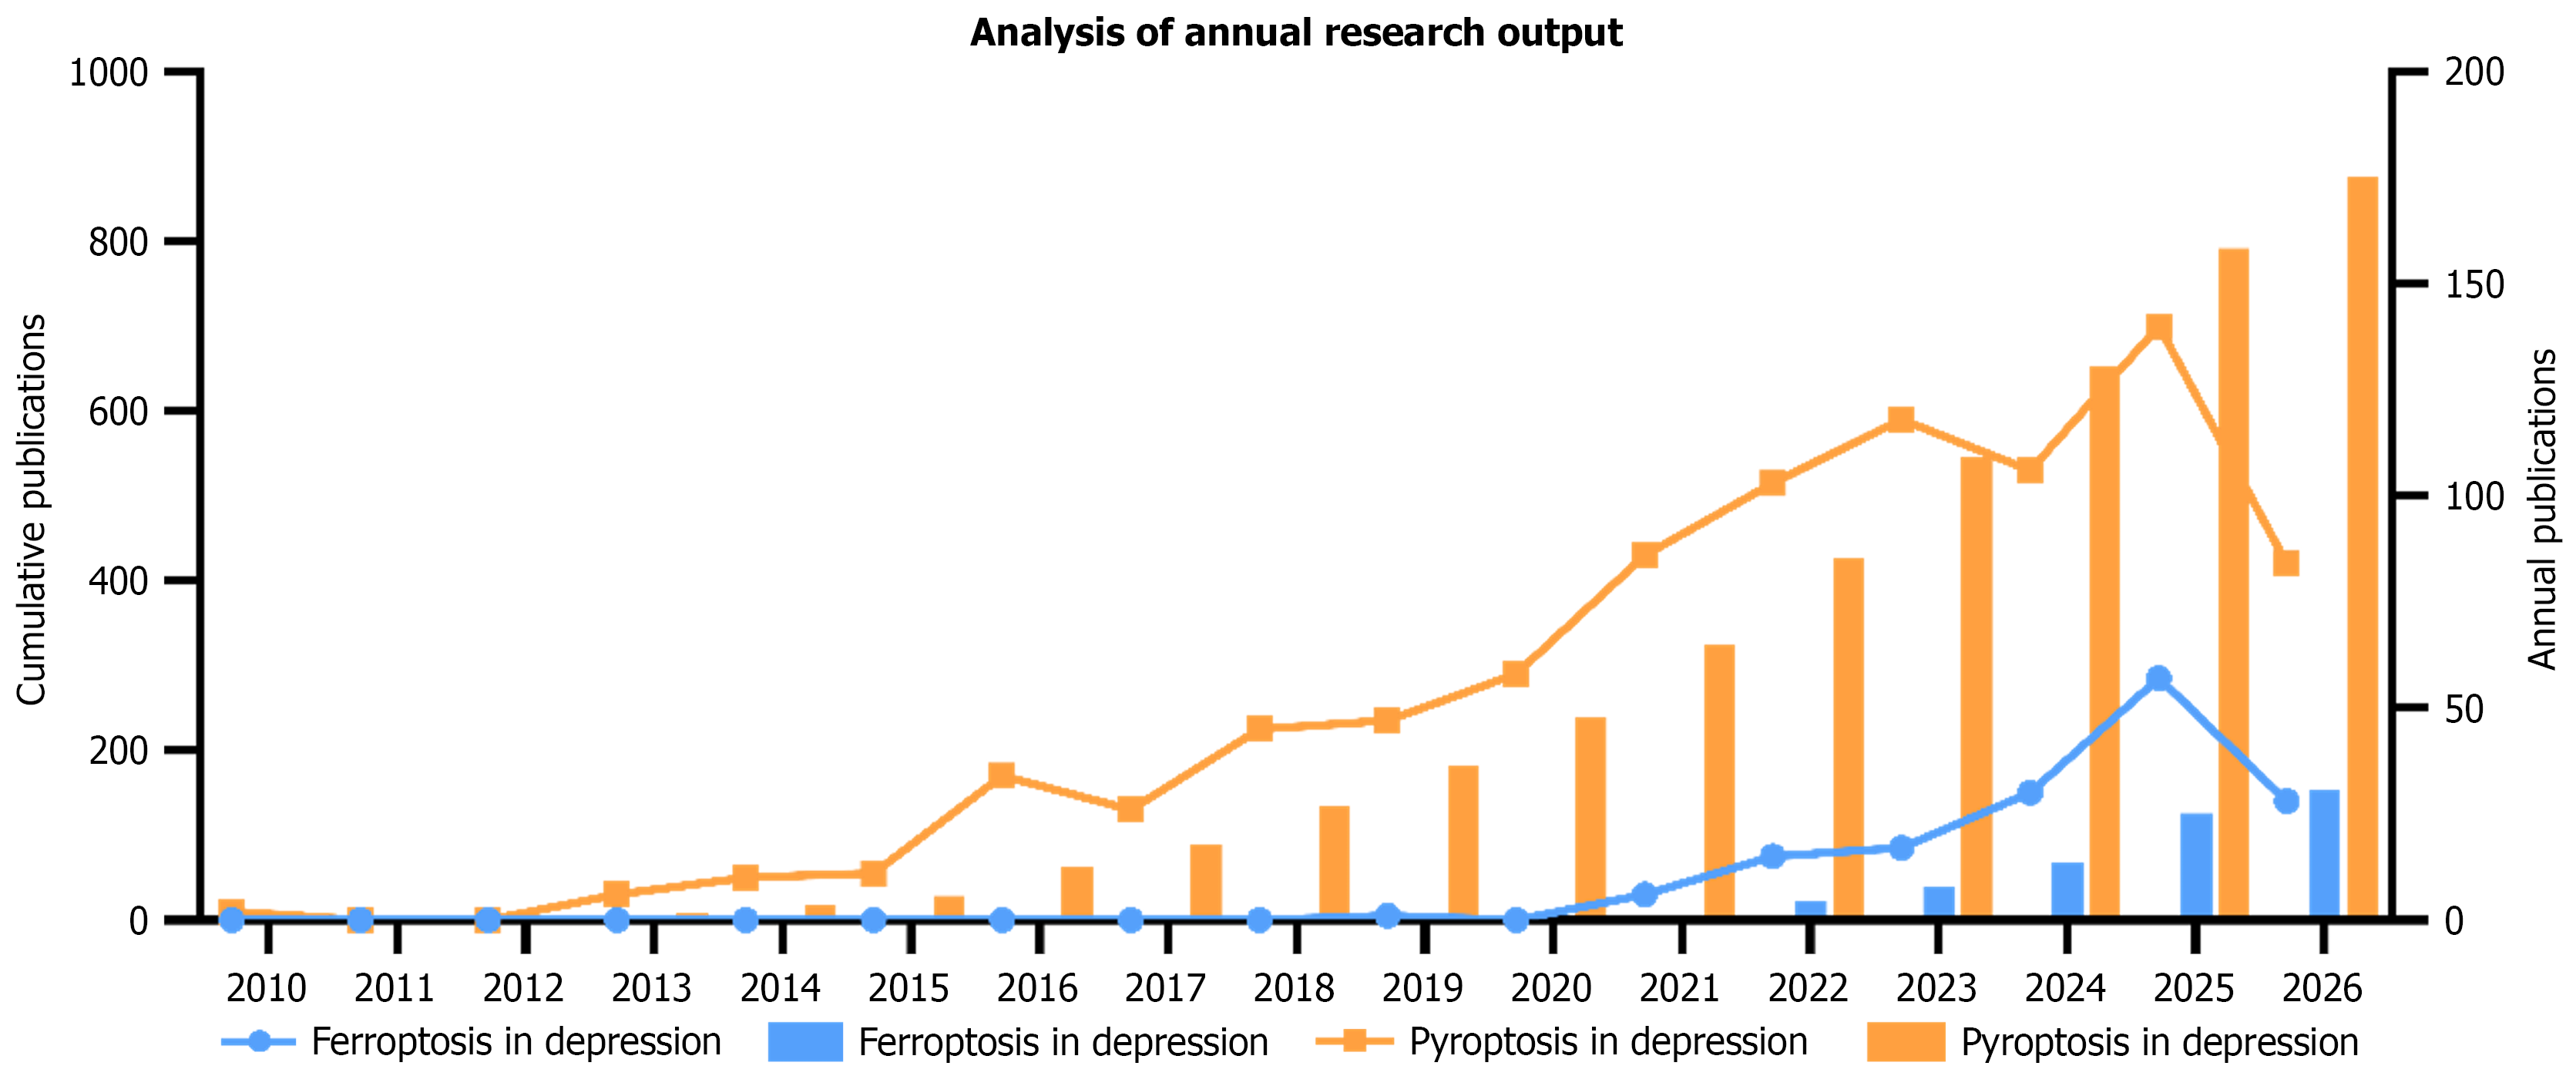
Figure 2 Annual publication output and cumulative growth trends in ferroptosis- and pyroptosis-related depression research.
The bar charts illustrate annual publication trends in the 2 research fields, while the line graphs depict the cumulative number of publications.
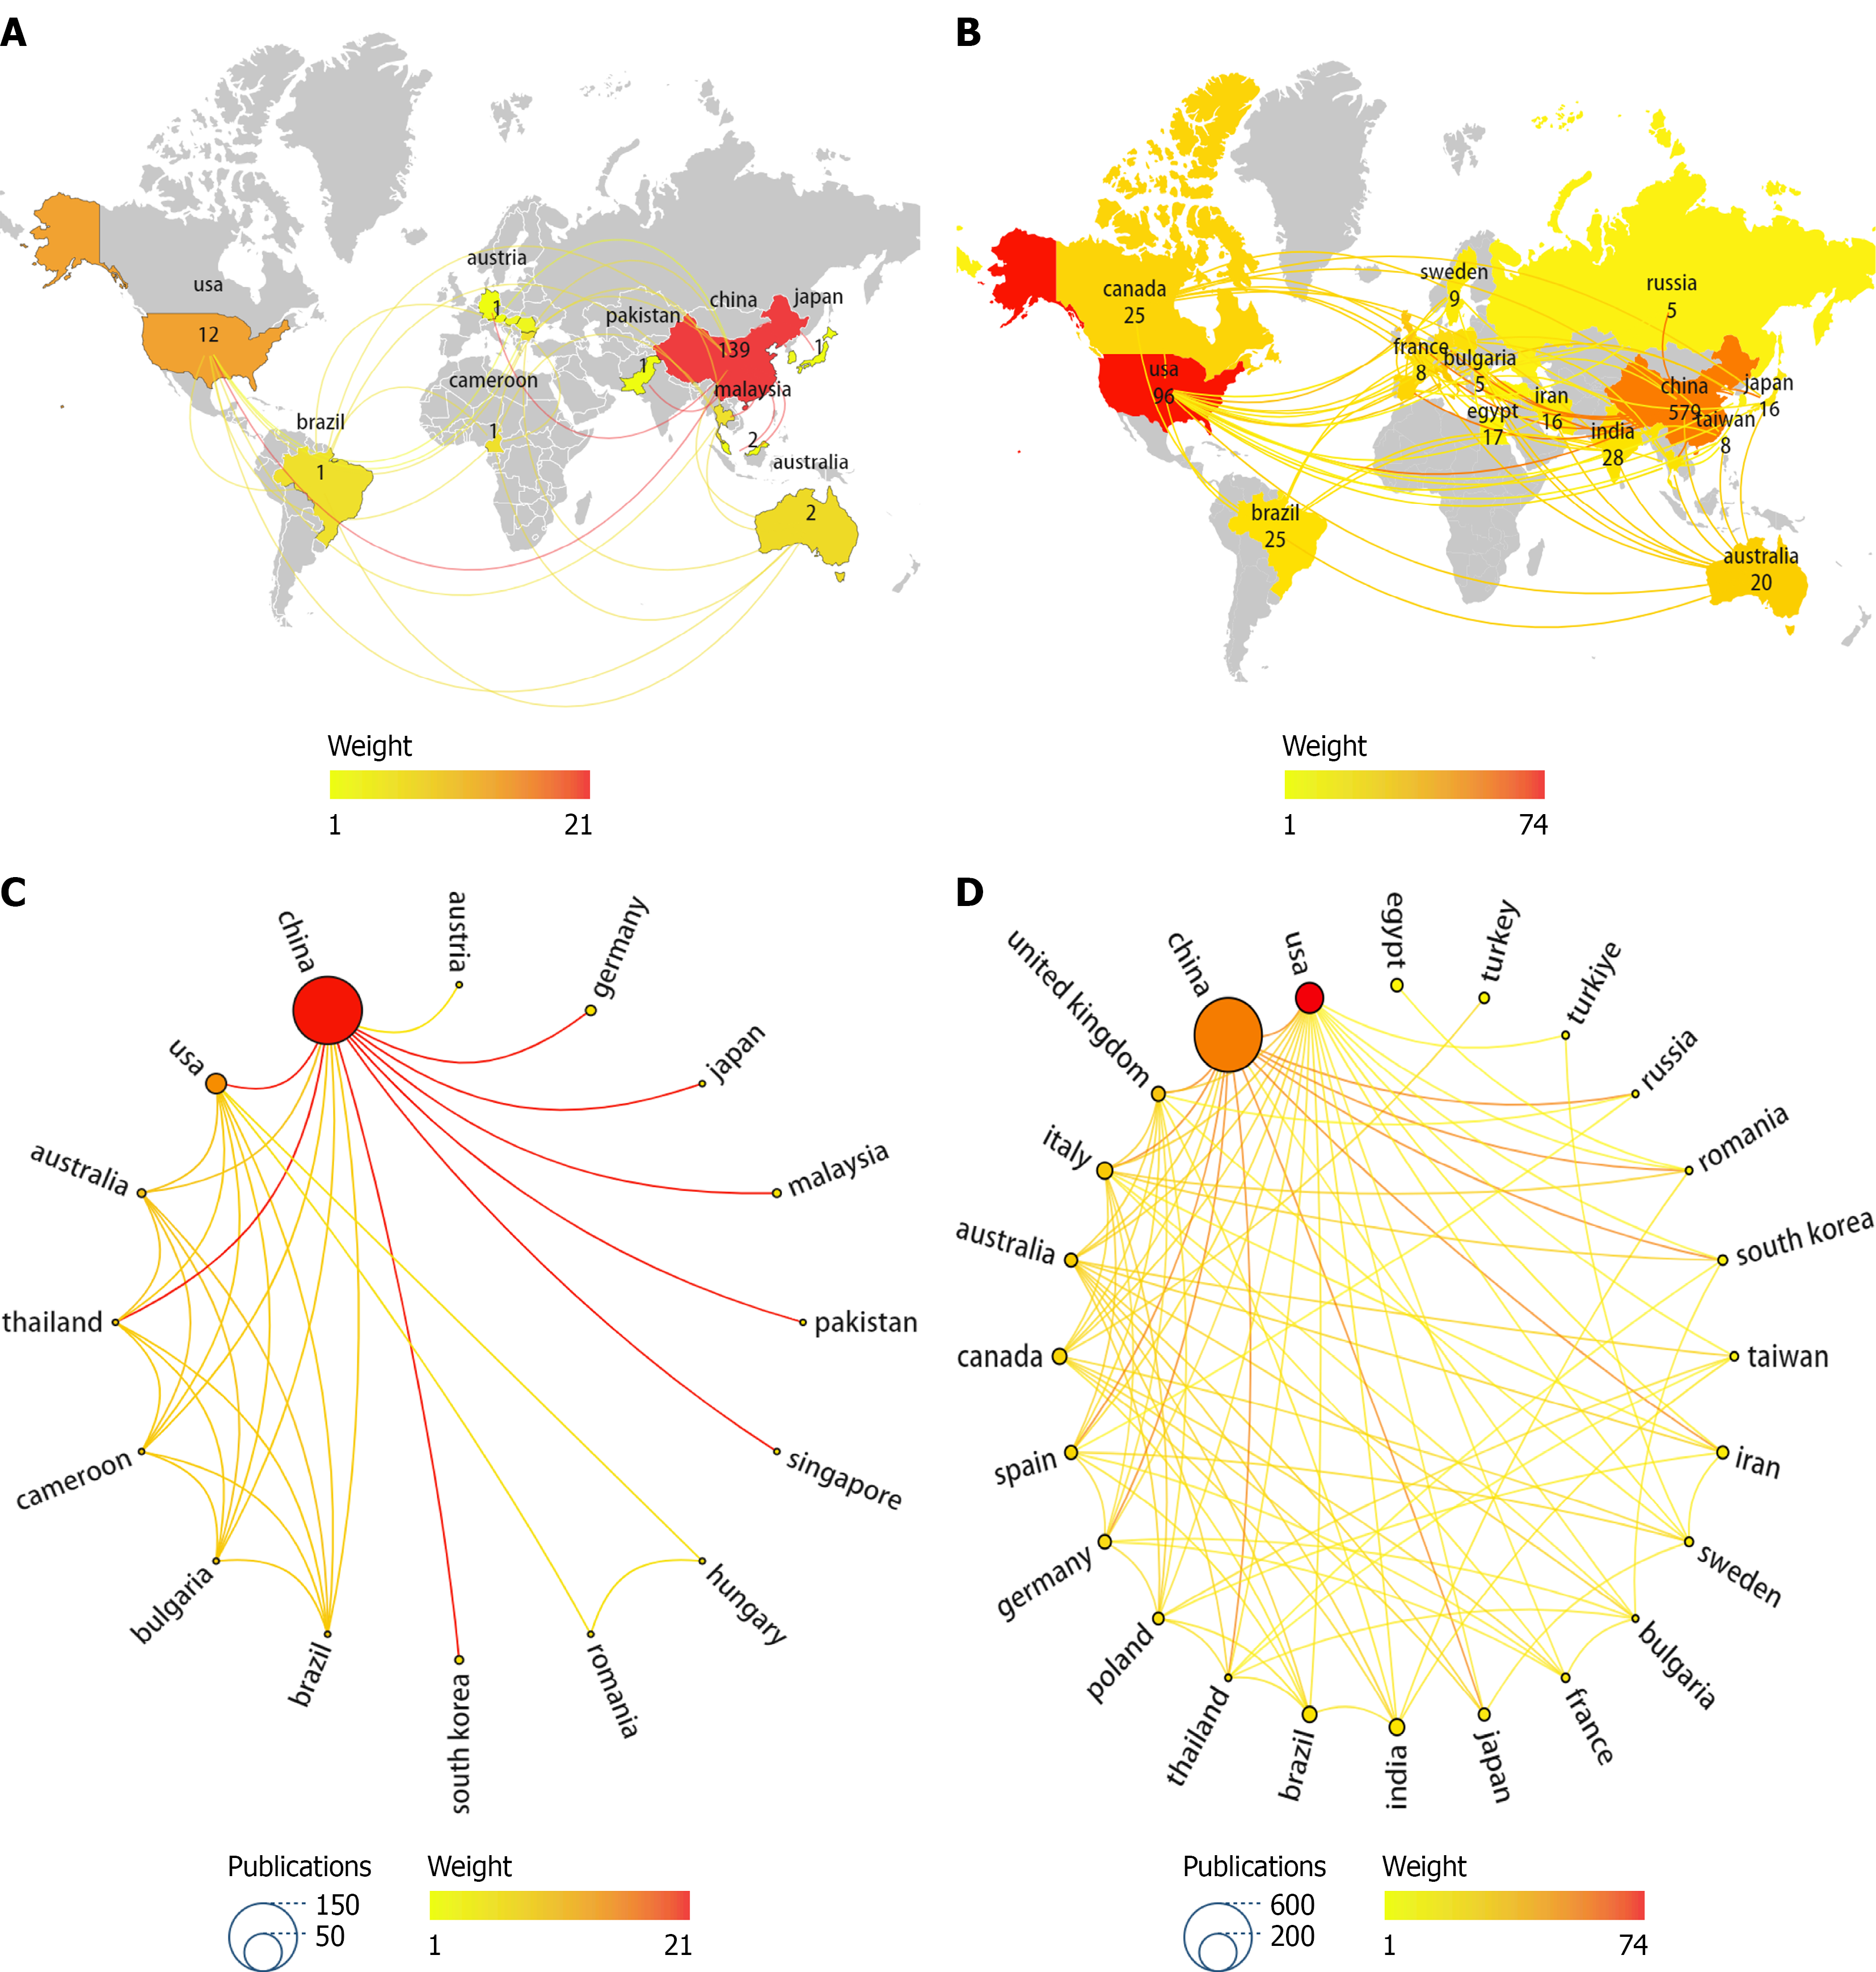
Figure 3 Geographic distribution and international collaboration networks of countries/regions in ferroptosis- and pyroptosis-related depression research.
A: Geographic distribution of publications on ferroptosis in depression; B: Geographic distribution of publications on pyroptosis in depression; C: International collaboration network of countries/regions in ferroptosis in depression; D: International collaboration network of countries/regions in pyroptosis in depression. In these visual maps, each node represents a country, and the links between countries represent collaborative relationships. The size of each node is proportional to the total number of publications. Red nodes indicate greater collaboration between a country and other countries, while thicker connecting lines between nodes indicate closer collaboration between the 2 countries.
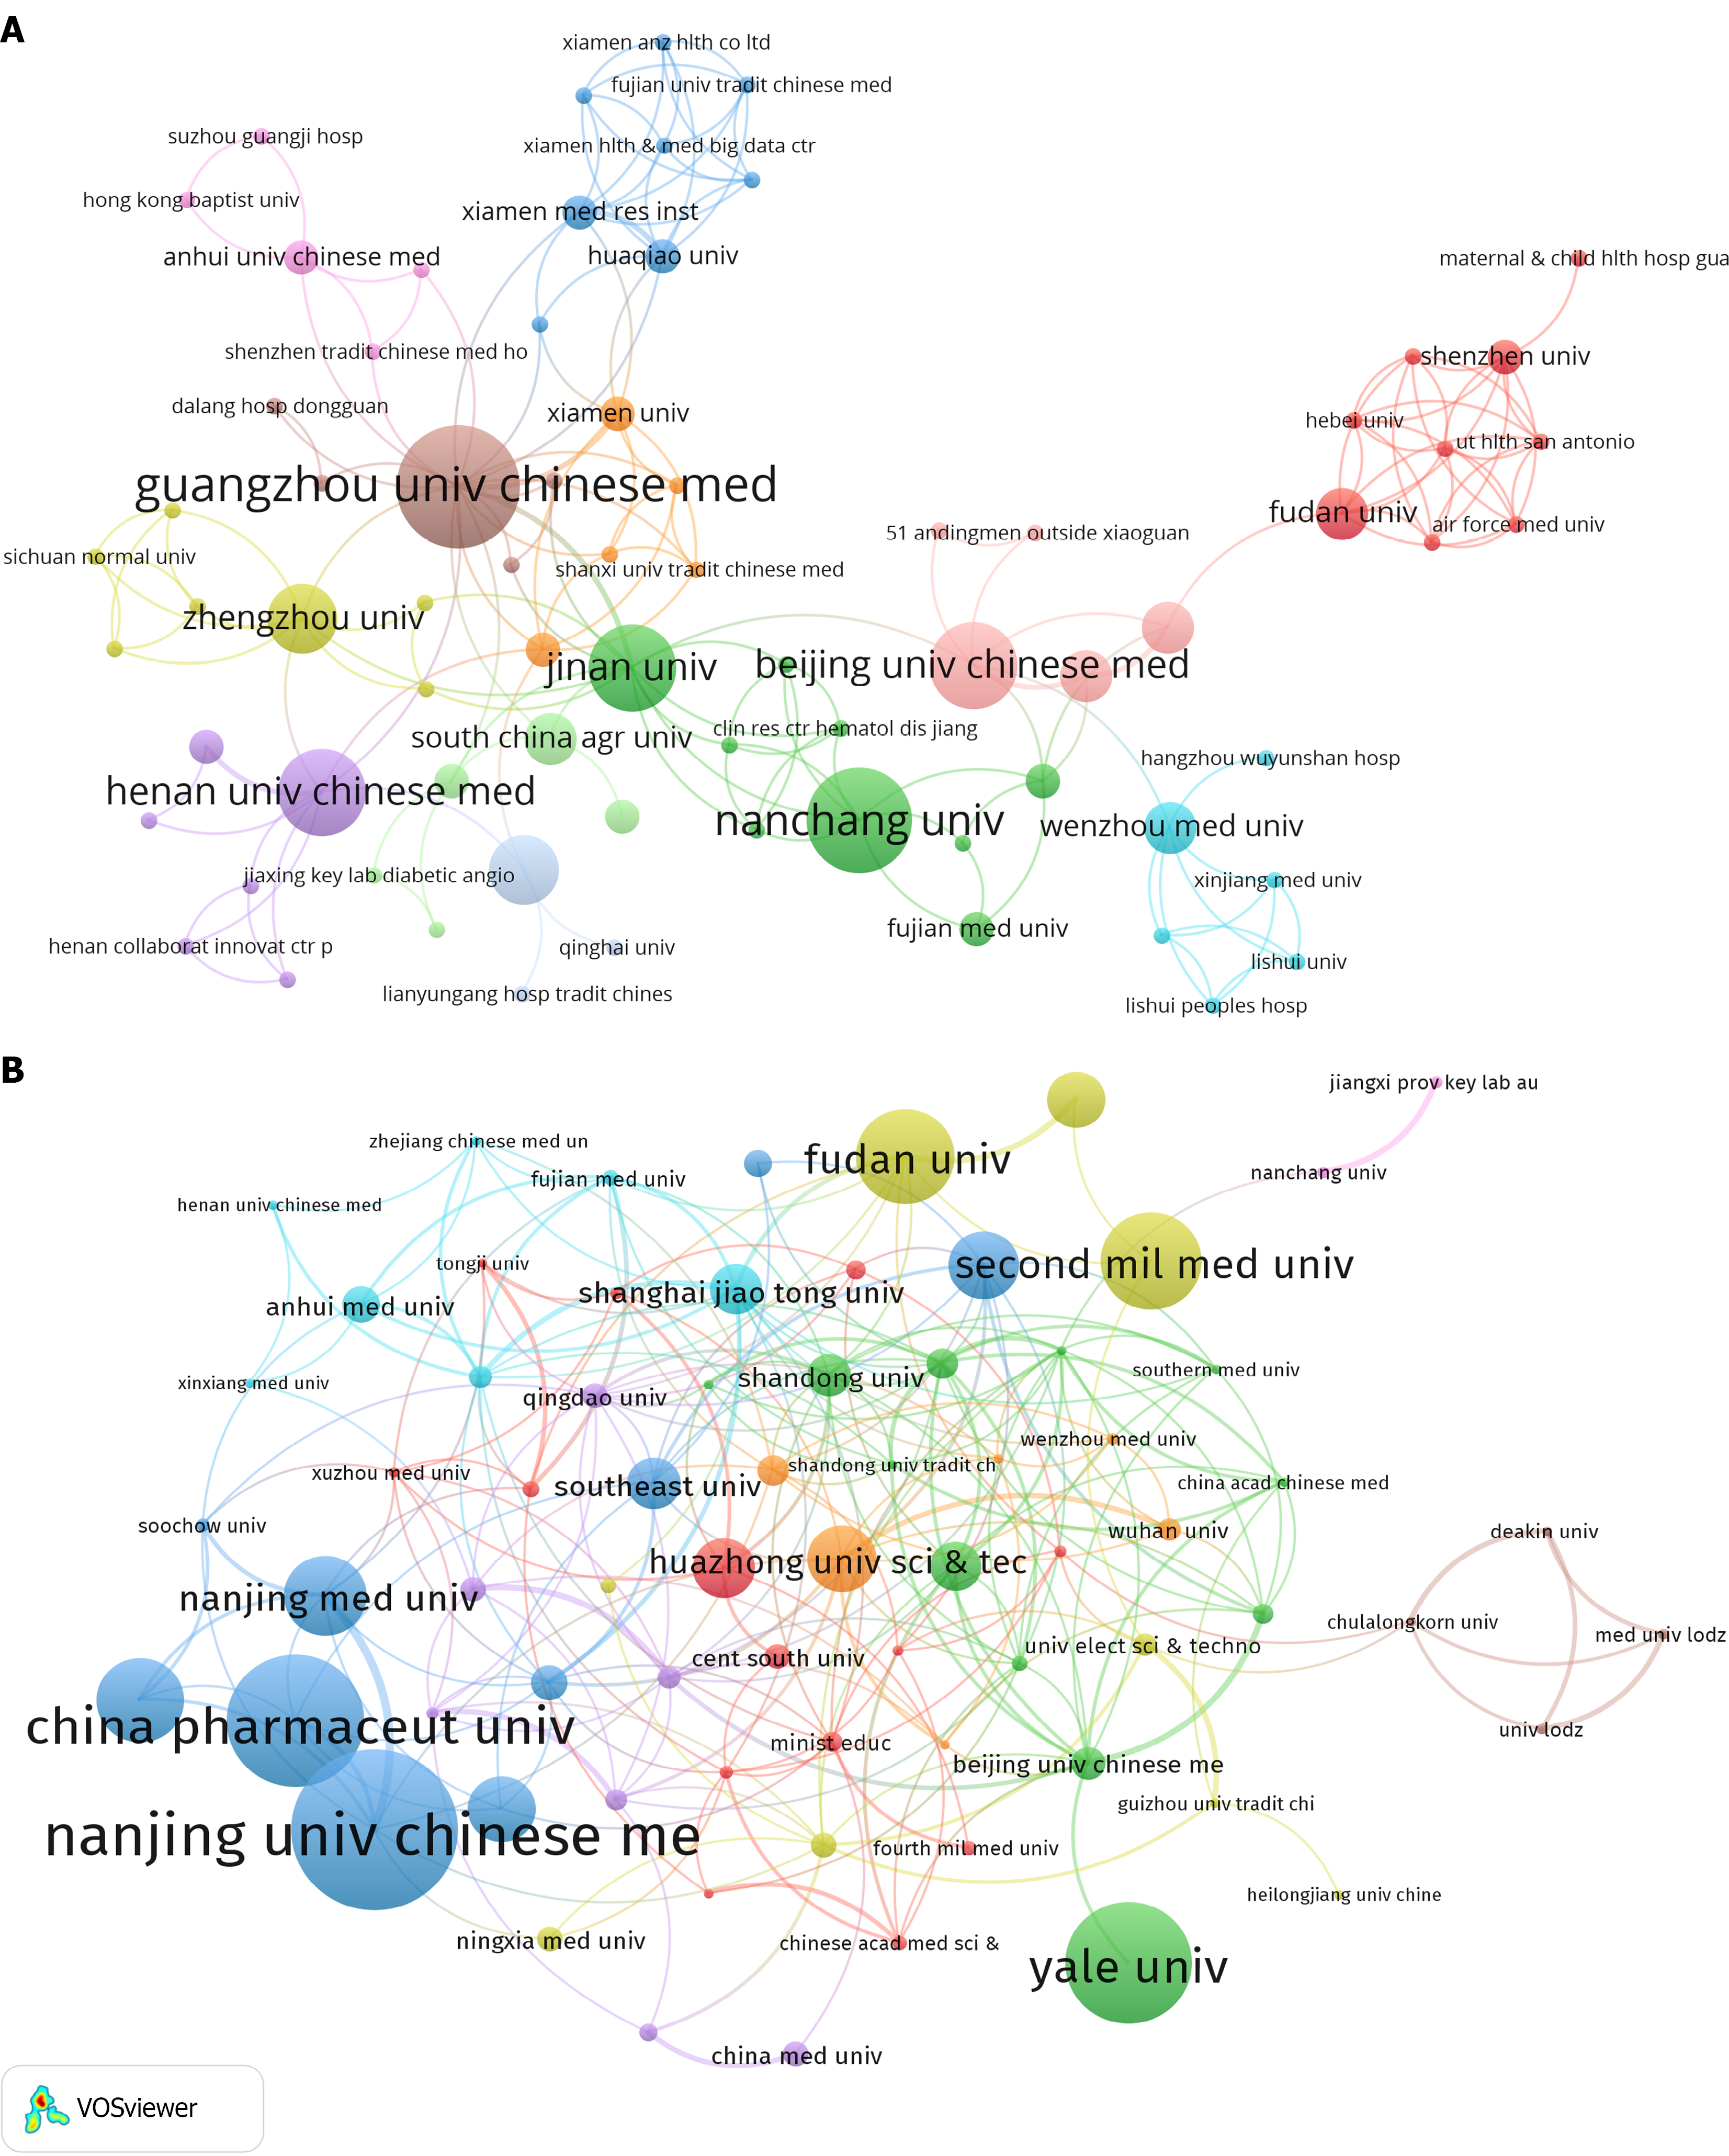
Figure 4 Institutional collaboration networks in ferroptosis- and pyroptosis-related depression research.
A: Institutional collaboration network in the field of ferroptosis in depression; B: Institutional collaboration network in the field of pyroptosis in depression. In both panels, each node represents an institution, and the node size is proportional to the number of publications. The lines between nodes represent collaborative relationships, with thicker lines indicating stronger collaboration. Different colors represent different institutional collaboration clusters.
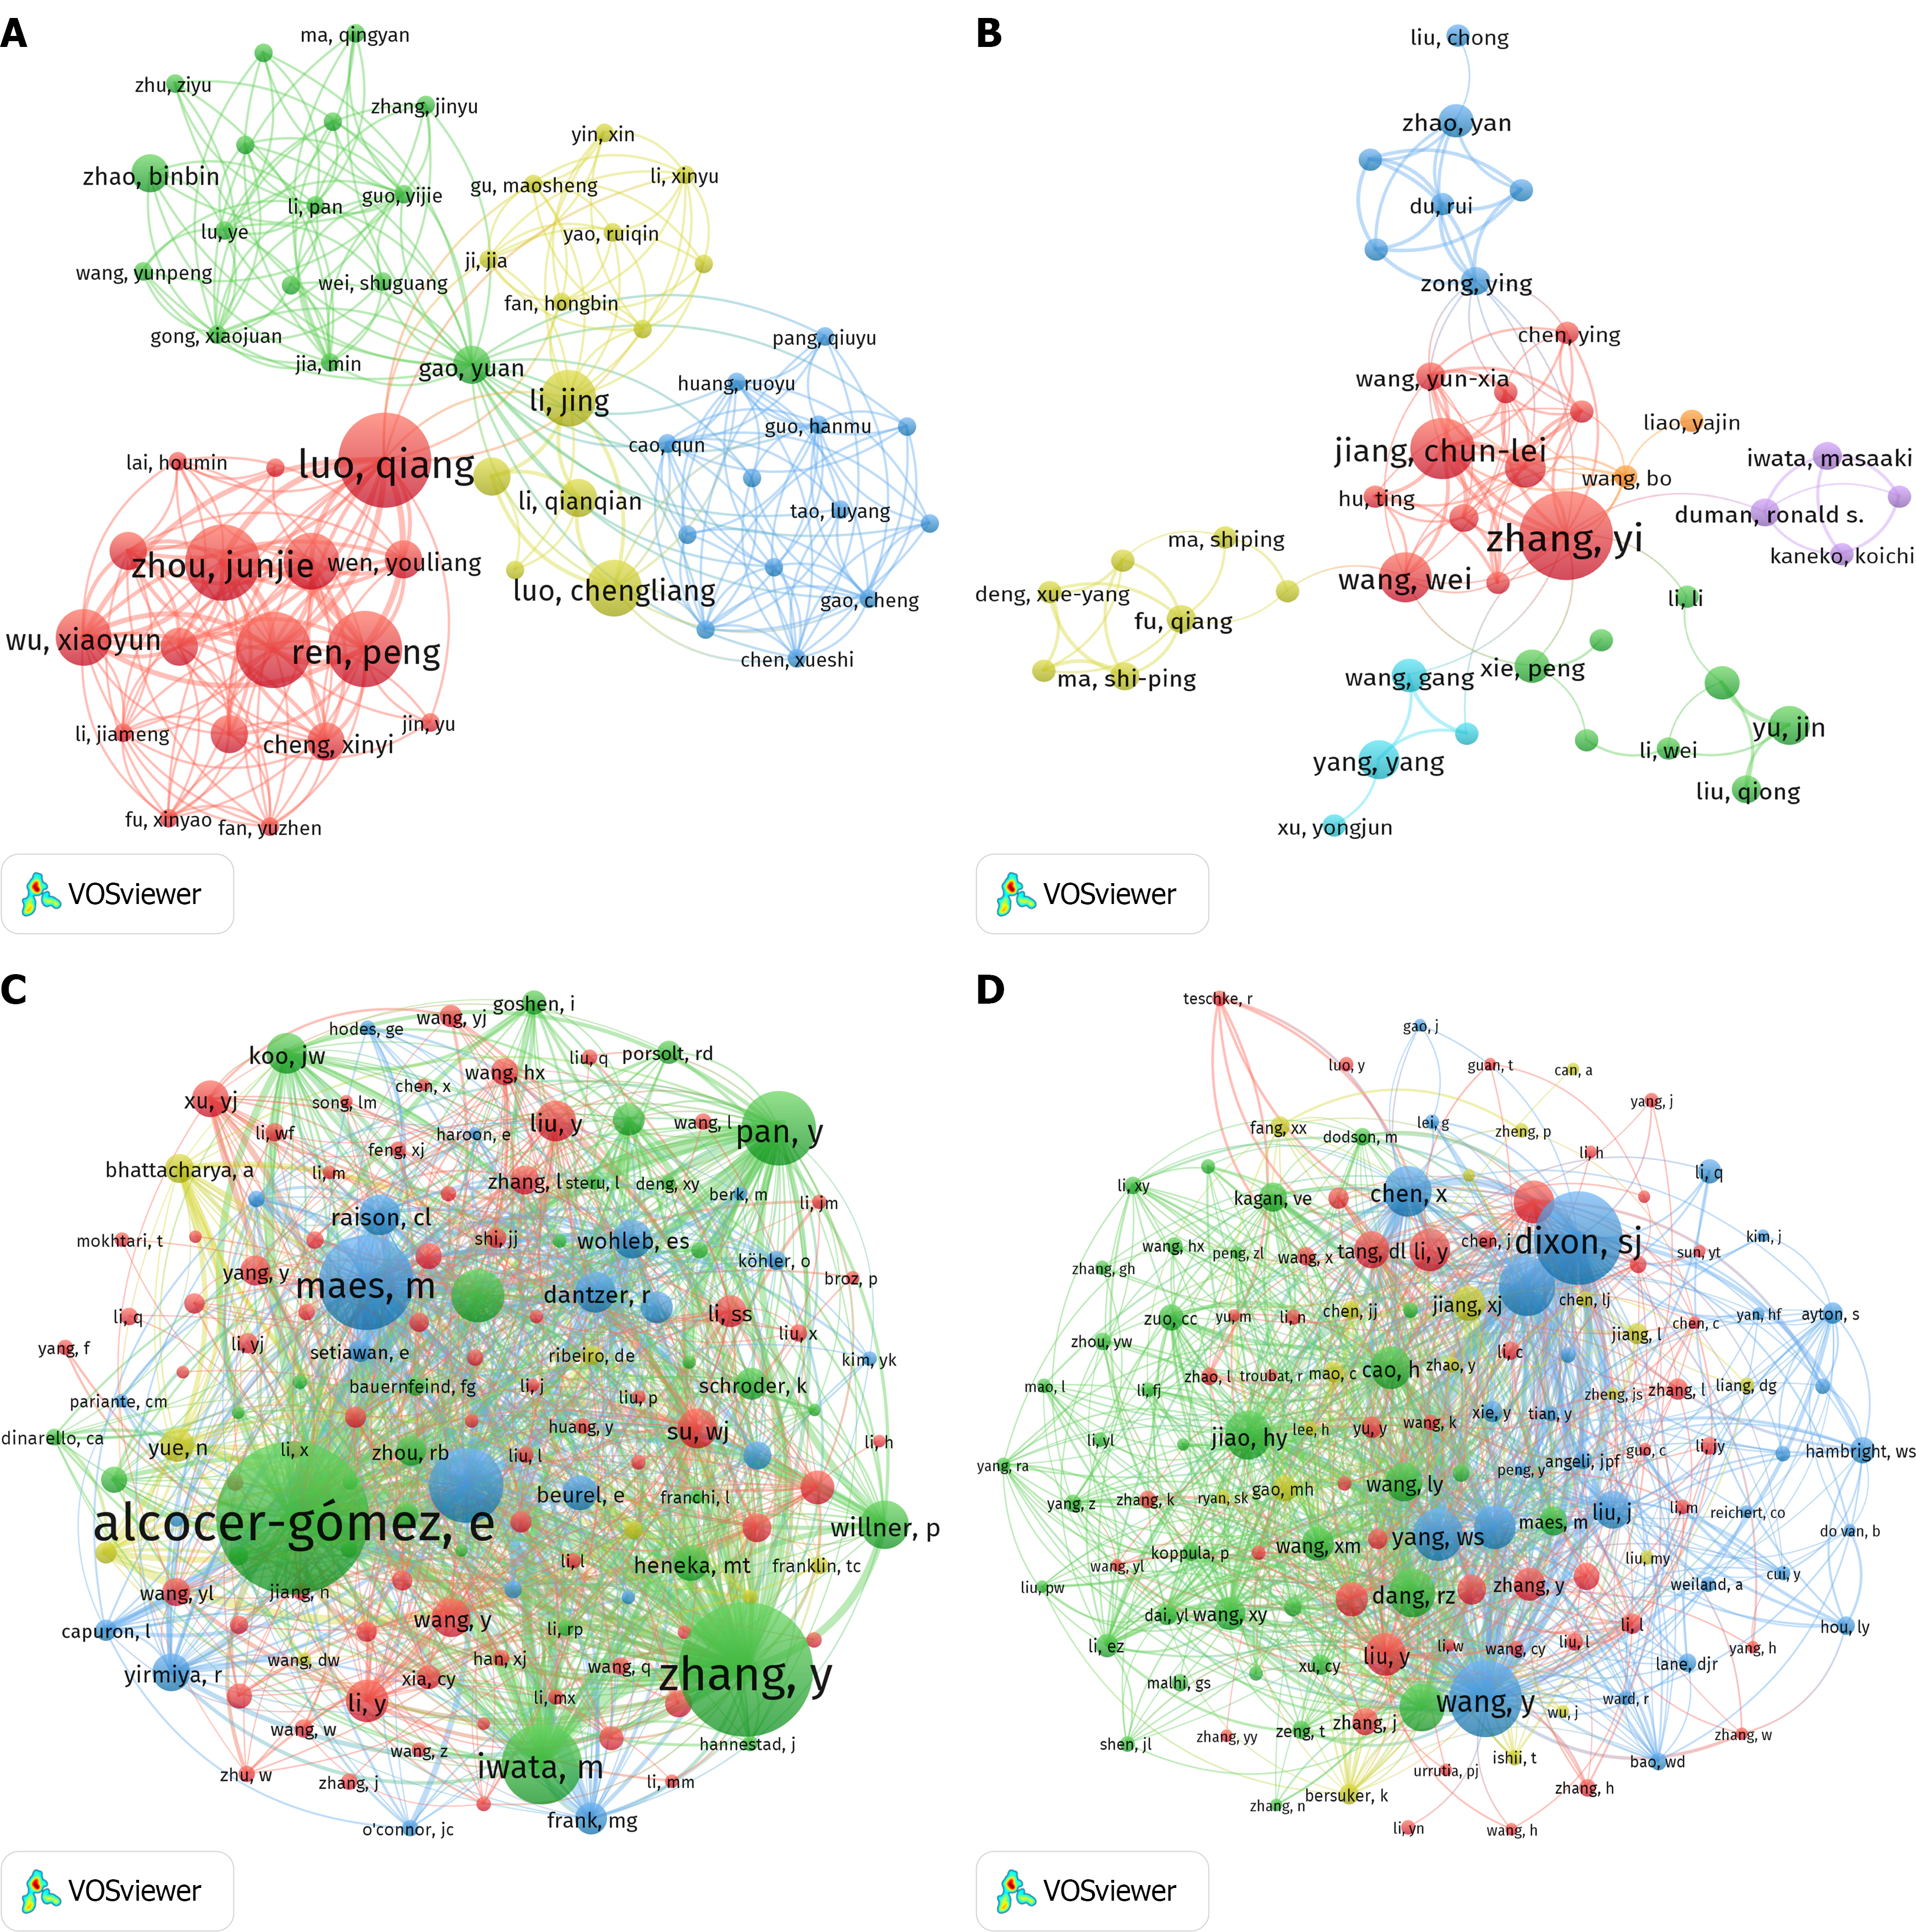
Figure 5 Co-authorship and co-cited-author networks in ferroptosis- and pyroptosis-related depression research.
A: Co-authorship network in ferroptosis-related depression research; B: Co-authorship network in pyroptosis-related depression research; C: Co-cited-author network in ferroptosis-related depression research; D: Co-cited-author network in pyroptosis-related depression research. In all panels, each node represents an author, and the node size is proportional to the number of publications in panels A and B or the number of co-citations in panels C and D. Links between nodes represent co-authorship relationships in panels A and B and co-citation relationships in panels C and D. Different colors indicate different collaboration or co-citation clusters.
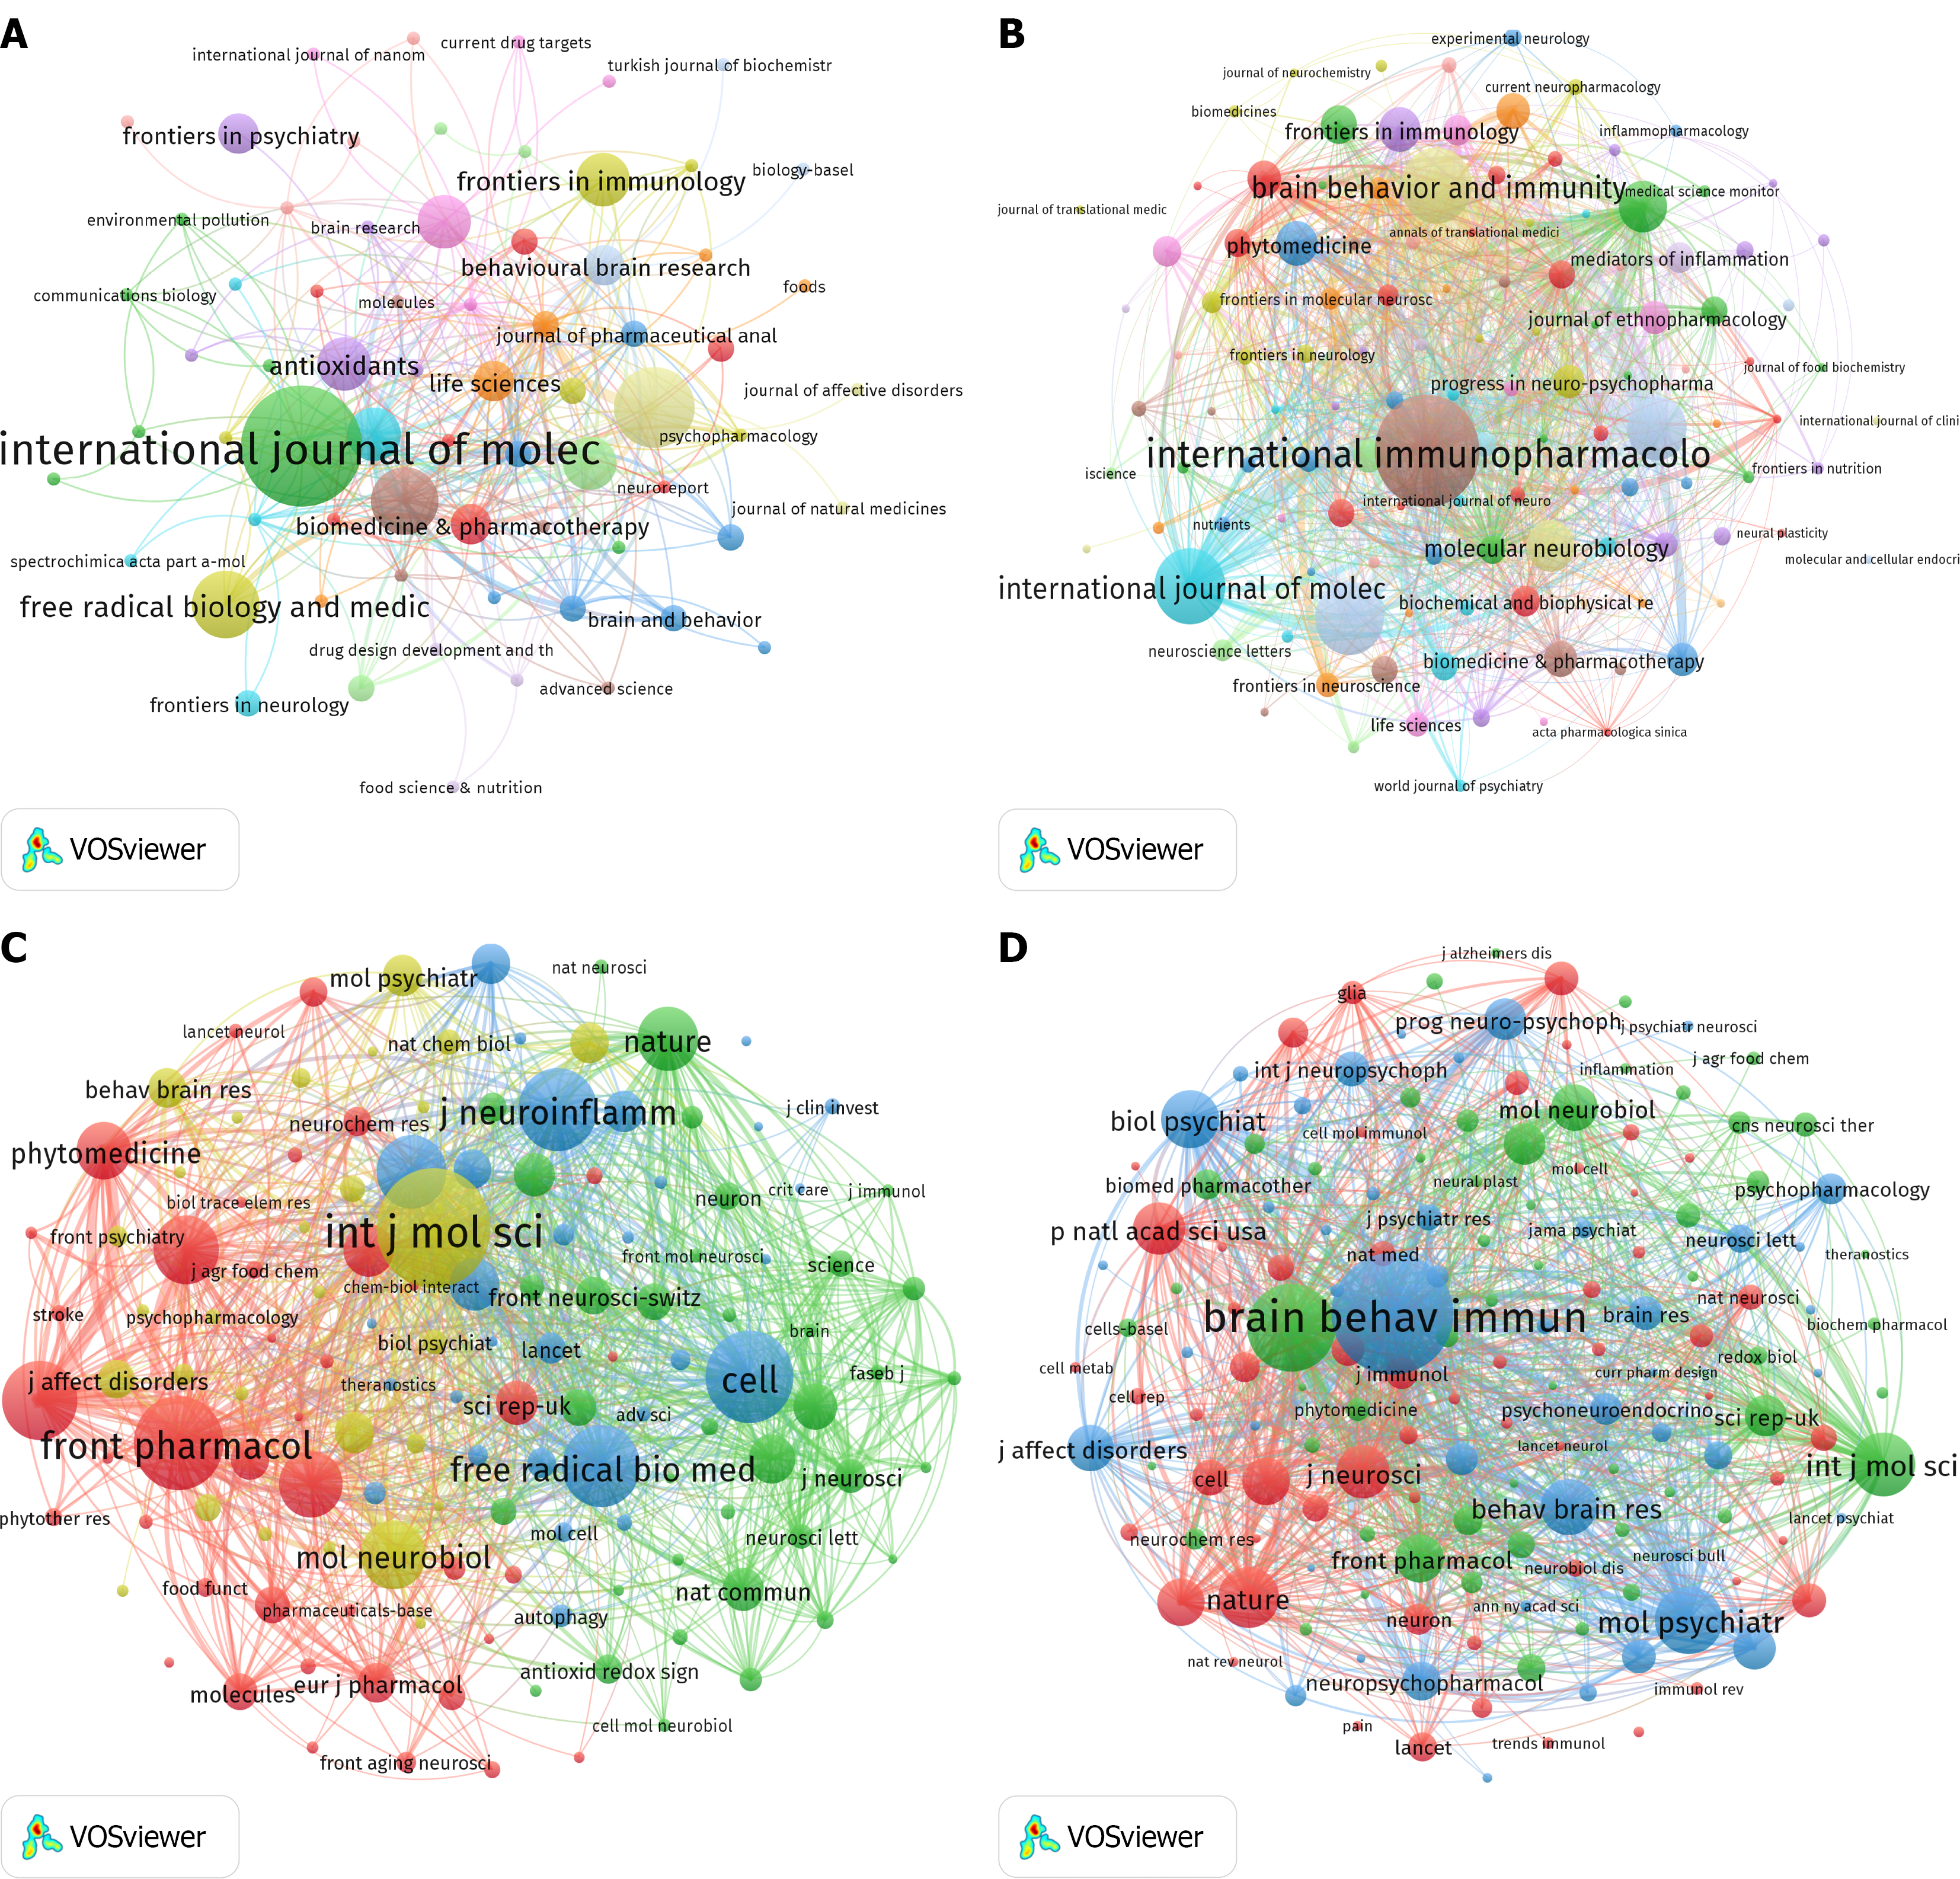
Figure 6 Journal co-occurrence and co-citation networks in ferroptosis- and pyroptosis-related depression research.
A: Journal co-occurrence network of publications on ferroptosis in depression; B: Journal co-occurrence network of publications on pyroptosis in depression; C: Journal co-citation network in ferroptosis-related depression research; D: Journal co-citation network in pyroptosis-related depression research. In panels A and B, each node represents a journal, and the node size is proportional to the number of publications. Links indicate co-occurrence relationships between journals. In panels C and D, each node represents a journal, and the node size is proportional to the number of citations received from the analyzed publications. Links indicate co-citation relationships between journals. Different colors represent distinct journal clusters, and the distance between nodes reflects the strength of their relatedness.
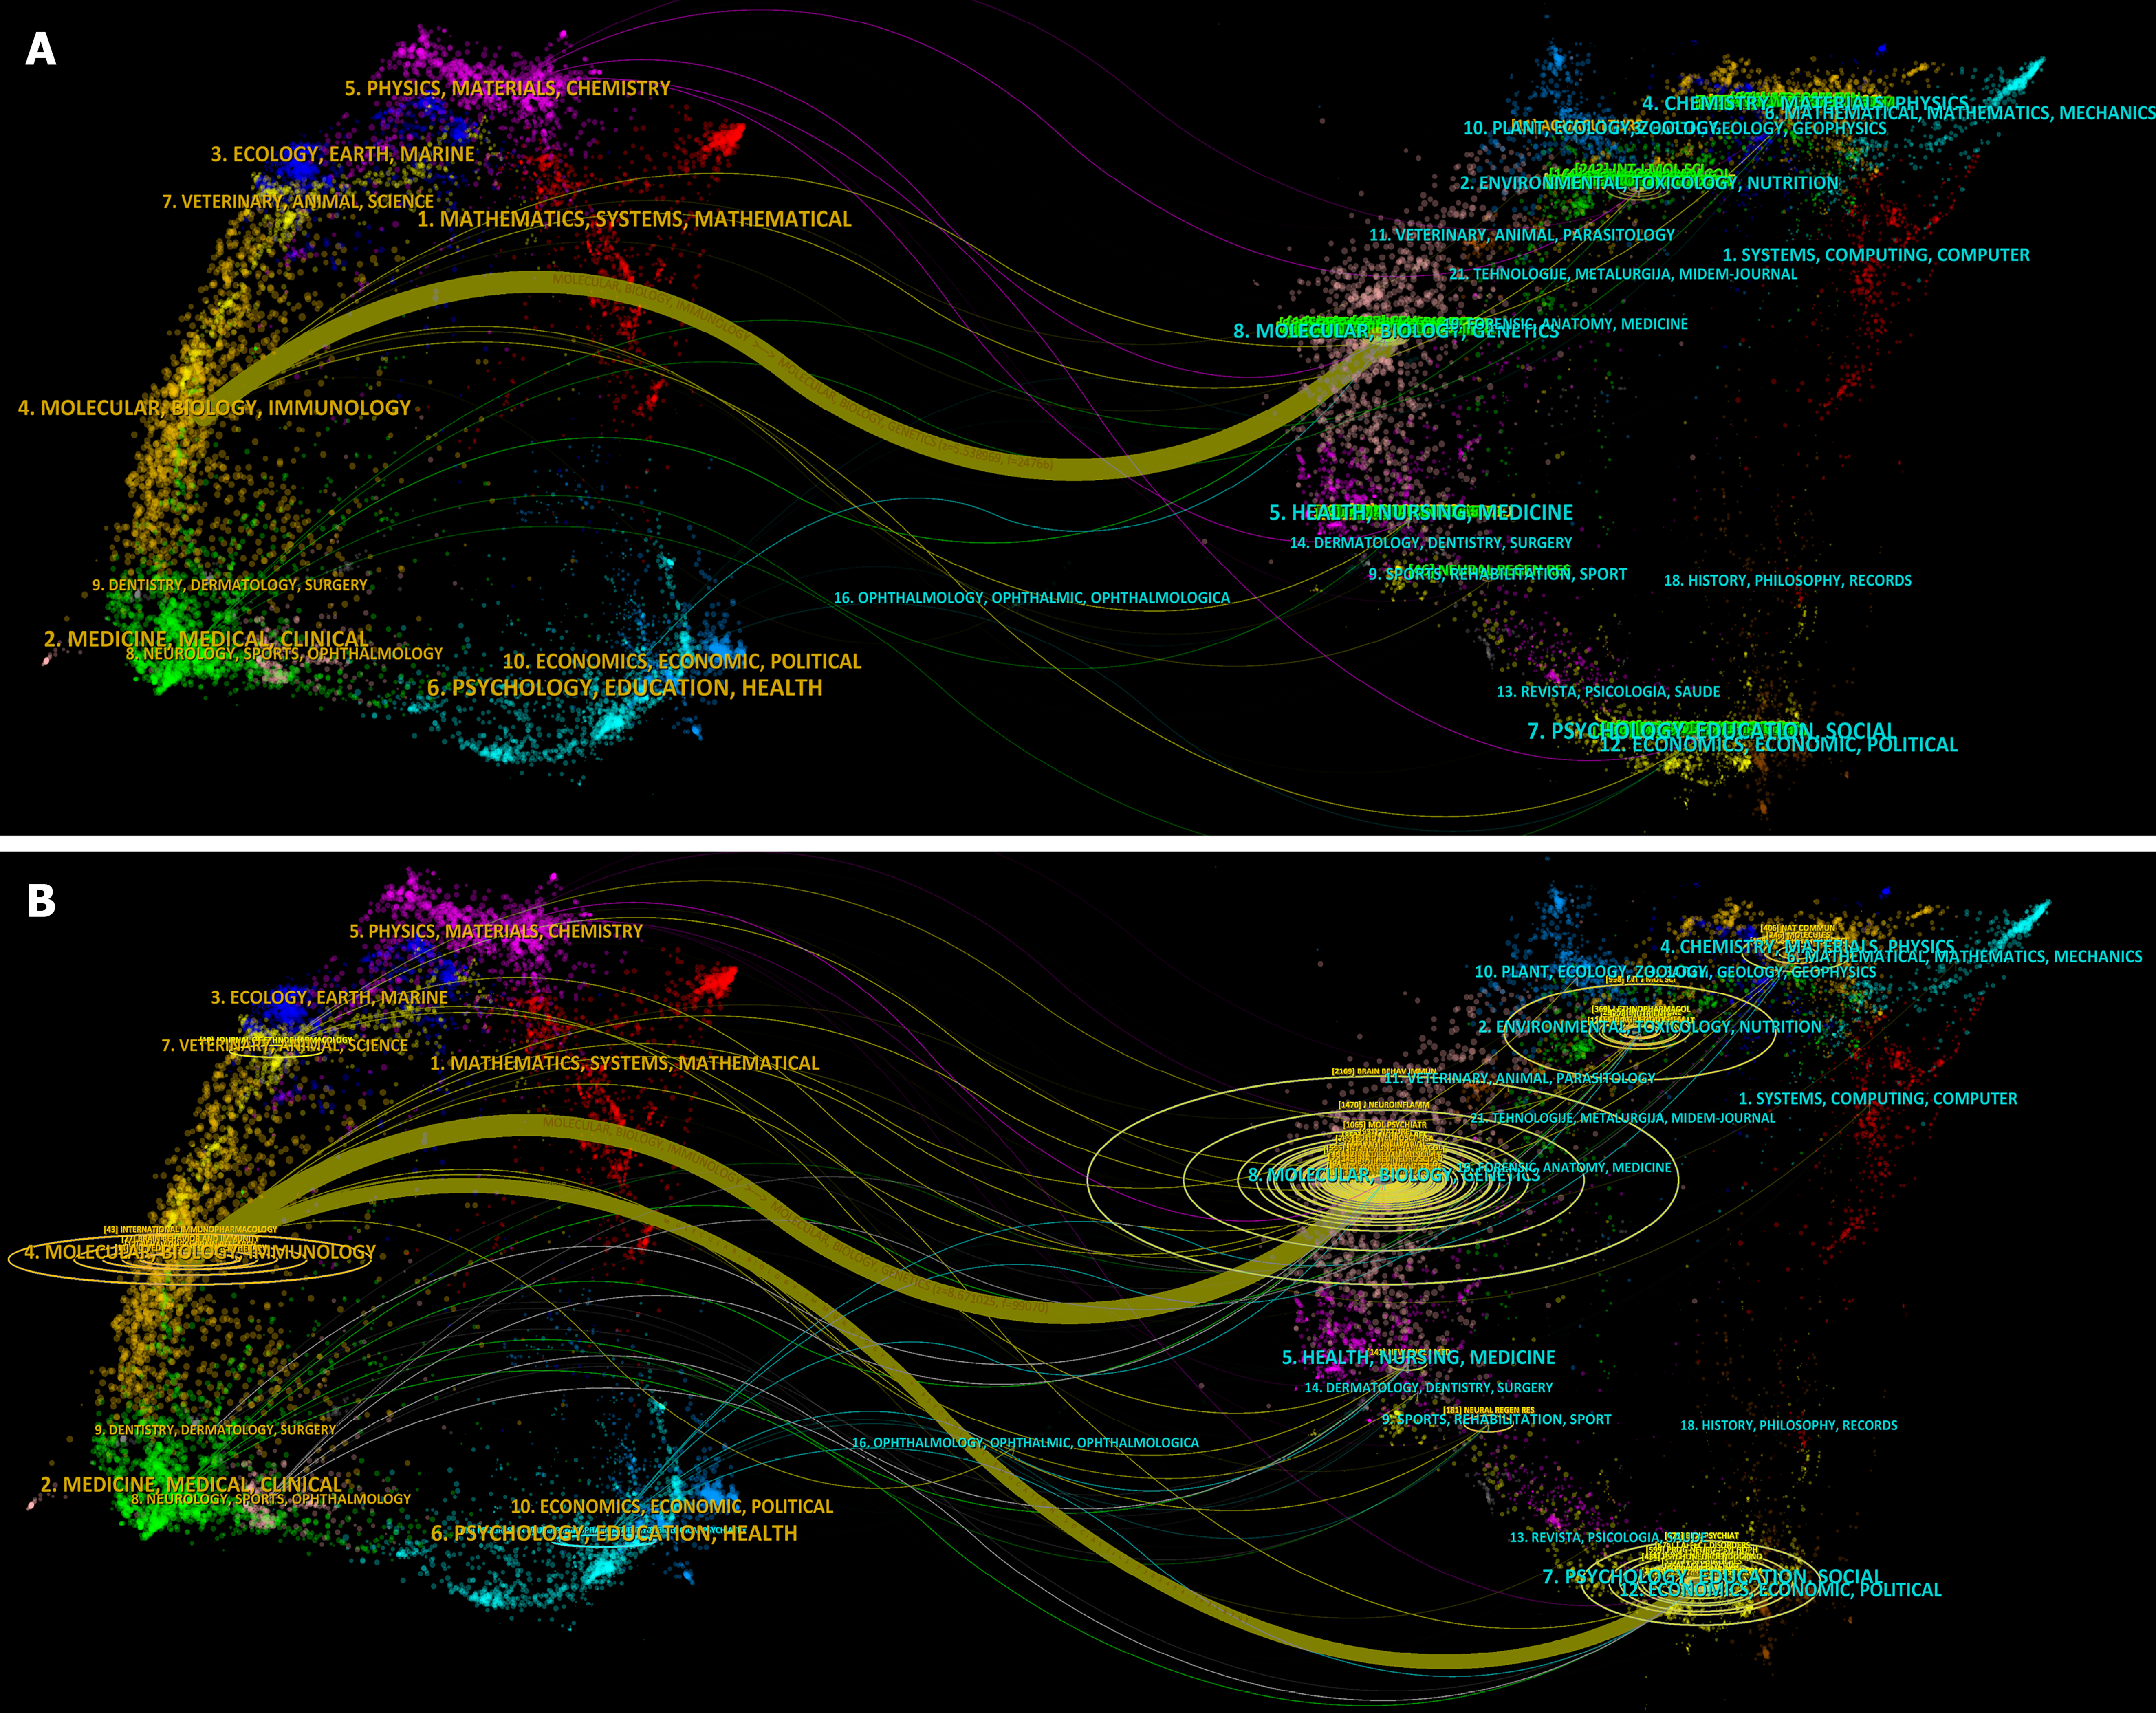
Figure 7 Dual-map overlay of journals in ferroptosis- and pyroptosis-related depression research.
A: Dual-map overlay of journals in ferroptosis-related depression research; B: Dual-map overlay of journals in pyroptosis-related depression research. In each panel, the clusters on the left represent citing journals, whereas those on the right represent cited journals. The colored citation paths indicate citation relationships between disciplines, and the width of each path is proportional to citation frequency.
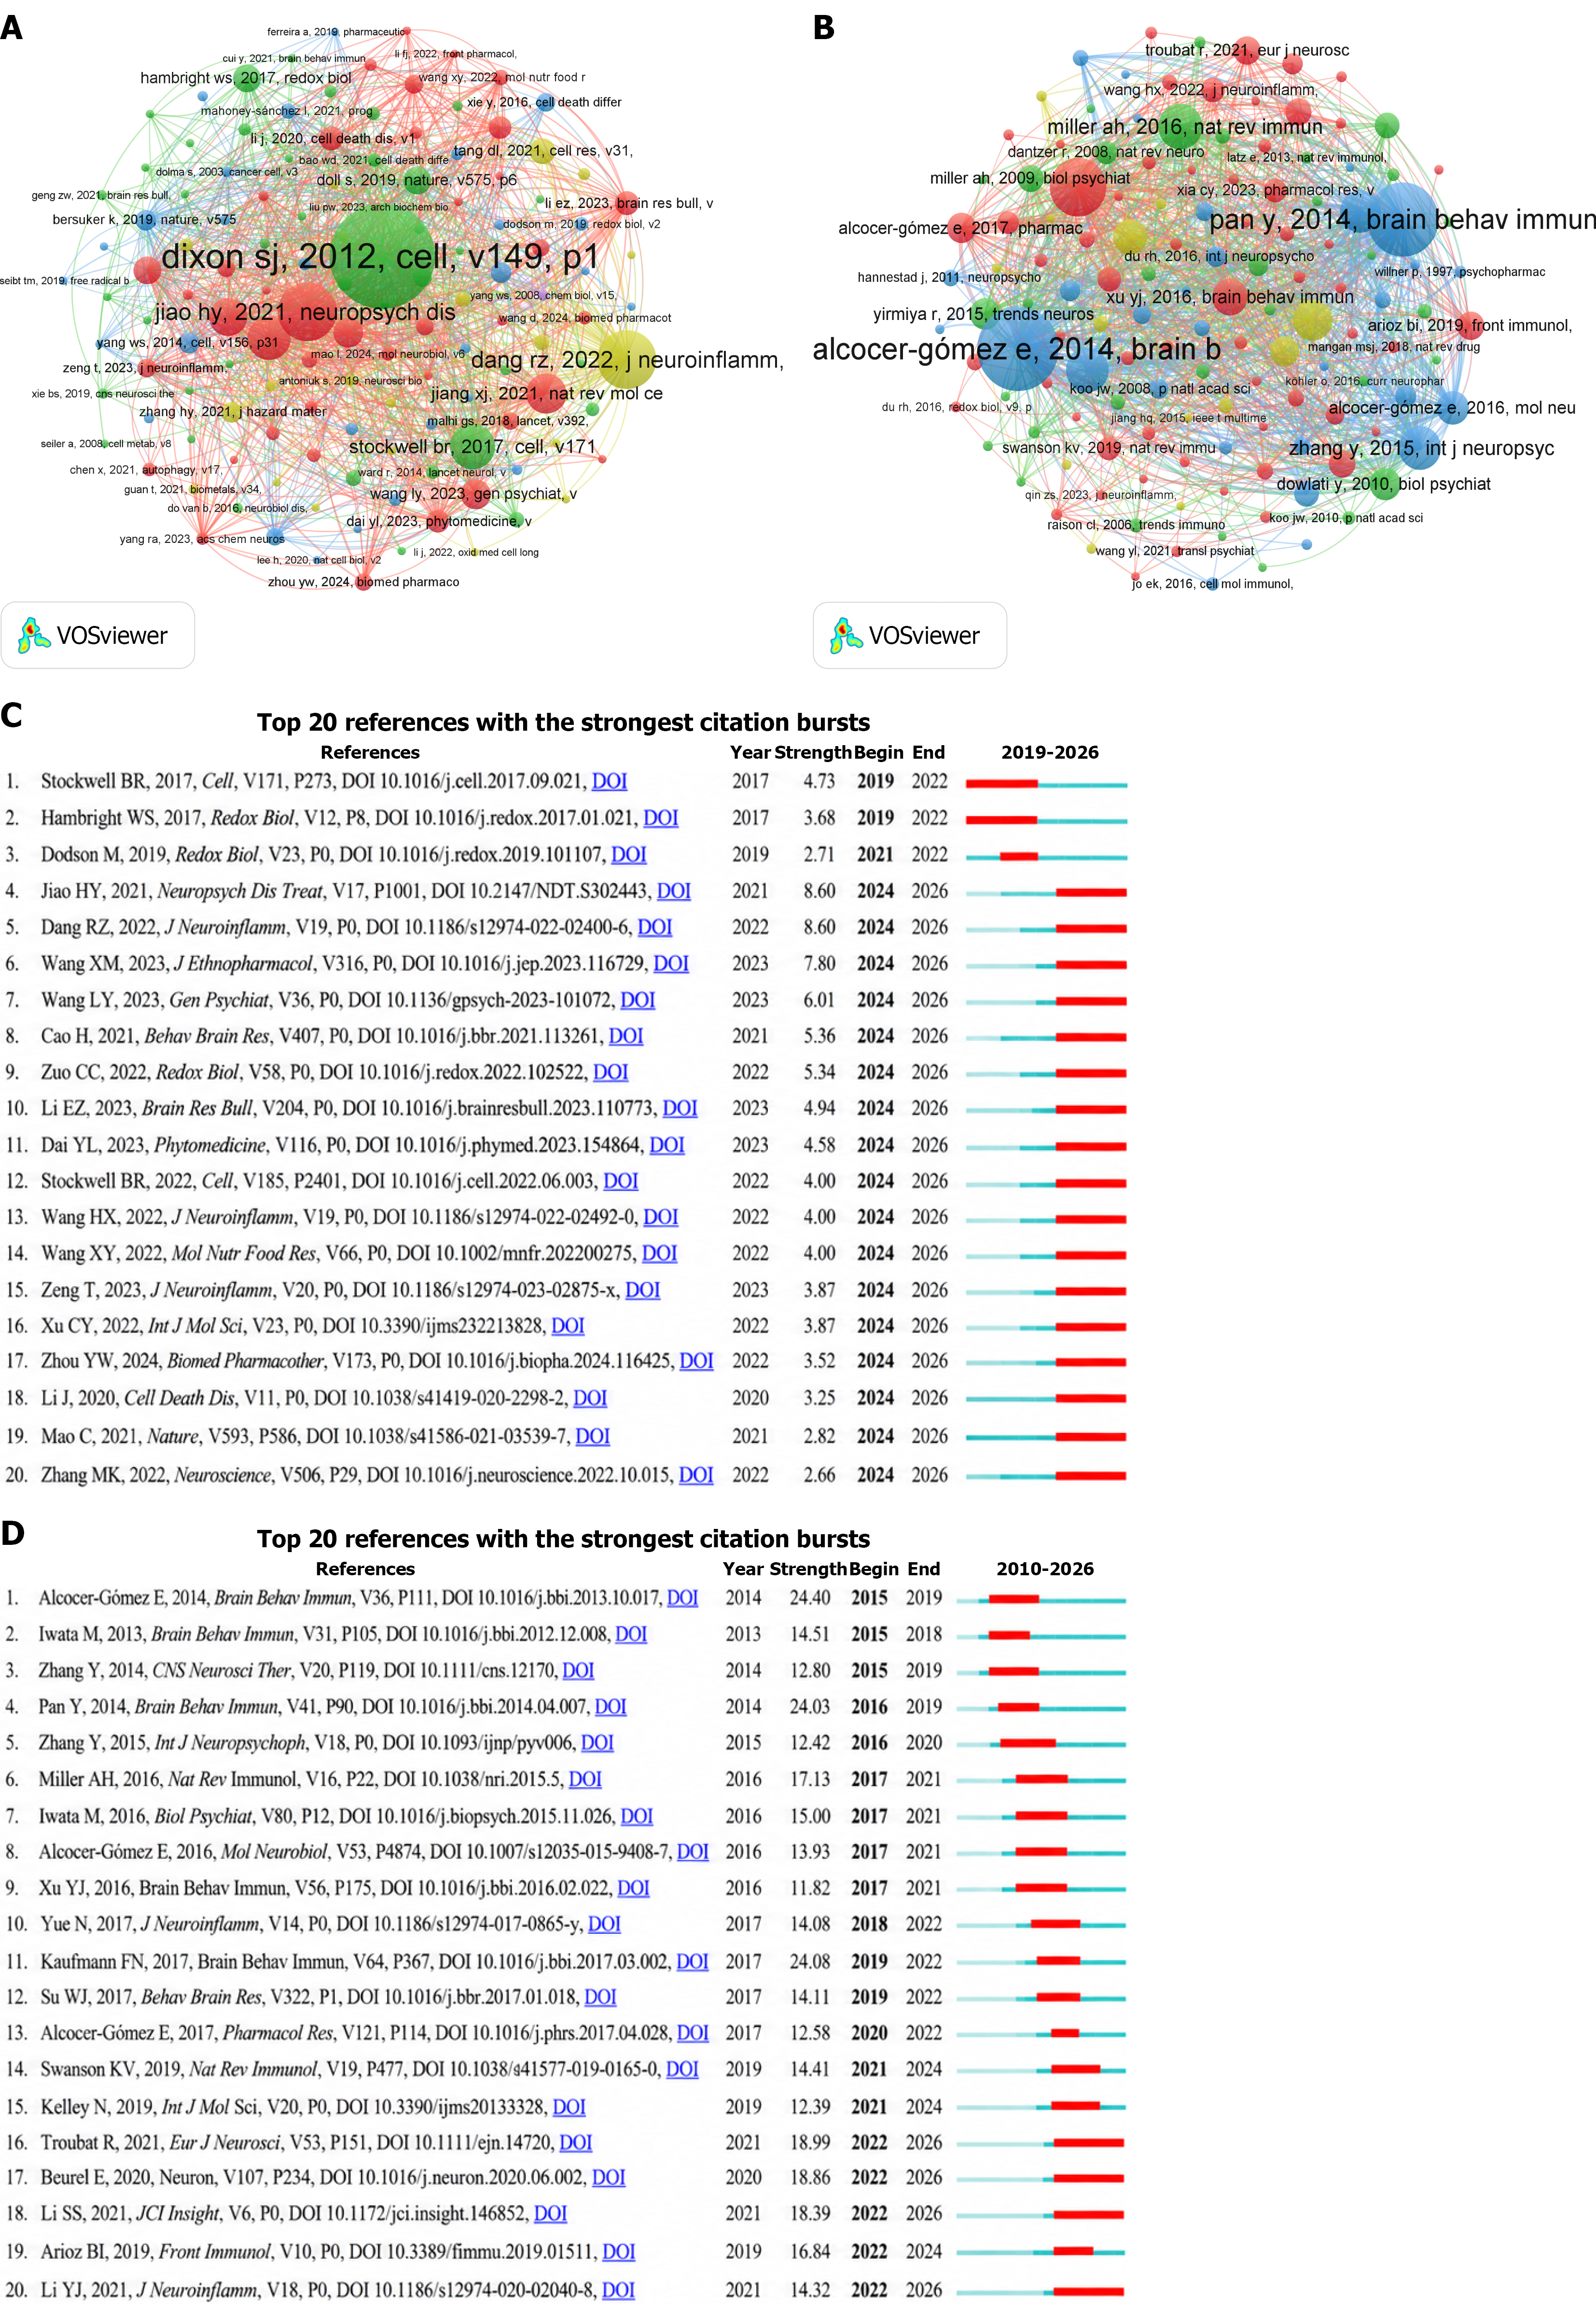
Figure 8 Co-cited-reference networks and references with the strongest citation bursts in ferroptosis- and pyroptosis-related depression research.
A: Co-cited-reference network in ferroptosis-related depression research; B: Co-cited-reference network in pyroptosis-related depression research; C: Top 20 references with the strongest citation bursts in ferroptosis-related depression research; D: Top 20 references with the strongest citation bursts in pyroptosis-related depression research. In panels A and B, each node represents a cited reference, and the node size is proportional to its co-citation frequency. Links between nodes indicate co-citation relationships, and different colors represent distinct co-citation clusters. In panels C and D, the red segments indicate periods during which references experienced citation bursts; the strength and duration of each burst are shown.
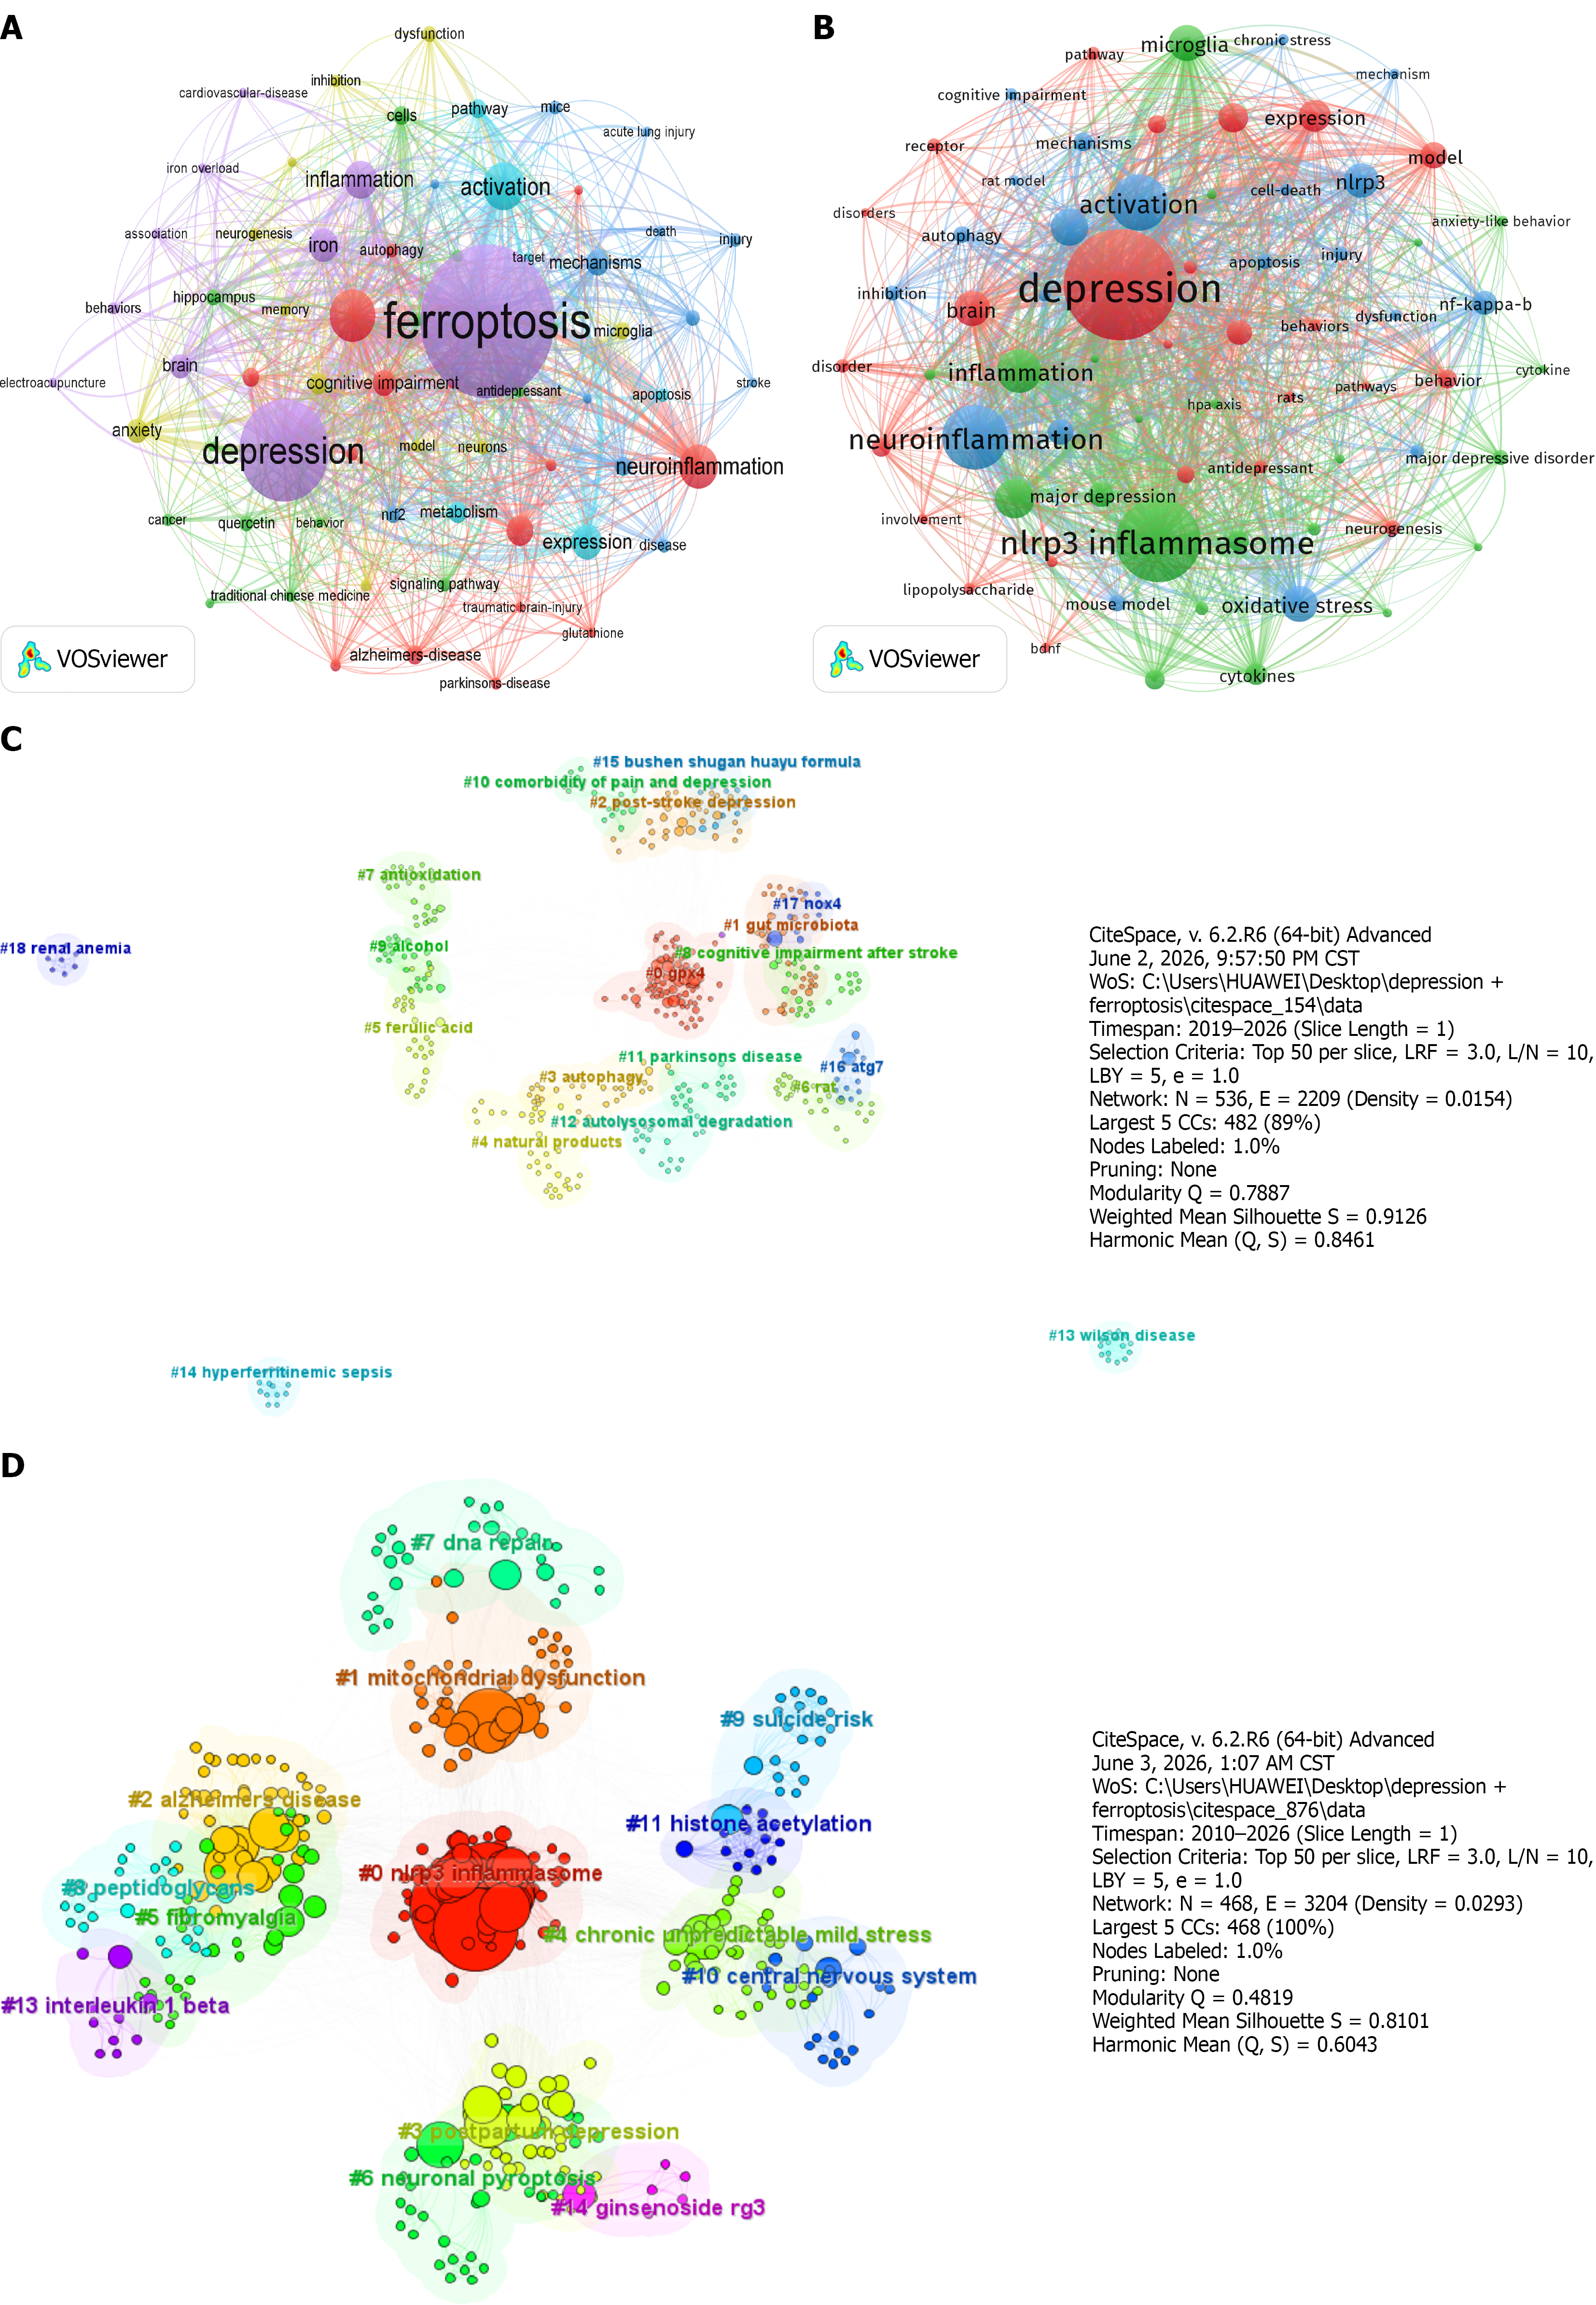
Figure 9 Keyword co-occurrence networks and keyword-cluster analyses in ferroptosis- and pyroptosis-related depression research.
A: Keyword co-occurrence network of ferroptosis-related depression research; B: Keyword co-occurrence network of pyroptosis-related depression research; C: Keyword-cluster analysis of ferroptosis-related depression research; D: Keyword-cluster analysis of pyroptosis-related depression research. In panels A and B, each node represents a keyword, the node size is proportional to keyword frequency, links indicate co-occurrence relationships, and different colors represent distinct keyword clusters. In panels C and D, the labeled clusters represent major thematic groups identified using CiteSpace; different colors and shaded areas indicate distinct clusters.
- Citation: Yasen A, Gan ZD, Huang MP, Zhang XY, Hou RT, Zhen D, Xu GX, Wei CH. Research trends of ferroptosis and pyroptosis in depression: A bibliometric analysis. World J Psychiatry 2026; 16(11): 124306
- URL: https://www.wjgnet.com/2220-3206/full/v16/i11/124306.htm
- DOI: https://dx.doi.org/10.5498/wjp.124306