Copyright
©The Author(s) 2025.
World J Psychiatry. Aug 19, 2025; 15(8): 109280
Published online Aug 19, 2025. doi: 10.5498/wjp.v15.i8.109280
Published online Aug 19, 2025. doi: 10.5498/wjp.v15.i8.109280
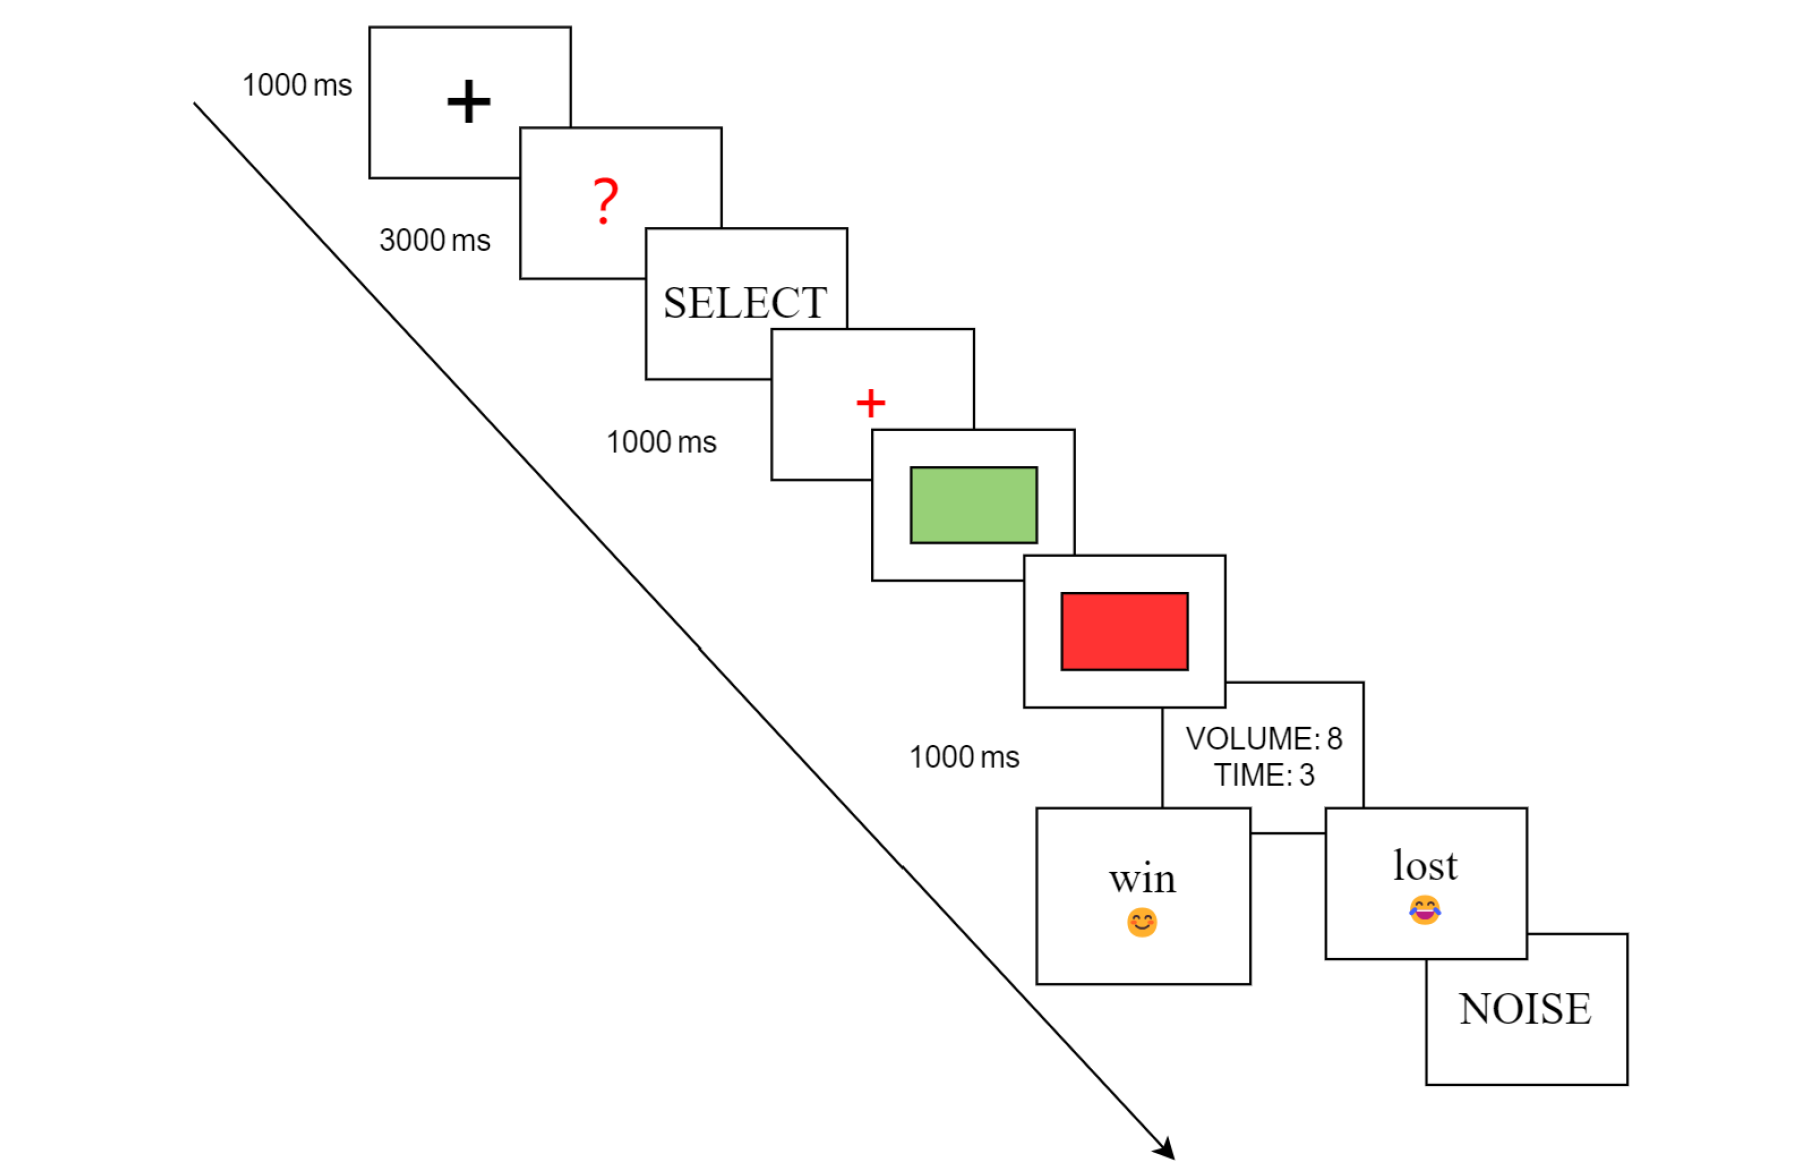
Figure 1 Schematic illustration of the competitive reaction time task.
Participants were instructed to play against the opposing participant who was in another room. The player who responded faster won. Before each trial, both participants and their opponents were provided with the option to select the punishment (volume: 0-85 dB; duration: 0-5 s) that the opponent would receive in case of losing the trial. In the reaction phase, both players were asked to press the space key as quickly as possible when a green rectangle turned to red. The screen showed a smiling face when the participants won, and a crying face when the participants lost and received noise punishment. ms: Milliseconds.
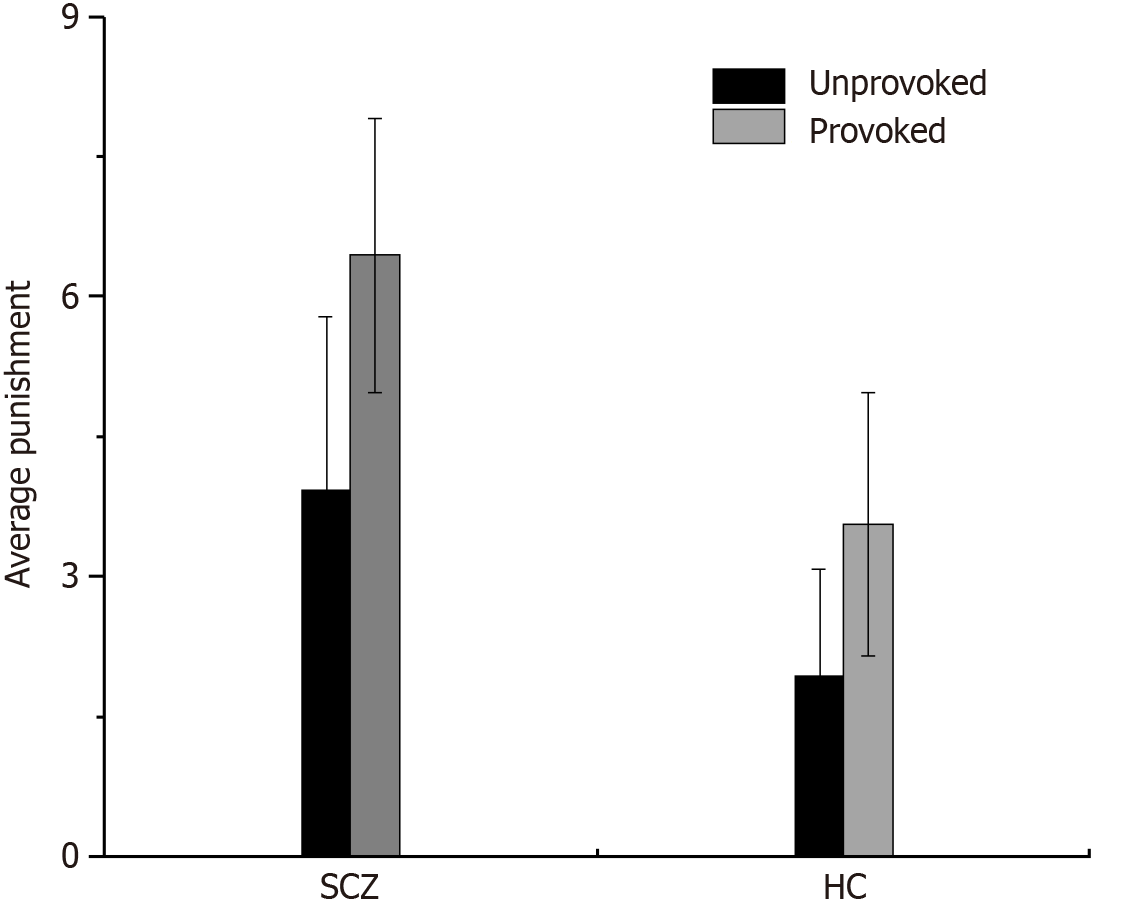
Figure 2 Average punishment selections for healthy control and schizophrenia patient groups under unprovoked and provoked conditions.
SCZ: Schizophrenia; HC: Healthy control.
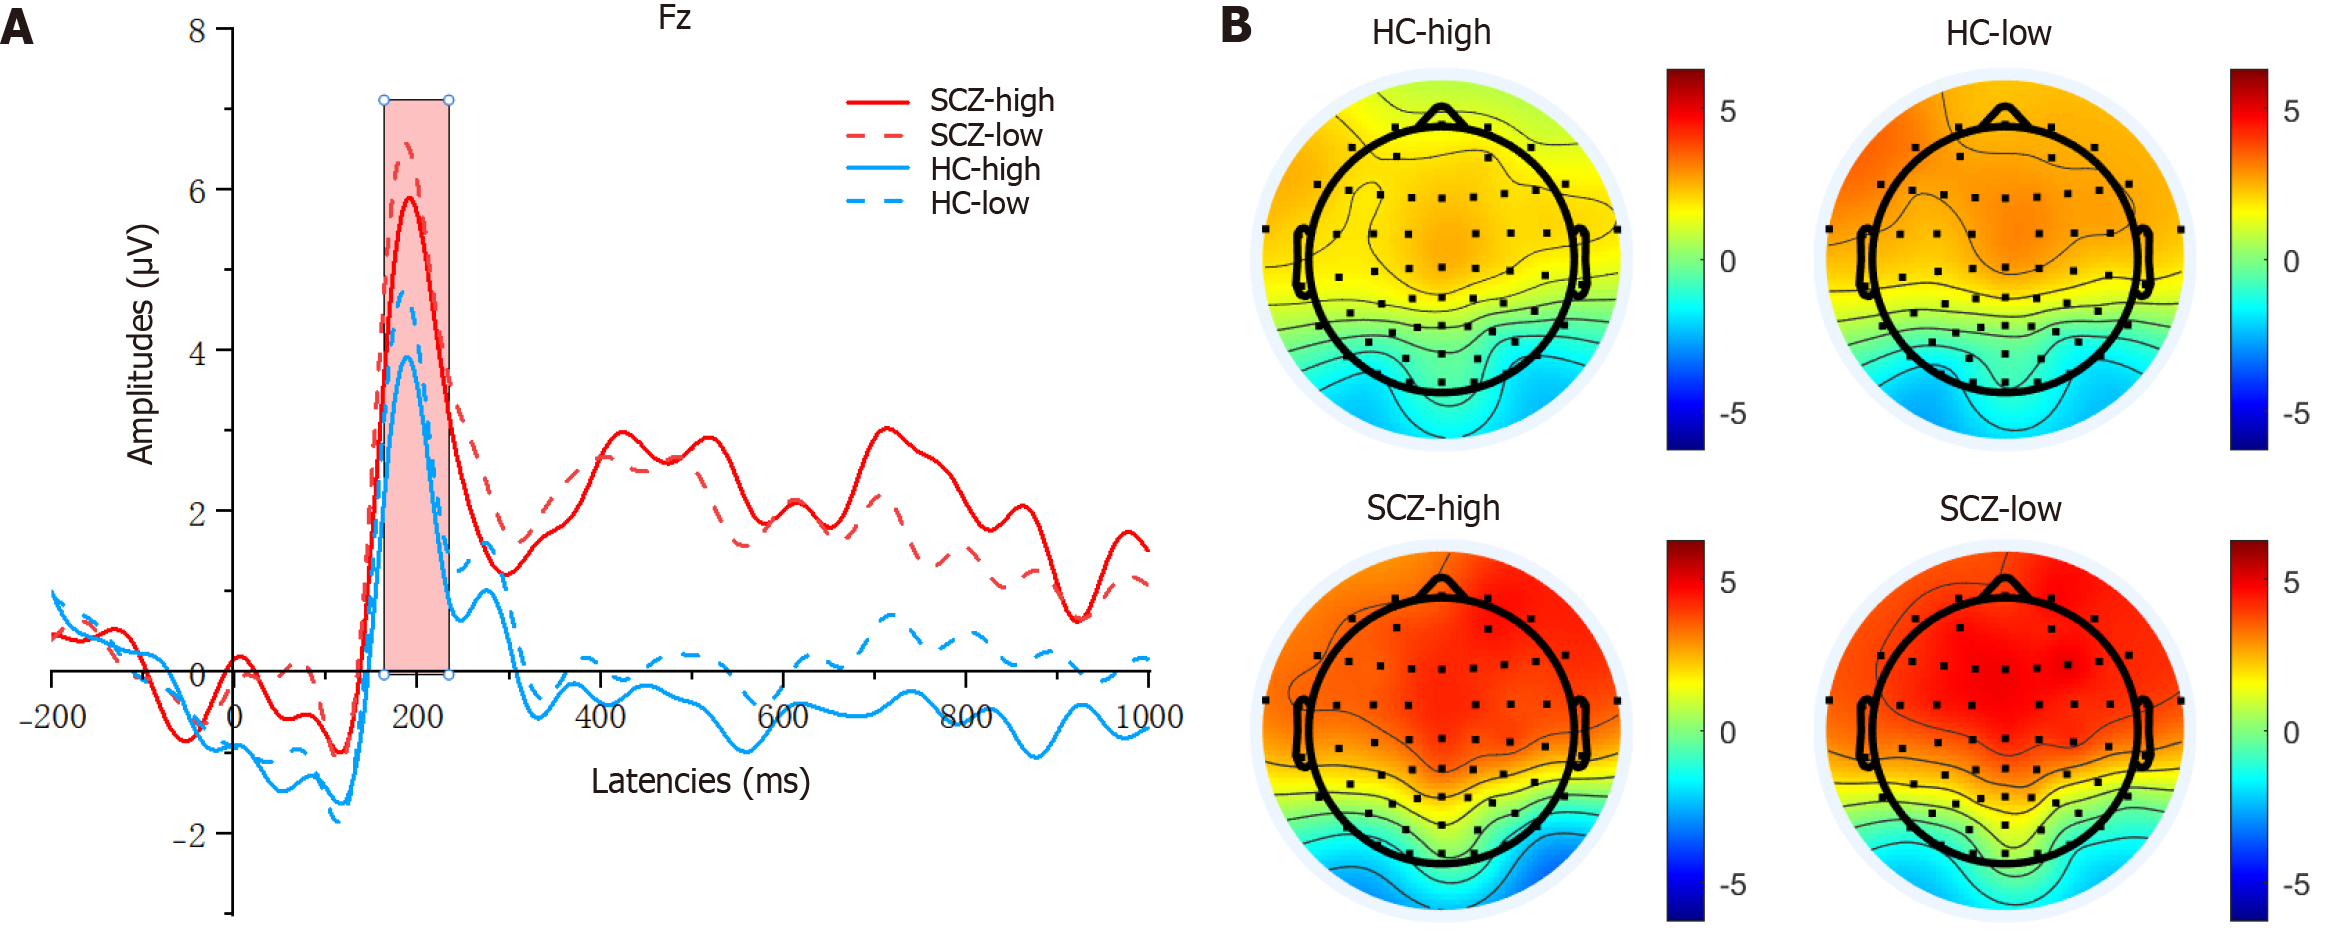
Figure 3 Grand averaged amplitudes and topographical distribution of P2 of both schizophrenia and healthy control groups.
A: Grand average event-related potential waveforms of P2 (time window 150-250 milliseconds) at Fz under different provocative conditions (high vs low); B: Topographic maps of P2 under different provocative conditions (high vs low). HC: Healthy control; SCZ: Schizophrenia; ms: Milliseconds.
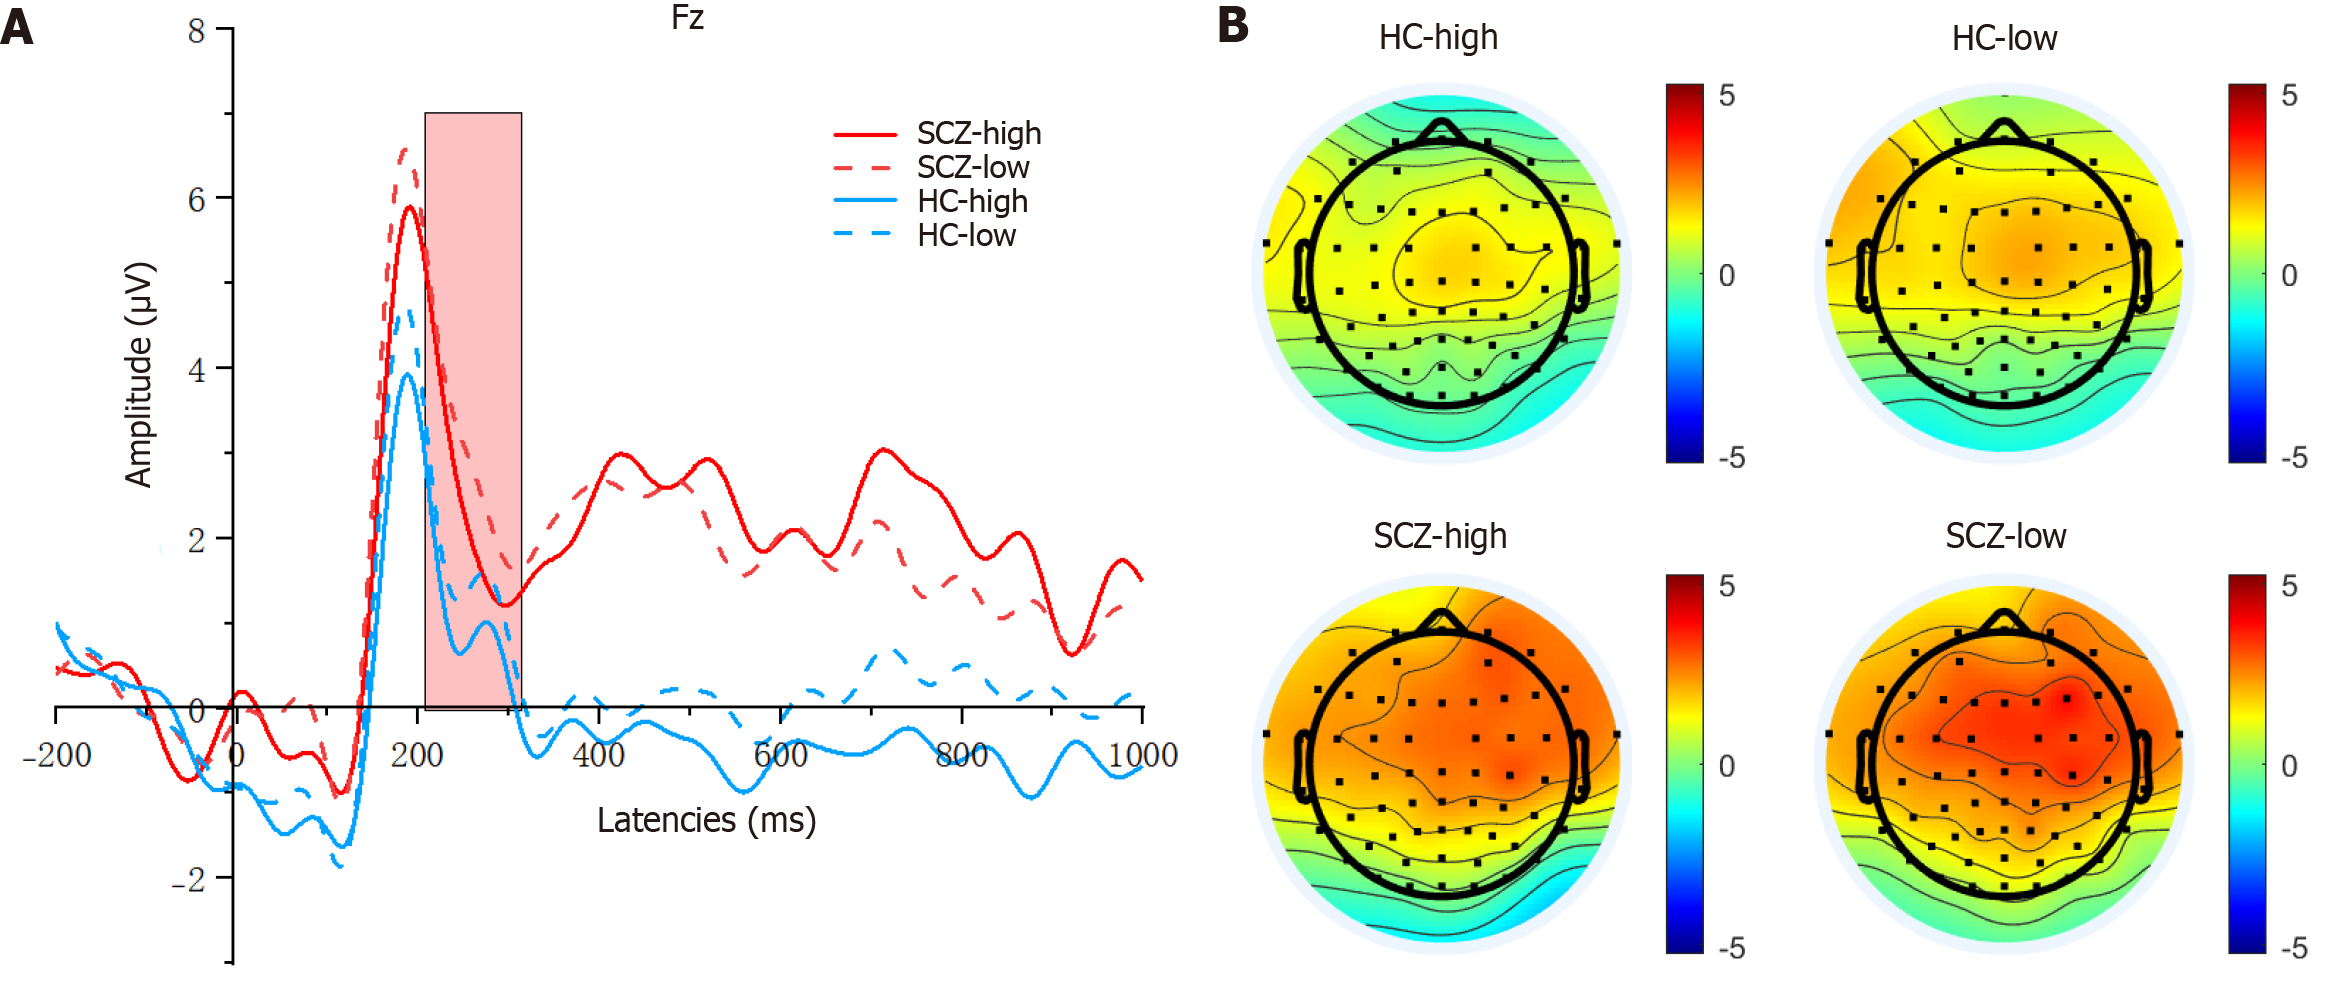
Figure 4 Grand averaged amplitudes and topographical distribution of N2 of both schizophrenia and healthy control groups.
A: Grand average event-related potential waveforms of N2 (time window 200-300 milliseconds) at Fz under different provocative conditions (high vs low); B: Topographic maps of N2 under different provocative conditions (high vs low). HC: Healthy control; SCZ: Schizophrenia; ms: Milliseconds.
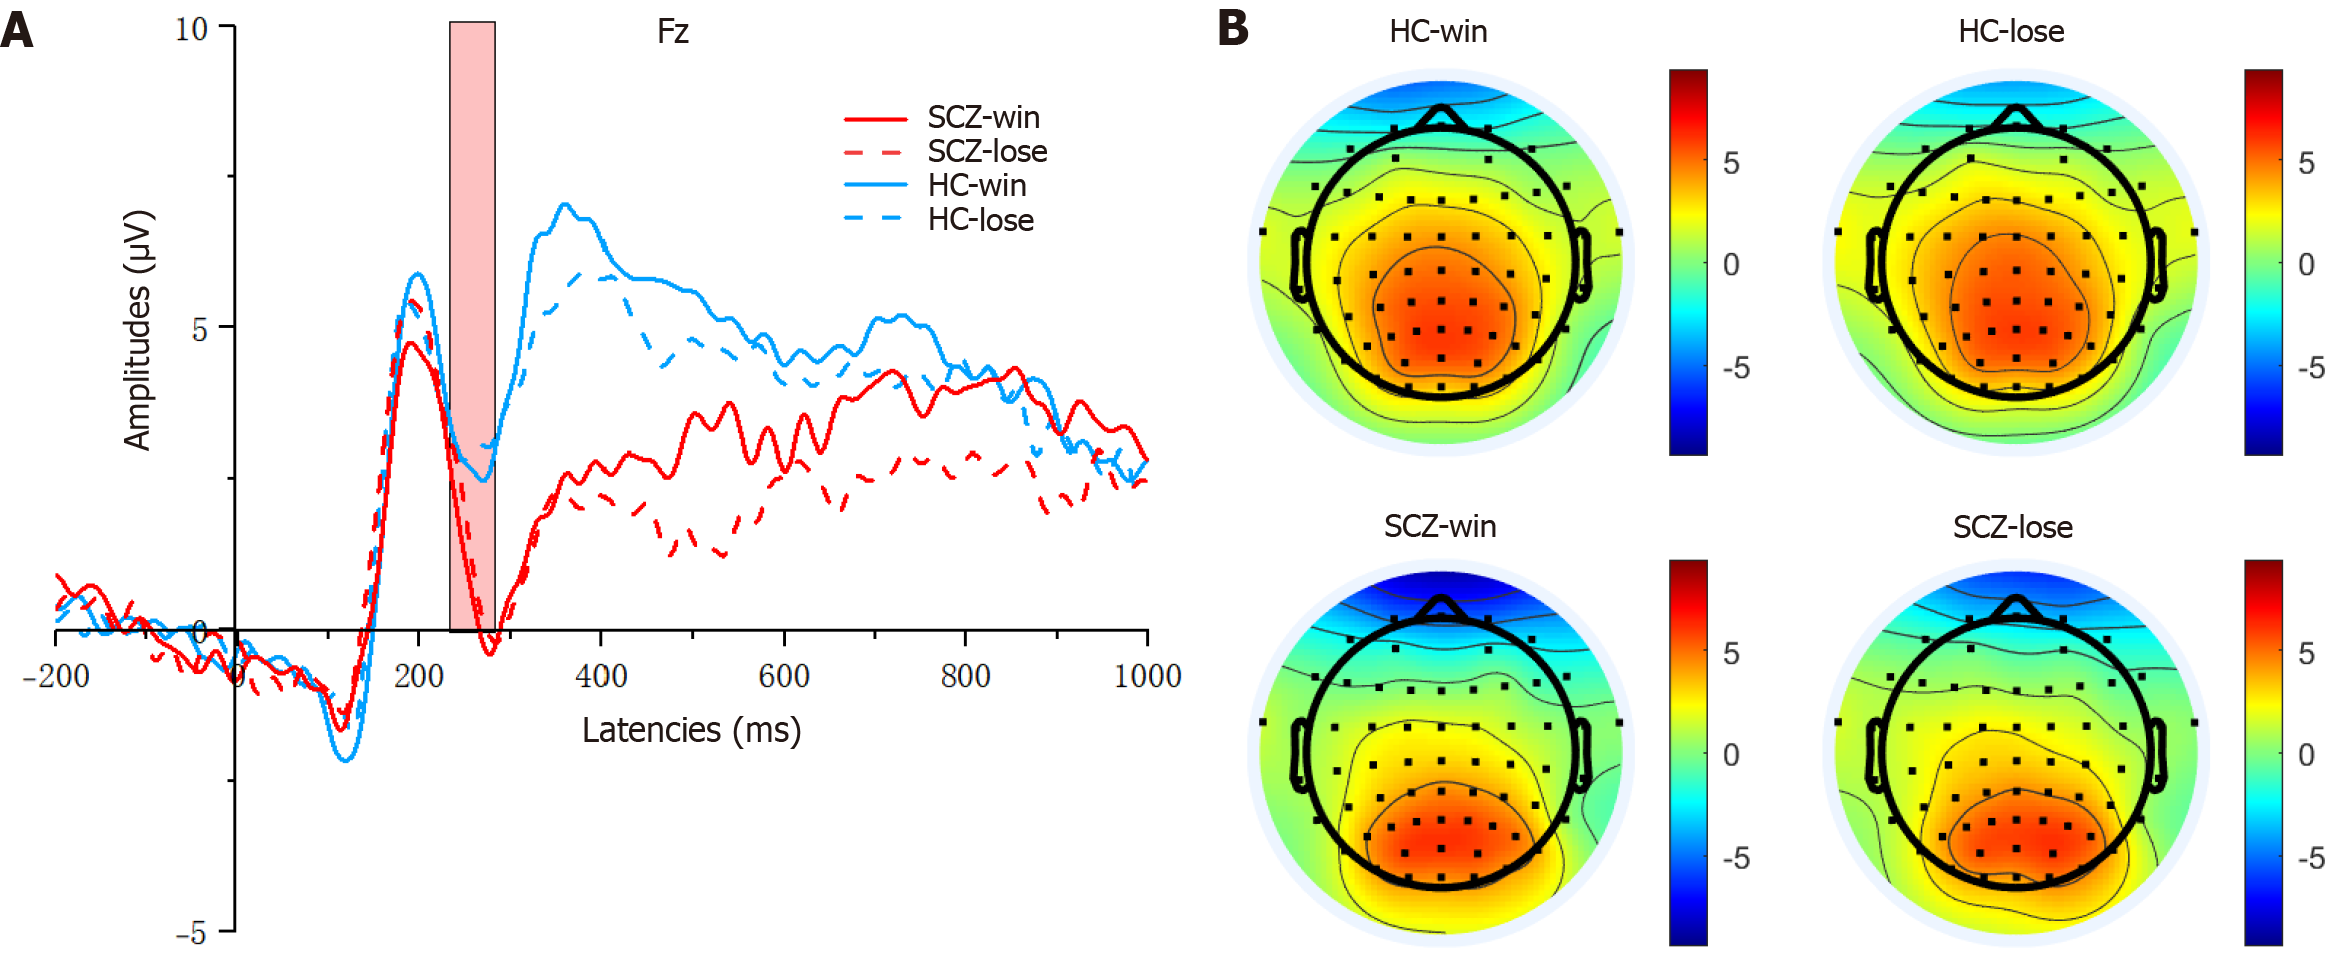
Figure 5 Grand averaged amplitudes and topographical distribution of feedback-related negativity of both schizophrenia and healthy control groups.
A: Grand average event-related potential waveforms of feedback-related negativity (FRN; time window 250-280 milliseconds) at Fz with different outcomes (win vs lose); B: Topographic maps of FRN under different outcomes (win vs lose). HC: Healthy control; SCZ: Schizophrenia; ms: Milliseconds.
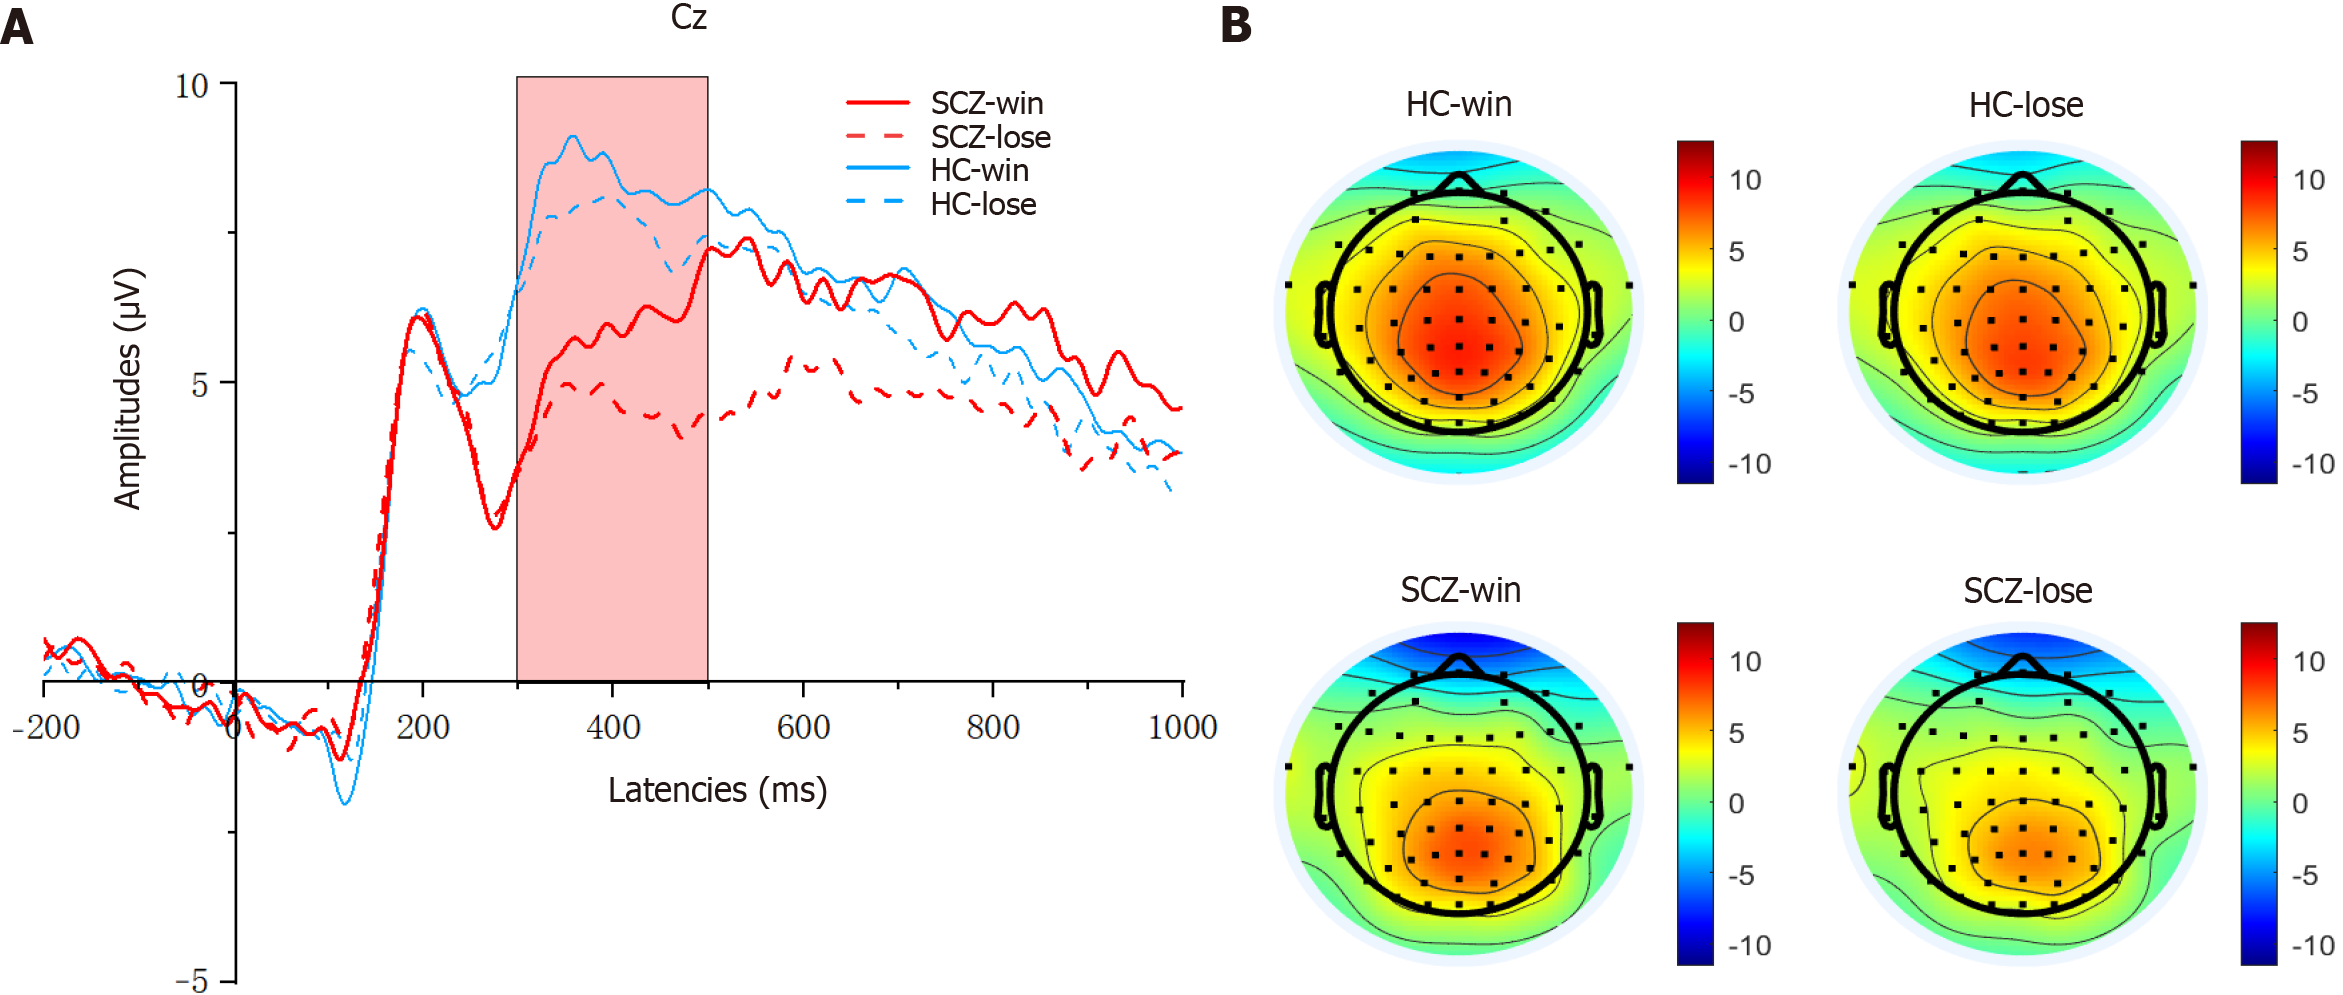
Figure 6 Grand averaged amplitudes and topographical distribution of P3 of both schizophrenia and healthy control groups.
A: Grand average event-related potential waveforms of P3 (time window 300-500 milliseconds) at Cz with different outcomes (win vs lose); B: Topographic maps of P3 under different outcomes (win vs lose). HC: Healthy control; SCZ: Schizophrenia; ms: Milliseconds.
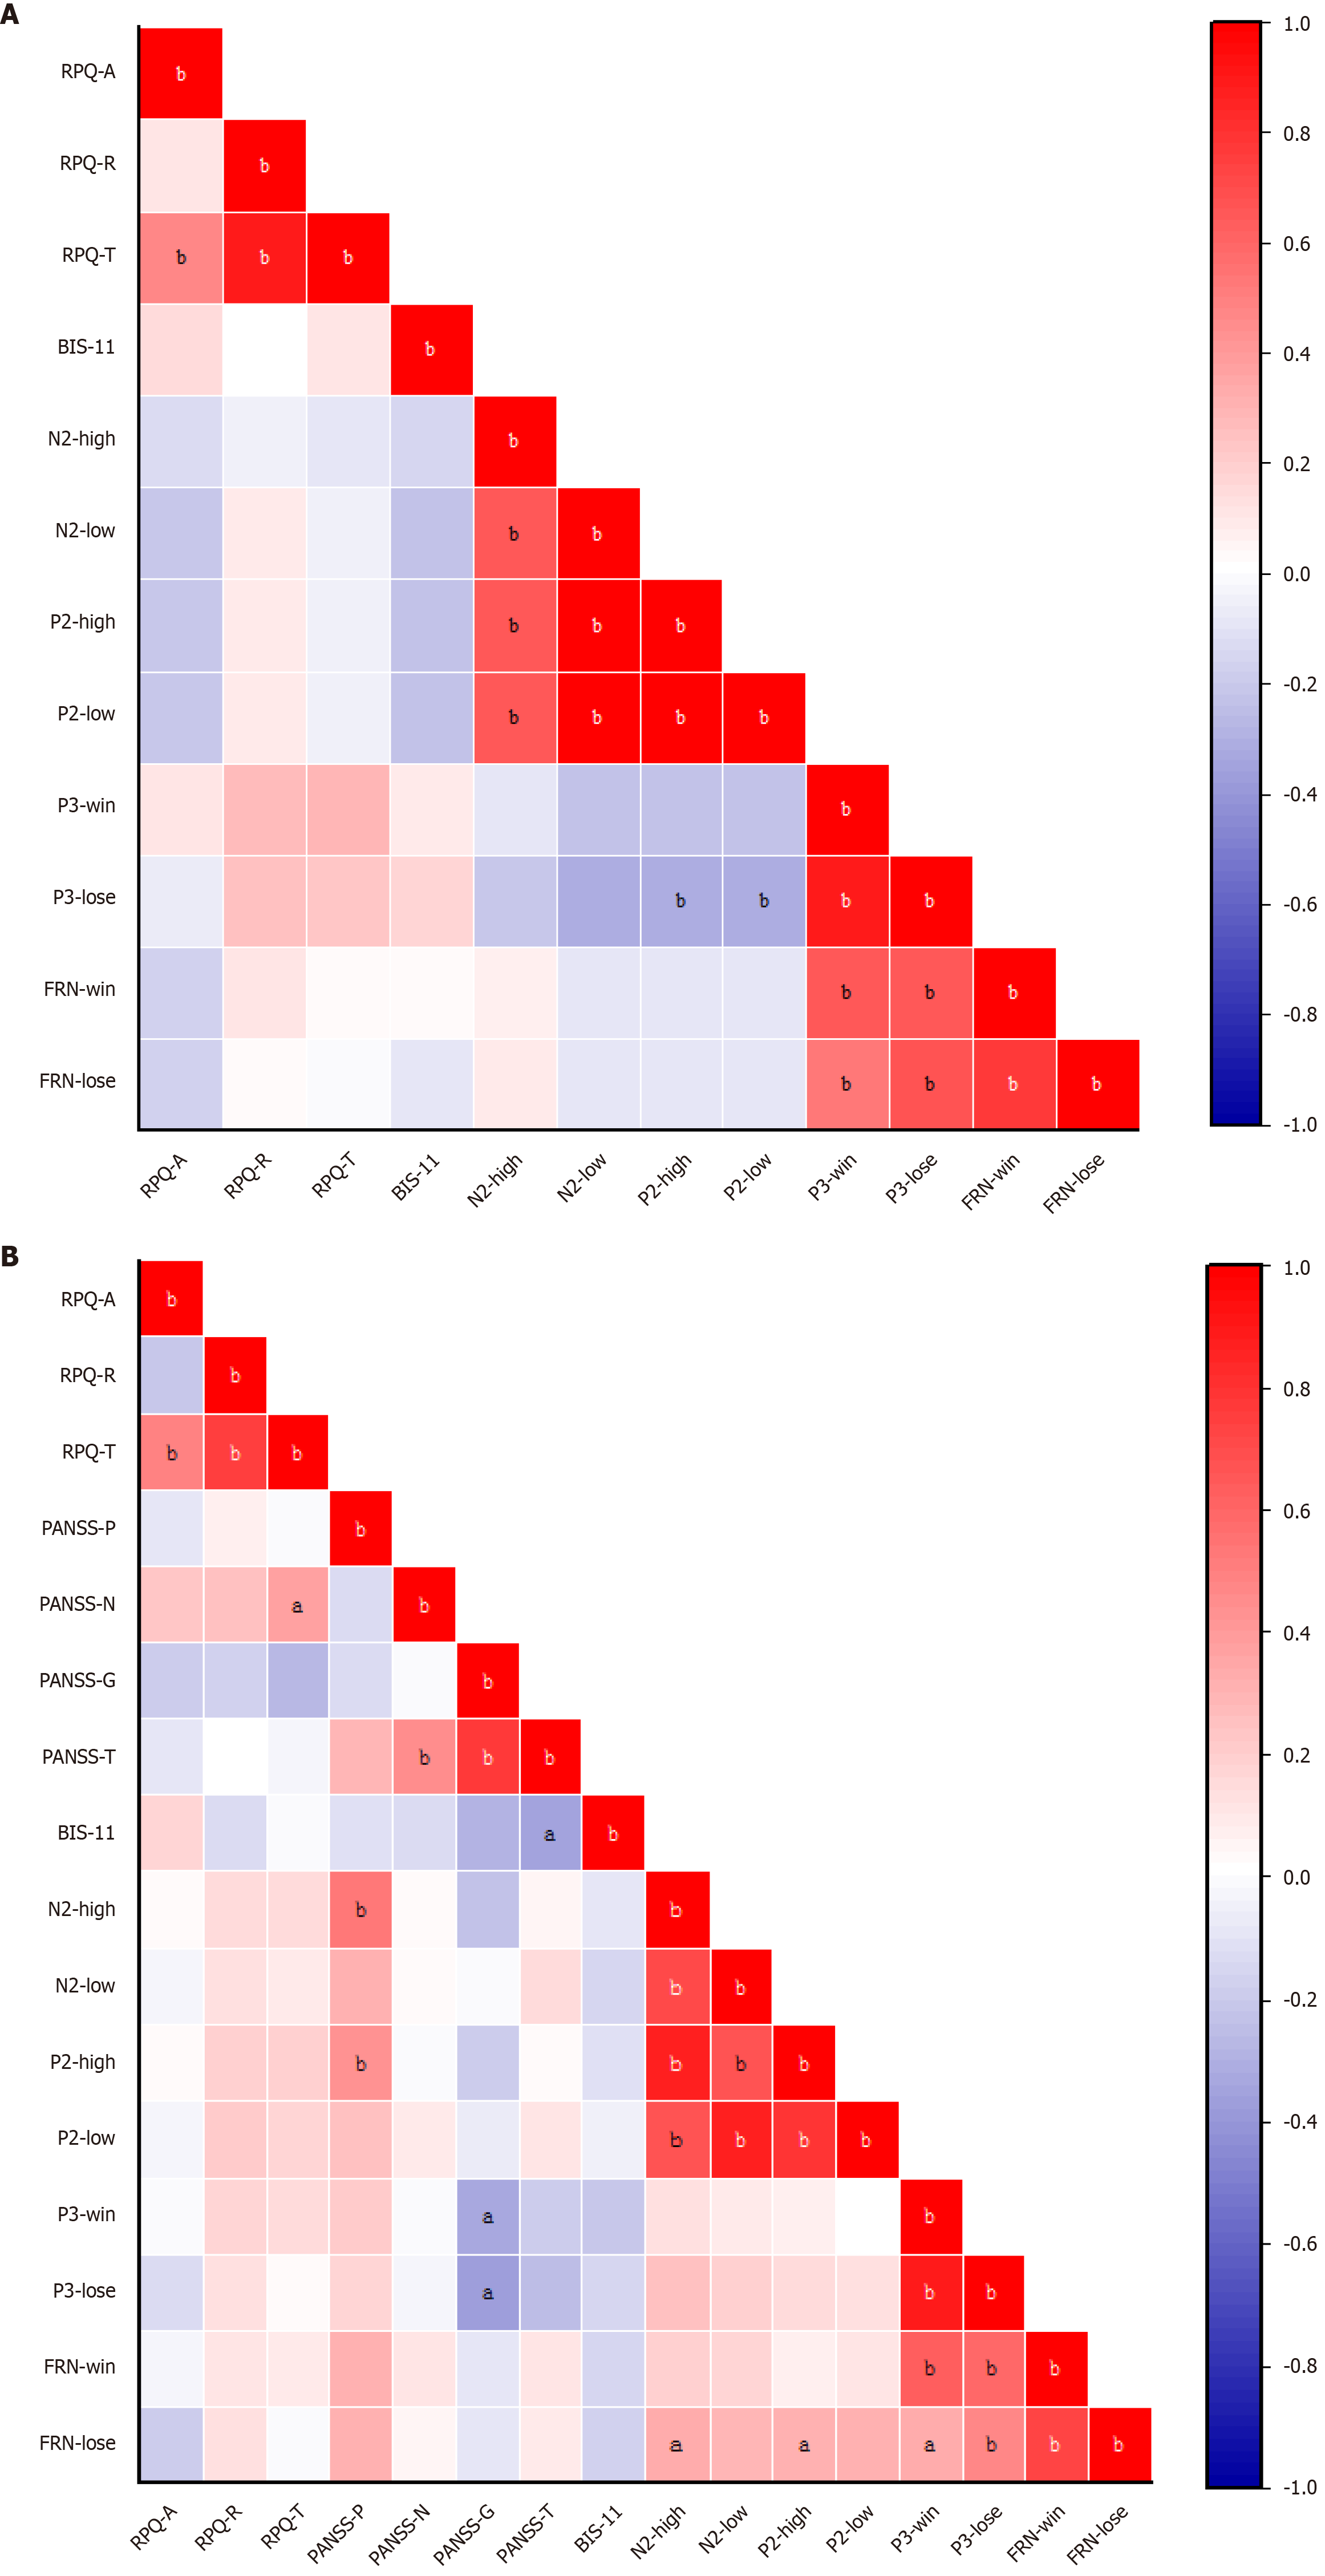
Figure 7 Heatmap for correlations among variables in schizophrenia and healthy control patients.
A: Correlation analysis of event-related potential (ERP) components’ amplitudes and scale scores for healthy control group; B: Correlation analysis of ERP components’ amplitudes and scale scores for schizophrenia group. Positive correlations are indicated in red, while negative correlations are marked in blue. aP < 0.05, bP < 0.01; HC: Healthy control; SCZ: Schizophrenia; RPQ-A: Reactive Proactive Aggression Questionnaire-active aggression; RPQ-R: Reactive Proactive Aggression Questionnaire-reactive aggression; RPQ-T: Reactive Proactive Aggression Questionnaire-total aggression; BIS-11: Barratt Impulsiveness Scale-11; FRN: Feedback-related negativity.
- Citation: Zhang L, Mei Q, Zhang JZ, Chen LM, Liu XH, Zhou ZH, Zhou HL. Neural correlates of aggression in schizophrenia: An event-related potential study using the competitive reaction time task. World J Psychiatry 2025; 15(8): 109280
- URL: https://www.wjgnet.com/2220-3206/full/v15/i8/109280.htm
- DOI: https://dx.doi.org/10.5498/wjp.v15.i8.109280


