Copyright
©The Author(s) 2025.
World J Psychiatry. Aug 19, 2025; 15(8): 109280
Published online Aug 19, 2025. doi: 10.5498/wjp.v15.i8.109280
Published online Aug 19, 2025. doi: 10.5498/wjp.v15.i8.109280
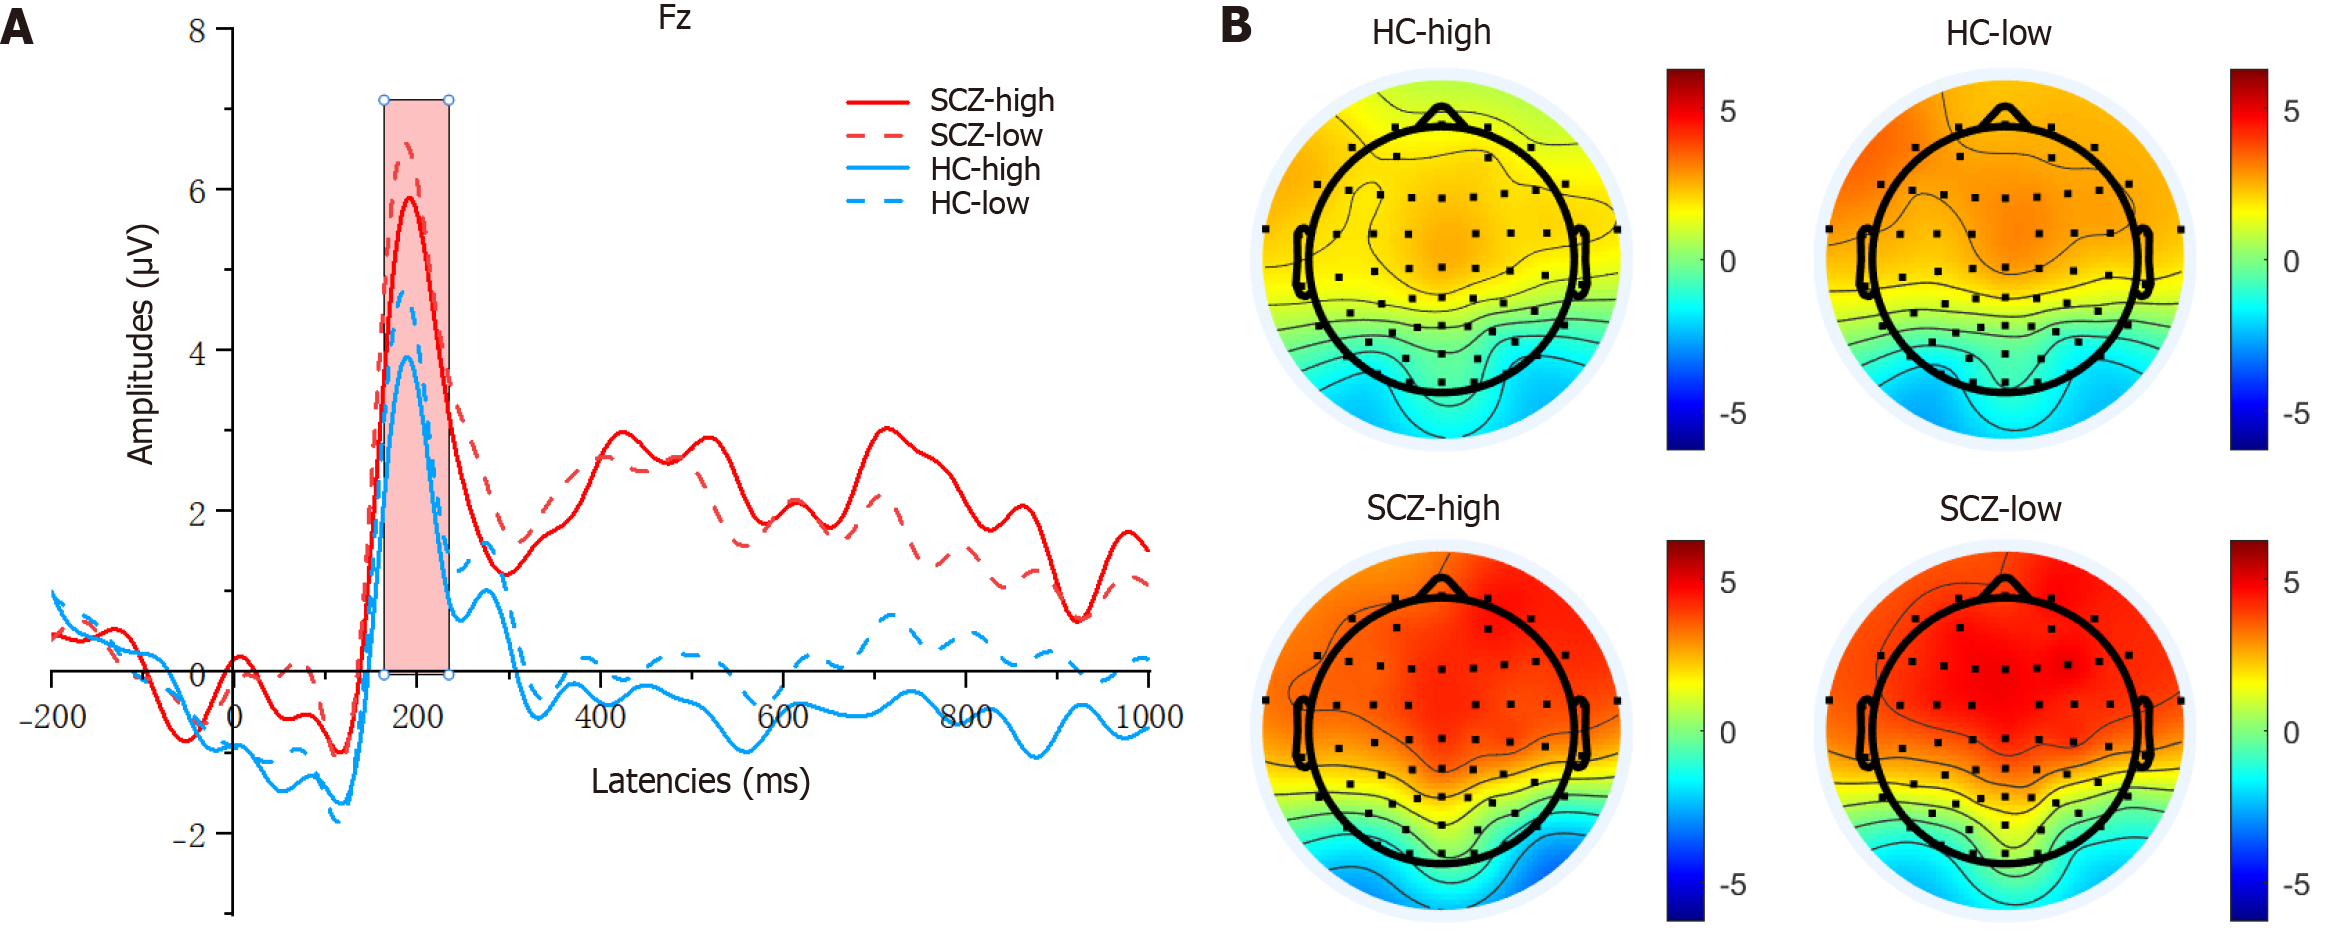
Figure 3 Grand averaged amplitudes and topographical distribution of P2 of both schizophrenia and healthy control groups.
A: Grand average event-related potential waveforms of P2 (time window 150-250 milliseconds) at Fz under different provocative conditions (high vs low); B: Topographic maps of P2 under different provocative conditions (high vs low). HC: Healthy control; SCZ: Schizophrenia; ms: Milliseconds.
- Citation: Zhang L, Mei Q, Zhang JZ, Chen LM, Liu XH, Zhou ZH, Zhou HL. Neural correlates of aggression in schizophrenia: An event-related potential study using the competitive reaction time task. World J Psychiatry 2025; 15(8): 109280
- URL: https://www.wjgnet.com/2220-3206/full/v15/i8/109280.htm
- DOI: https://dx.doi.org/10.5498/wjp.v15.i8.109280


