Copyright
©The Author(s) 2025.
World J Psychiatry. Aug 19, 2025; 15(8): 102835
Published online Aug 19, 2025. doi: 10.5498/wjp.v15.i8.102835
Published online Aug 19, 2025. doi: 10.5498/wjp.v15.i8.102835
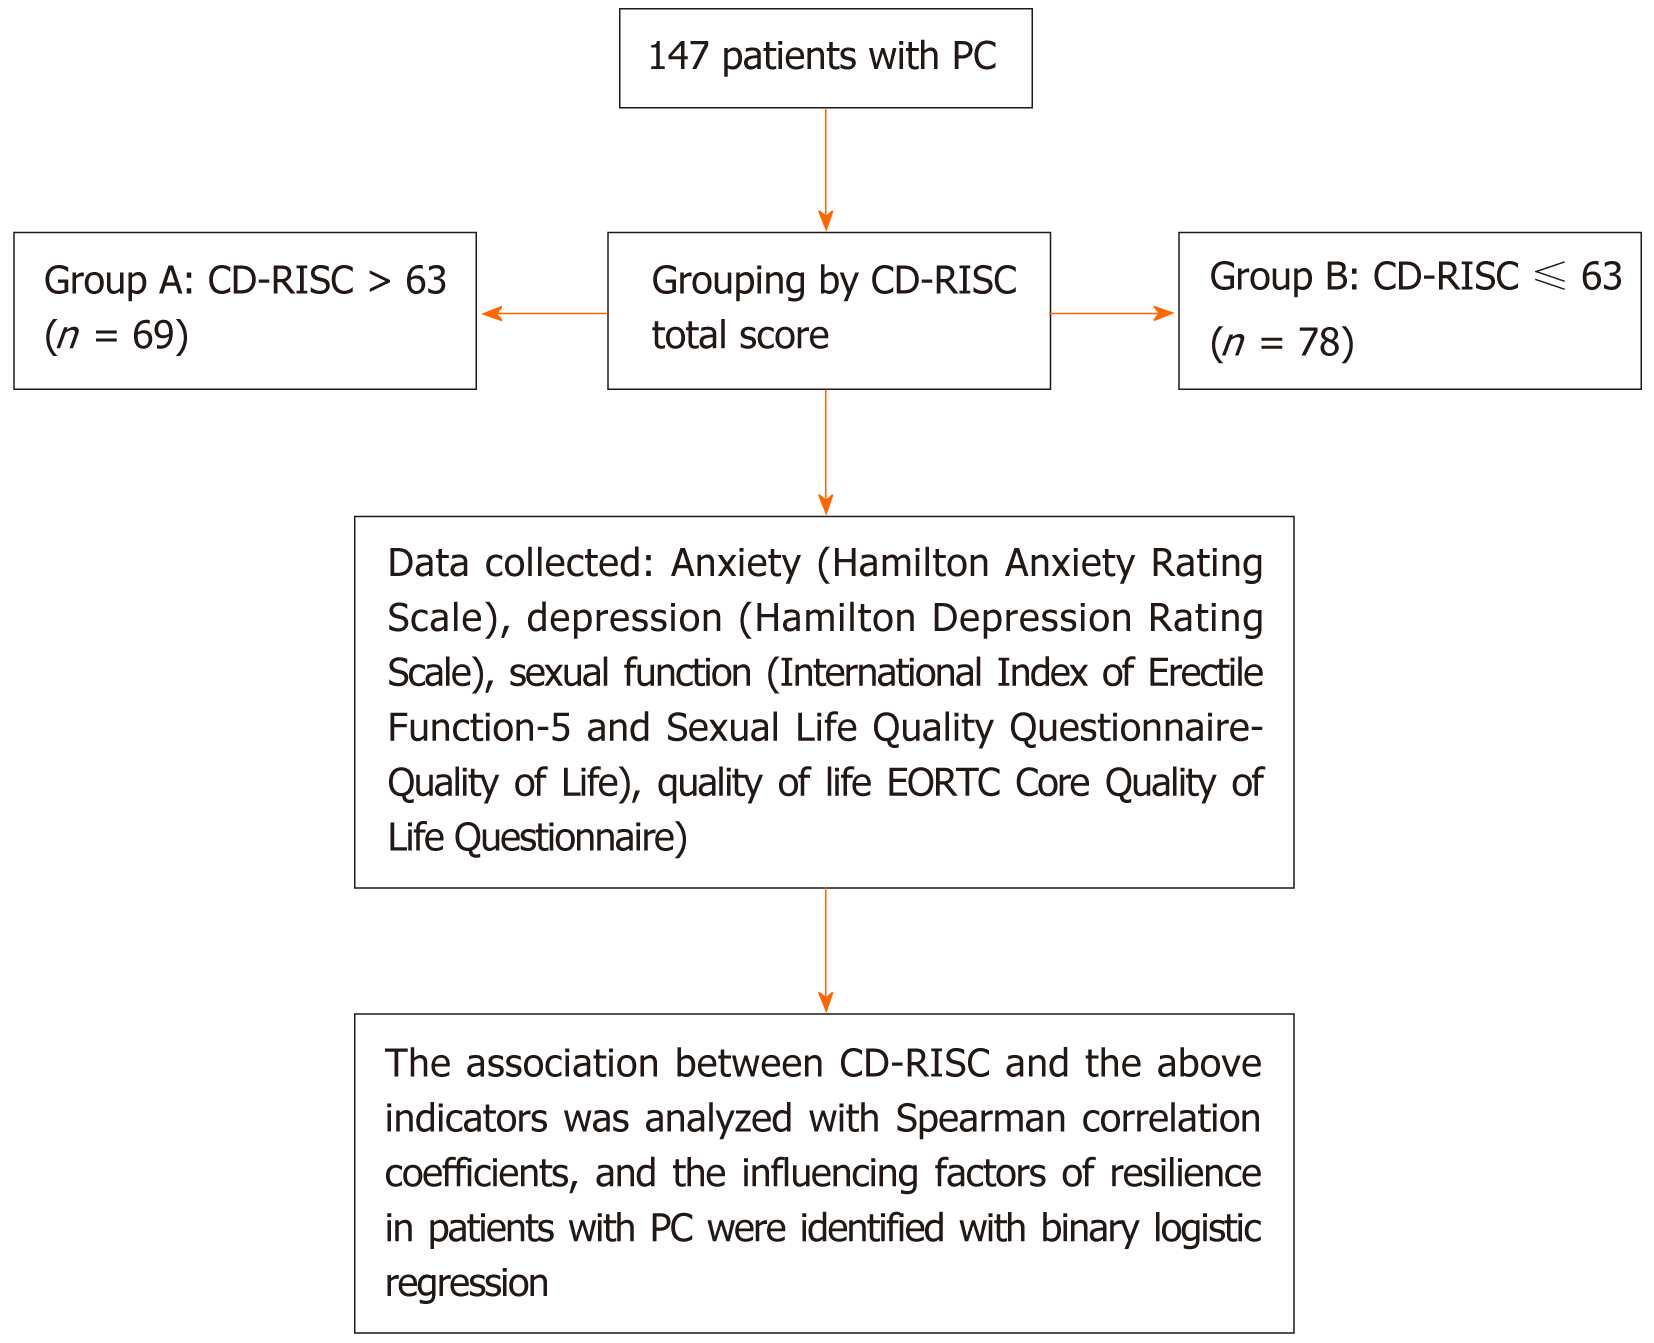
Figure 1 Research flow chart.
PC: Prostate cancer; CD-RISC: Connor-Davidson Resilience Scale.
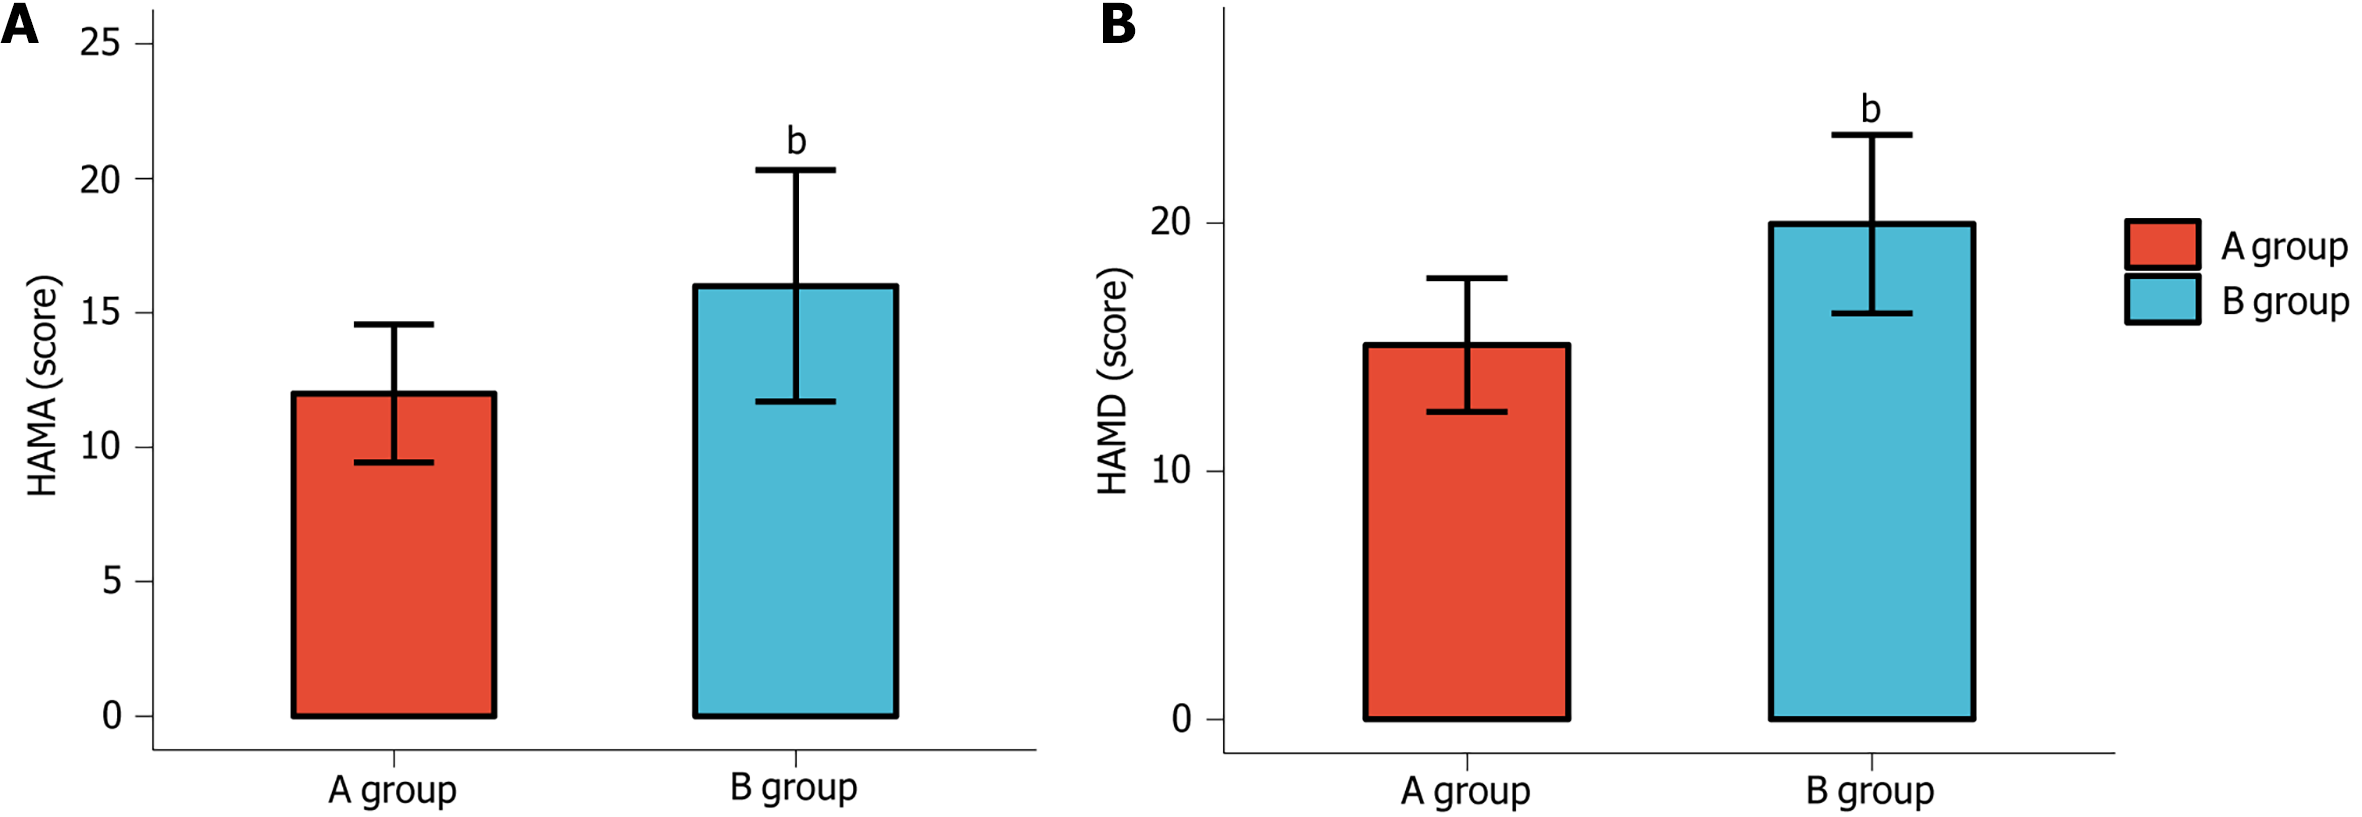
Figure 2 Anxiety and depression levels of two groups.
A: The Hamilton Anxiety Rating Scale levels of two groups; B: The Hamilton Depression Rating Scale levels of two groups. The Hamilton Anxiety Rating Scale was utilized to measure anxiety levels, and the Hamilton Depression Rating Scale was employed to assess depressive symptoms. Intergroup comparisons for these measures were conducted using independent t-tests. bP < 0.01 compared to group A. HAMA: Hamilton Anxiety Rating Scale; HAMD: Hamilton Depression Rating Scale.
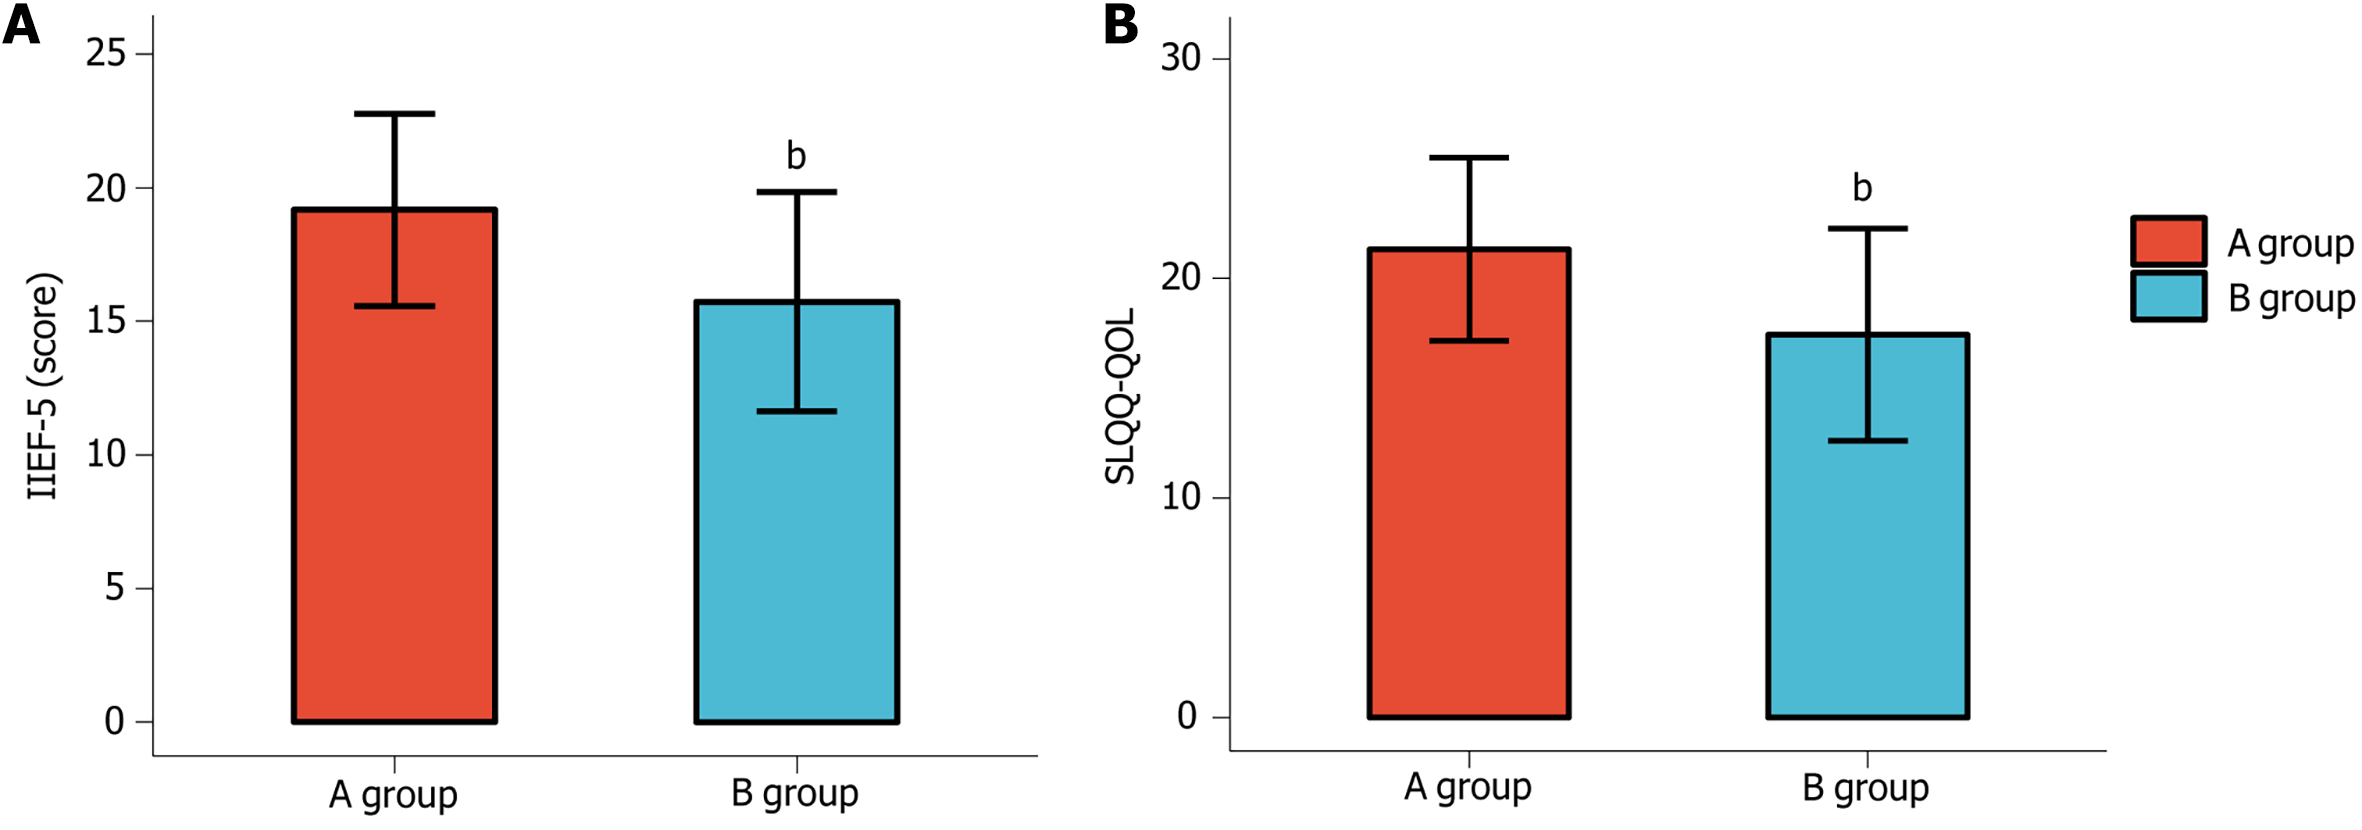
Figure 3 Sexual function of two groups.
A: The International Index of Erectile Function-5 Levels of two groups; B: The Sexual Life Quality Questionnaire-Quality of Life levels of two groups. Erectile function was evaluated using the International Index of Erectile Function-5, while sexual quality of life was measured with the Sexual Life Quality Questionnaire-Quality of Life. Comparisons between the two groups for these outcomes were also performed using independent t-tests. bP < 0.01 compared to group A. IIEF-5: International Index of Erectile Function-5; SLQQ-QOL: Sexual Life Quality Questionnaire-Quality of Life.
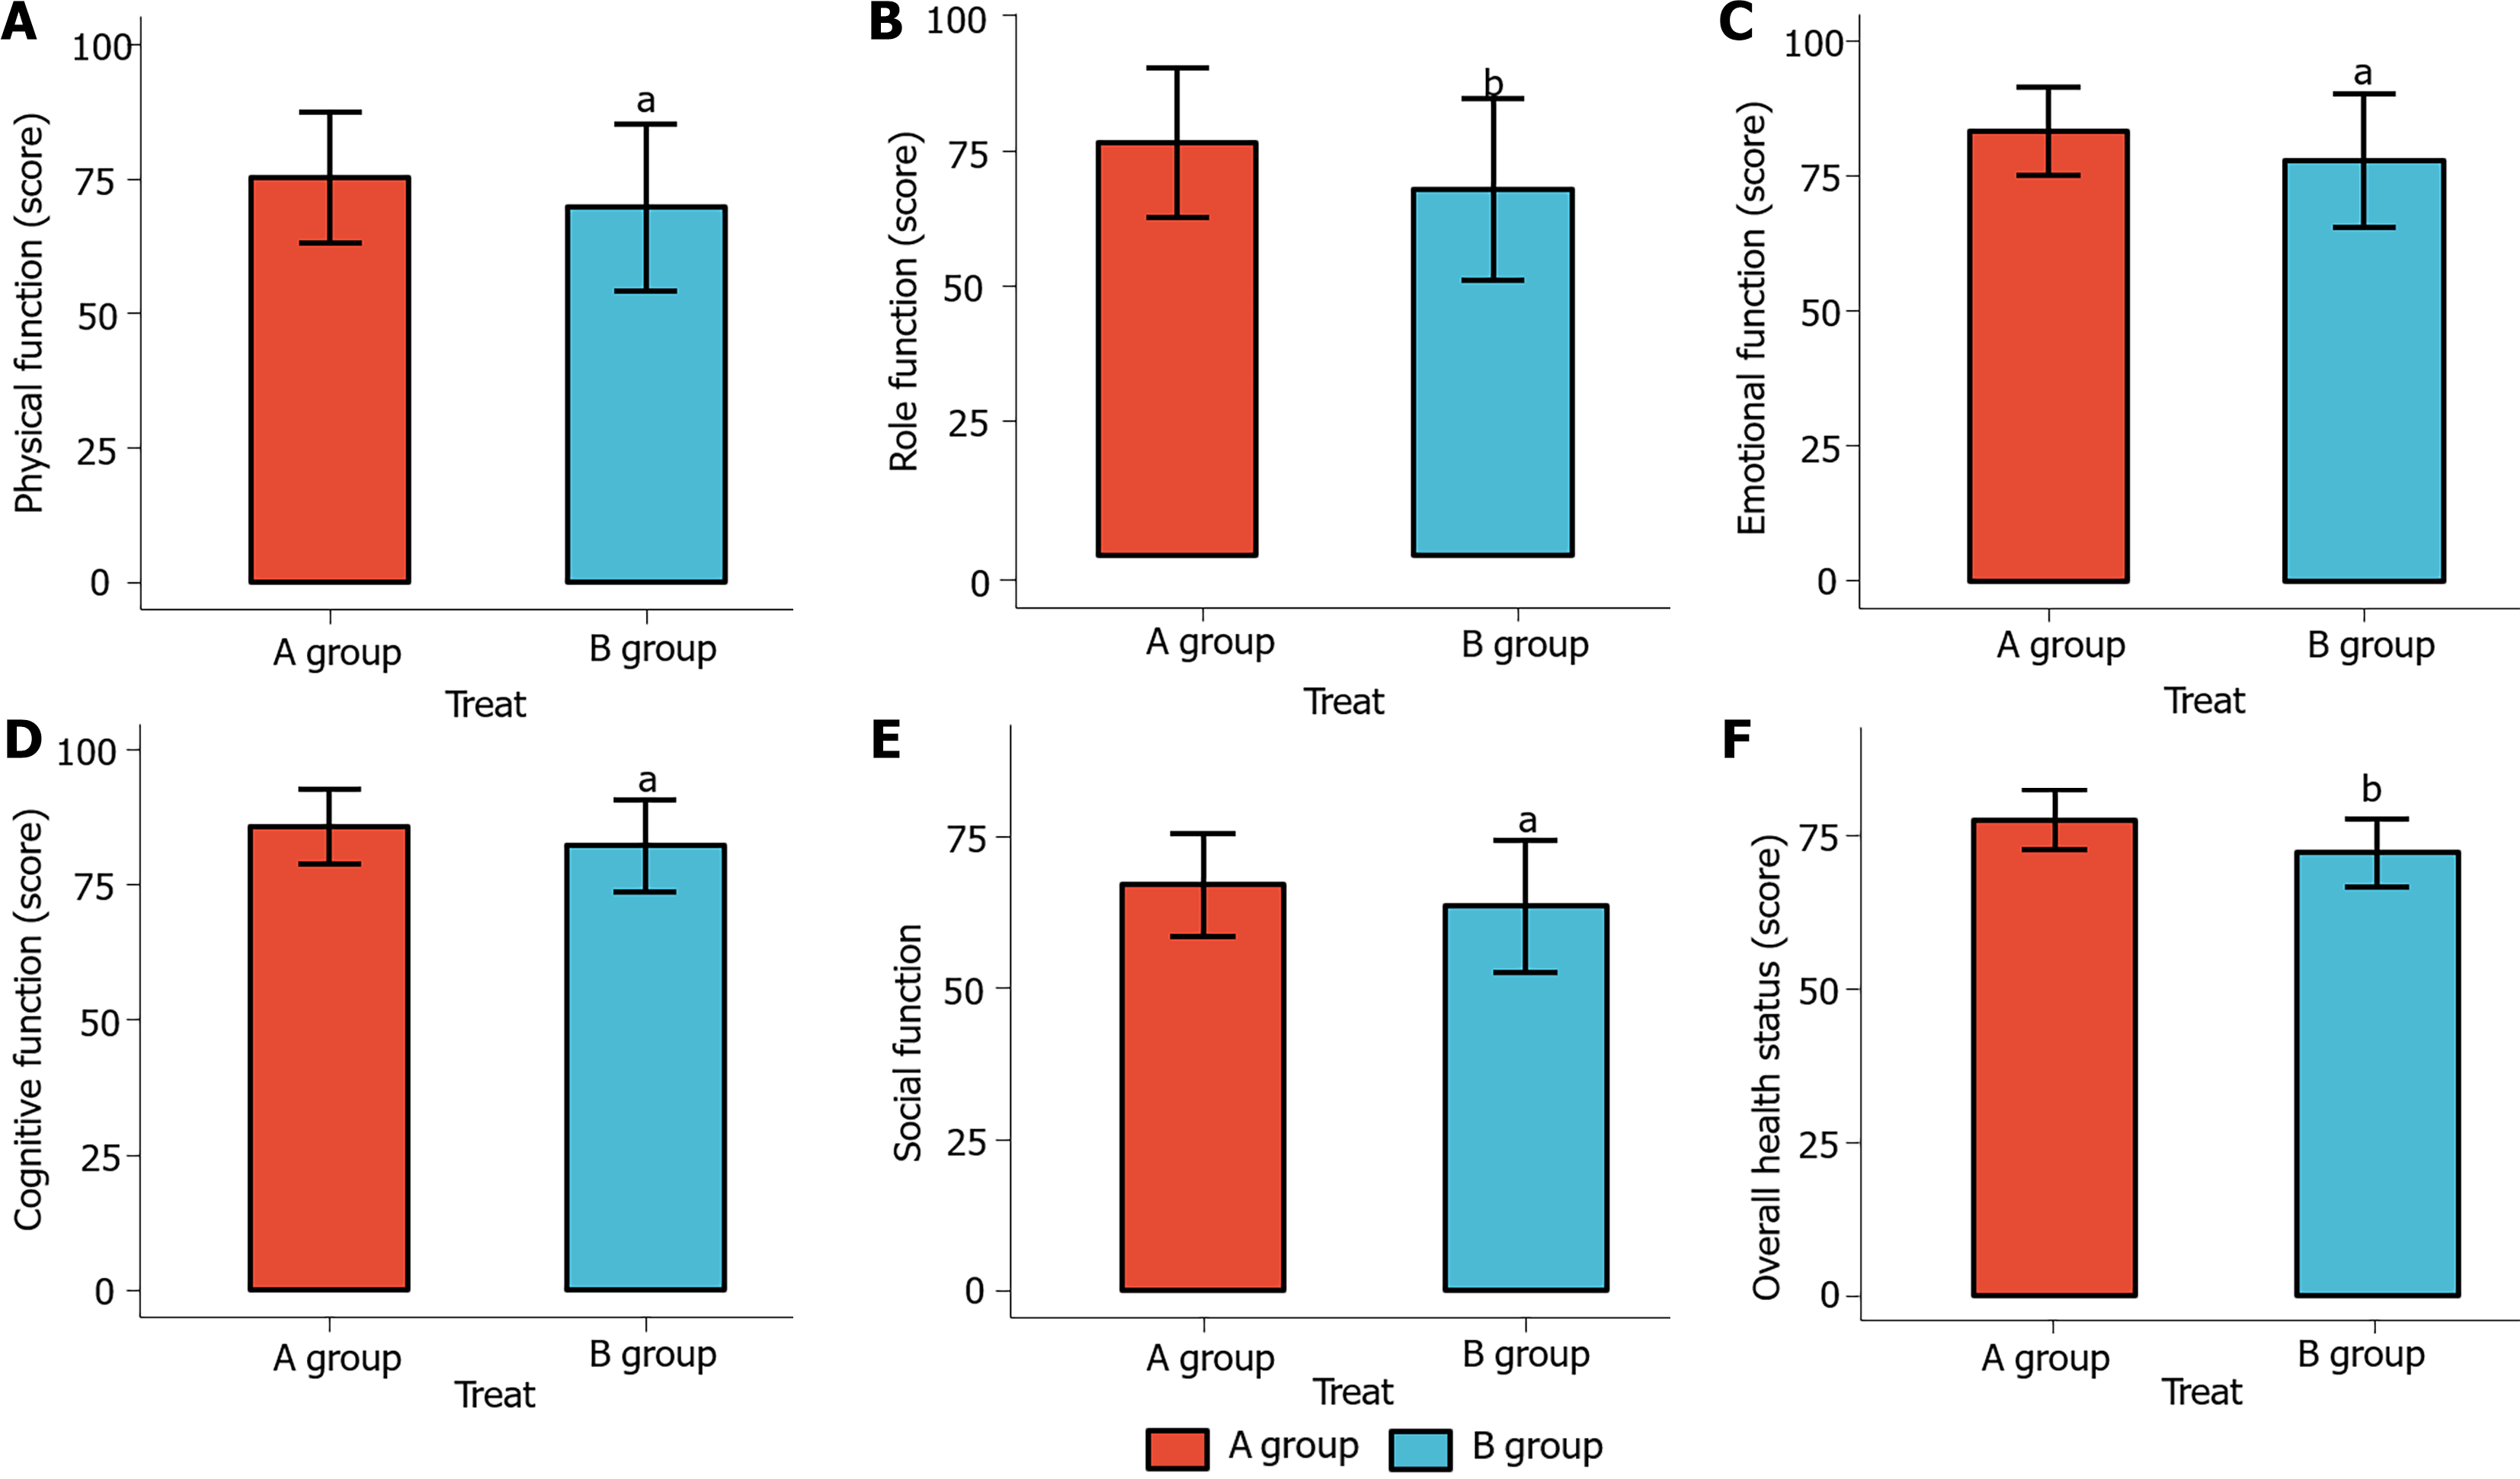
Figure 4 Quality of life of two groups.
A: The EORTC Core Quality of Life Questionnaire (QLQ-C30) scores of the two groups in terms of physical function; B: QLQ-C30 role function dimension scores in both groups; C: QLQ-C30 emotional function dimension scores in both groups; D: QLQ-C30 cognitive function dimension scores in both groups; E: QLQ-C30 social function dimension scores in both groups; F: QLQ-C30 overall health status dimension scores in both groups. All the aforementioned domains of the EORTC Core Quality of Life Questionnaire were used to evaluate quality of life, and intergroup comparisons were analyzed using independent t-tests. aP < 0.05, compared to group A; bP < 0.01, compared to group A. SLQQ-QOL: Core Quality of Life Questionnaire.
- Citation: Qu JL, Lu HY, Fu XB, Gai WT. Correlation of resilience with anxiety and depression in patients with prostate cancer and analysis of influencing factors. World J Psychiatry 2025; 15(8): 102835
- URL: https://www.wjgnet.com/2220-3206/full/v15/i8/102835.htm
- DOI: https://dx.doi.org/10.5498/wjp.v15.i8.102835


