Copyright
©The Author(s) 2025.
World J Psychiatry. May 19, 2025; 15(5): 102706
Published online May 19, 2025. doi: 10.5498/wjp.v15.i5.102706
Published online May 19, 2025. doi: 10.5498/wjp.v15.i5.102706
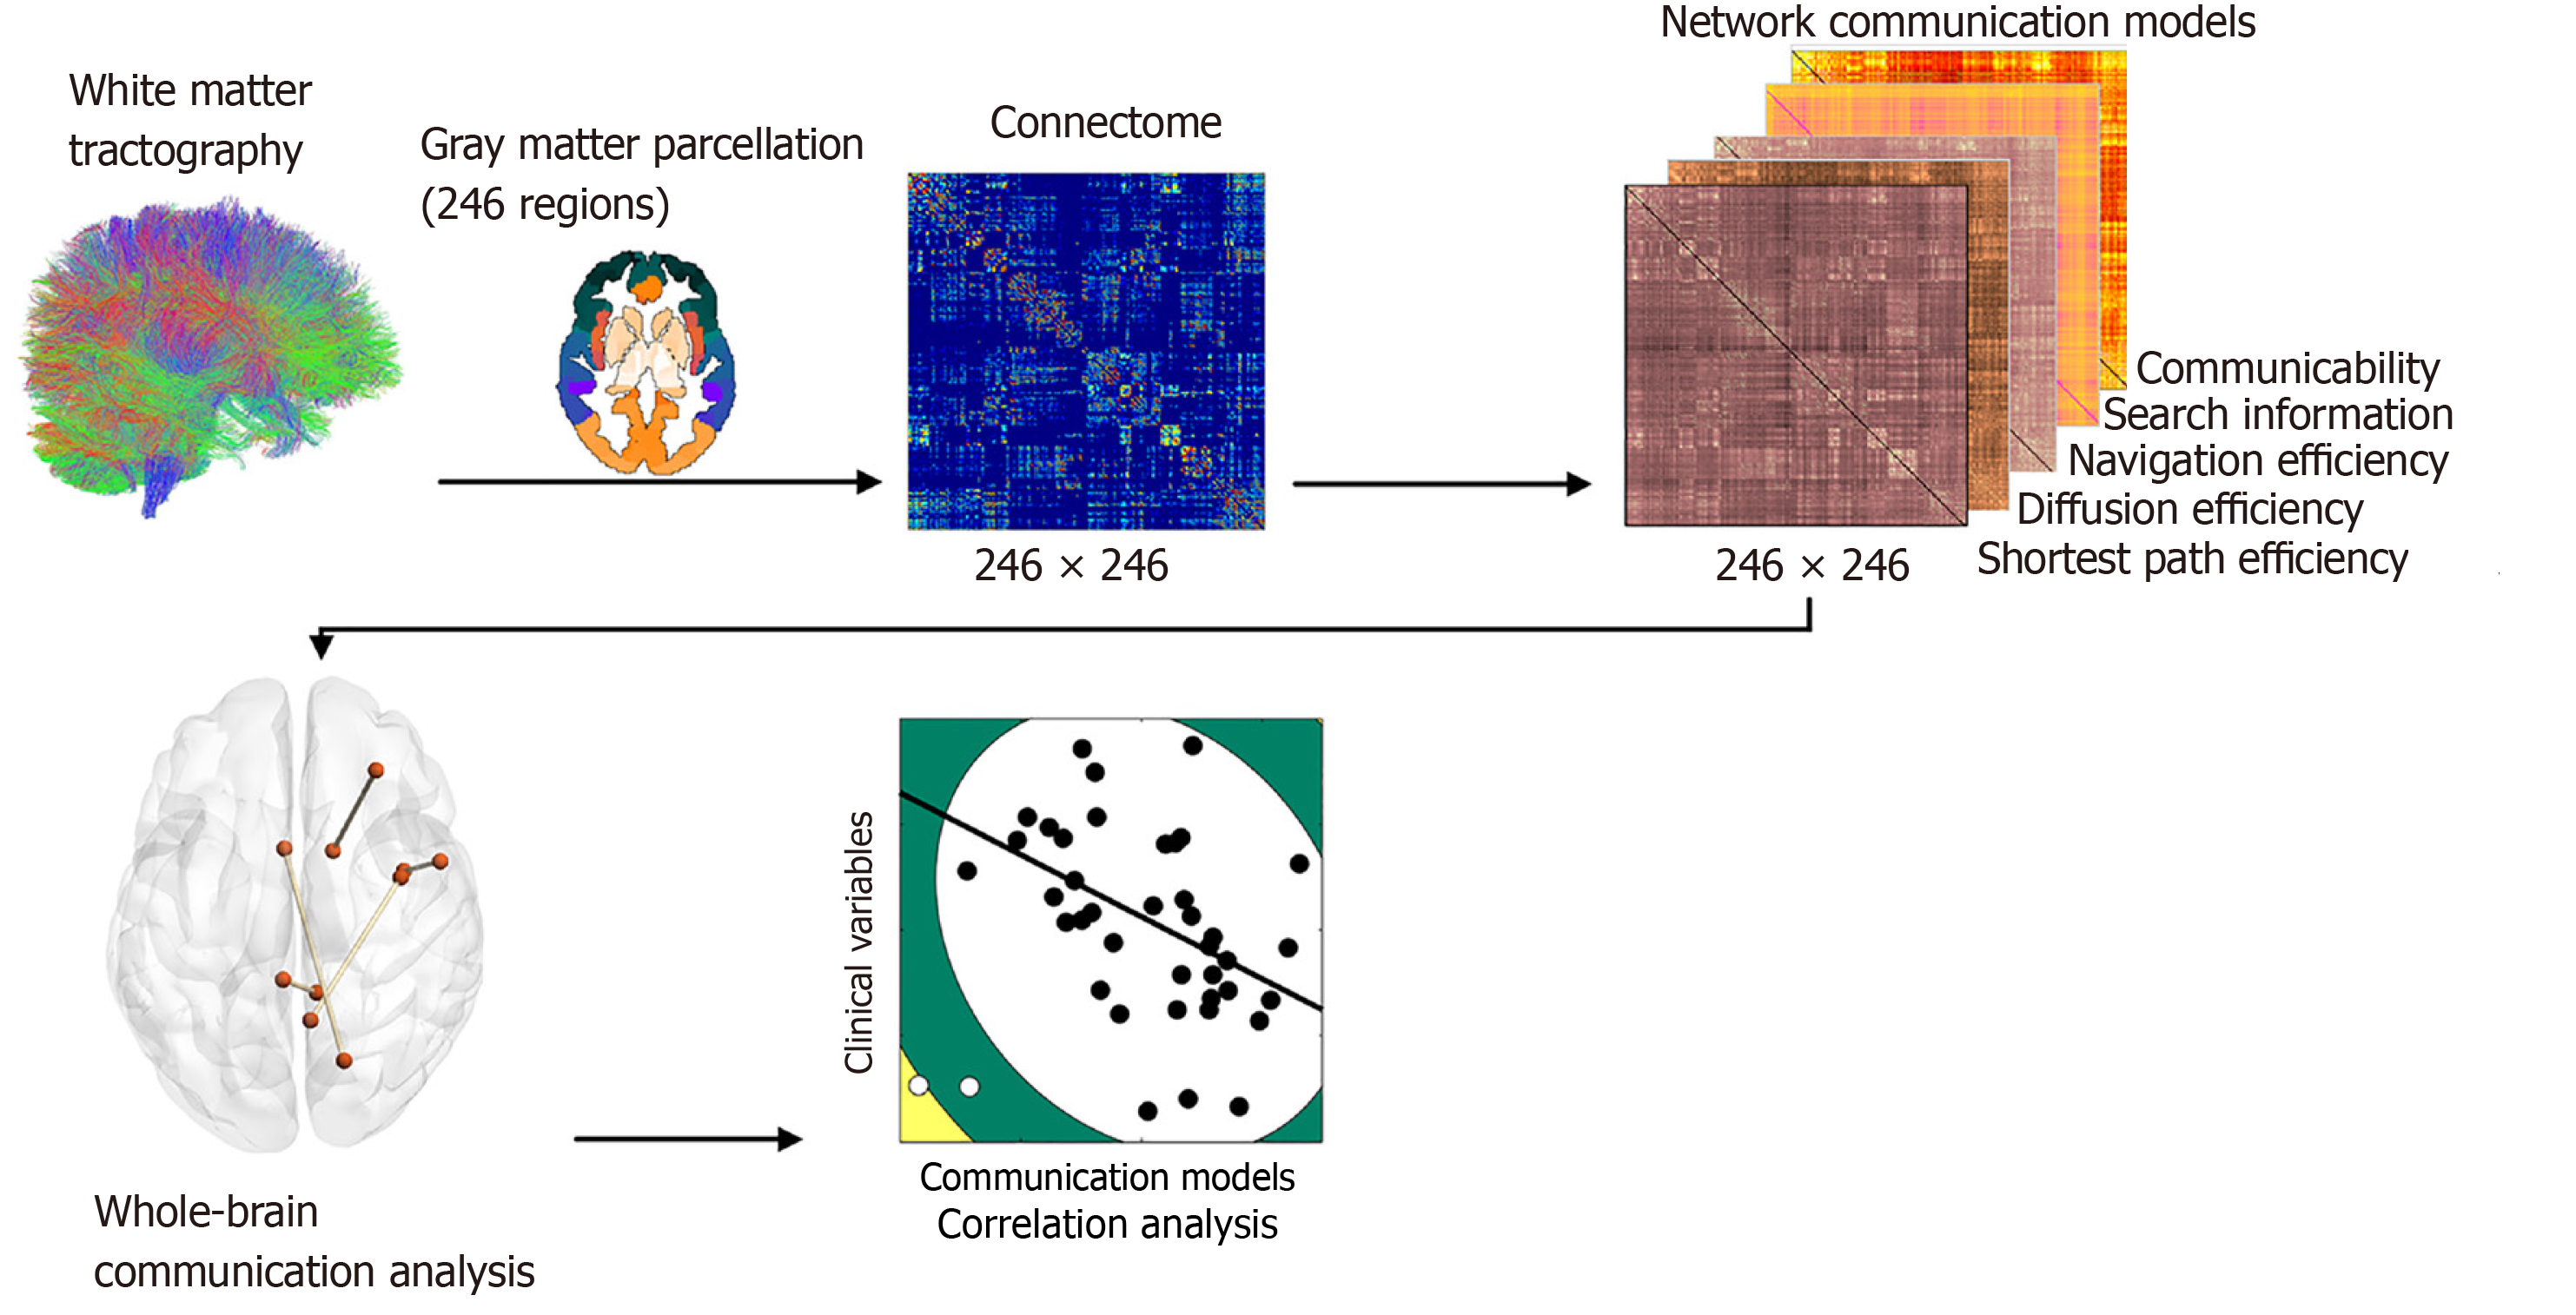
Figure 1 Methodology overview.
Follow the direction indicated by the arrow, first white matter tractography applied to diffusion magnetic resonance imaging data was used to map undirected weighted adjacency matrices respecting the structural connectivity between n = 246 cortical regions. Shortest path efficiency, navigation efficiency, diffusion efficiency, search information, and communicability were then computed between every pair of regions to generate communication matrices. In the analysis phase, a whole-brain communication analysis was conducted and subsequently the between-group significantly different connections were explored in association with clinical variables.
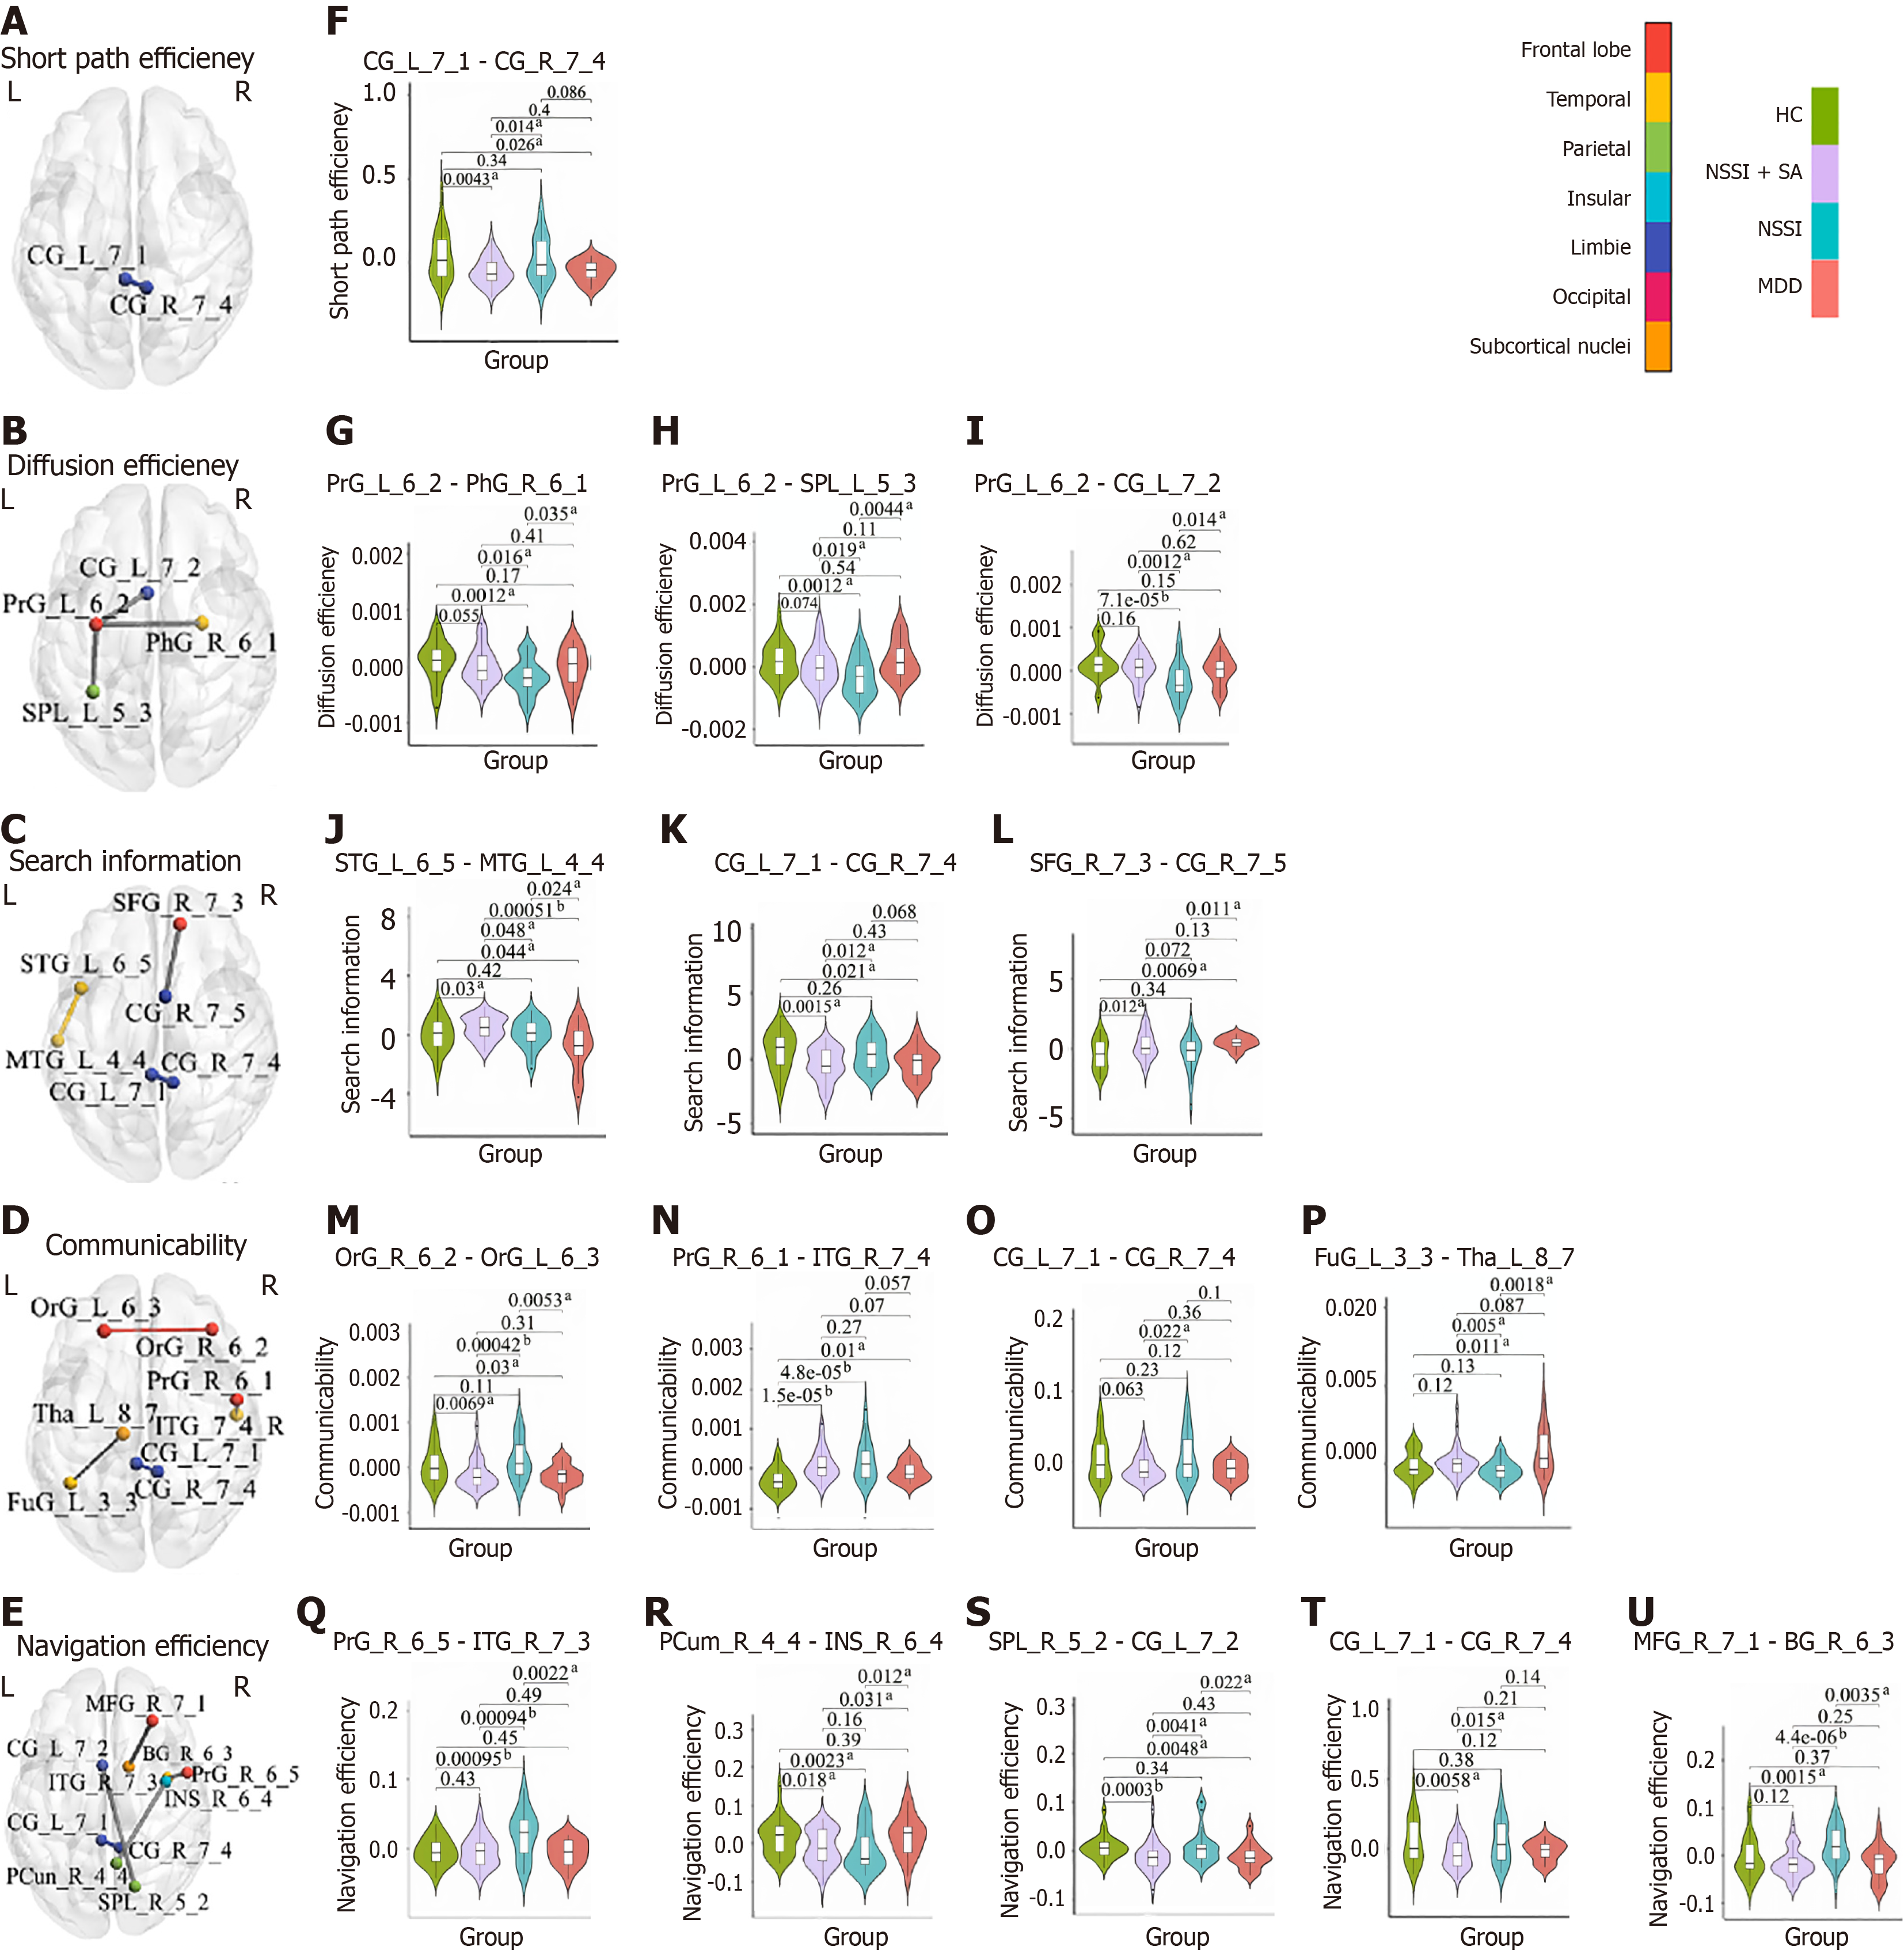
Figure 2 The results of five whole-brain communication models analysis across the healthy controls, non-suicidal self-injury + suicide attempts, non-suicidal self-injury, and major depressive disorder groups.
aP < 0.05; bP <0.001. A-E: Illustrate the F-test results presented from the dorsal view of the brain; F-U: Depict the post-hoc results of these connection results. HC: Healthy controls; NSSI: Non-suicidal self-injury; SA: Suicide attempts; MDD: Major depressive disorder; CG: Cingulate gyrus; PrG: Precentral gyrus; STG: Superior temporal gyrus; SFG: Superior frontal gyrus; OrG: Orbital gyrus; FuG: Fusiform gyrus; PCun: Precuneus; SPL: Superior parietal lobule; MFG: Middle frontal gyrus.
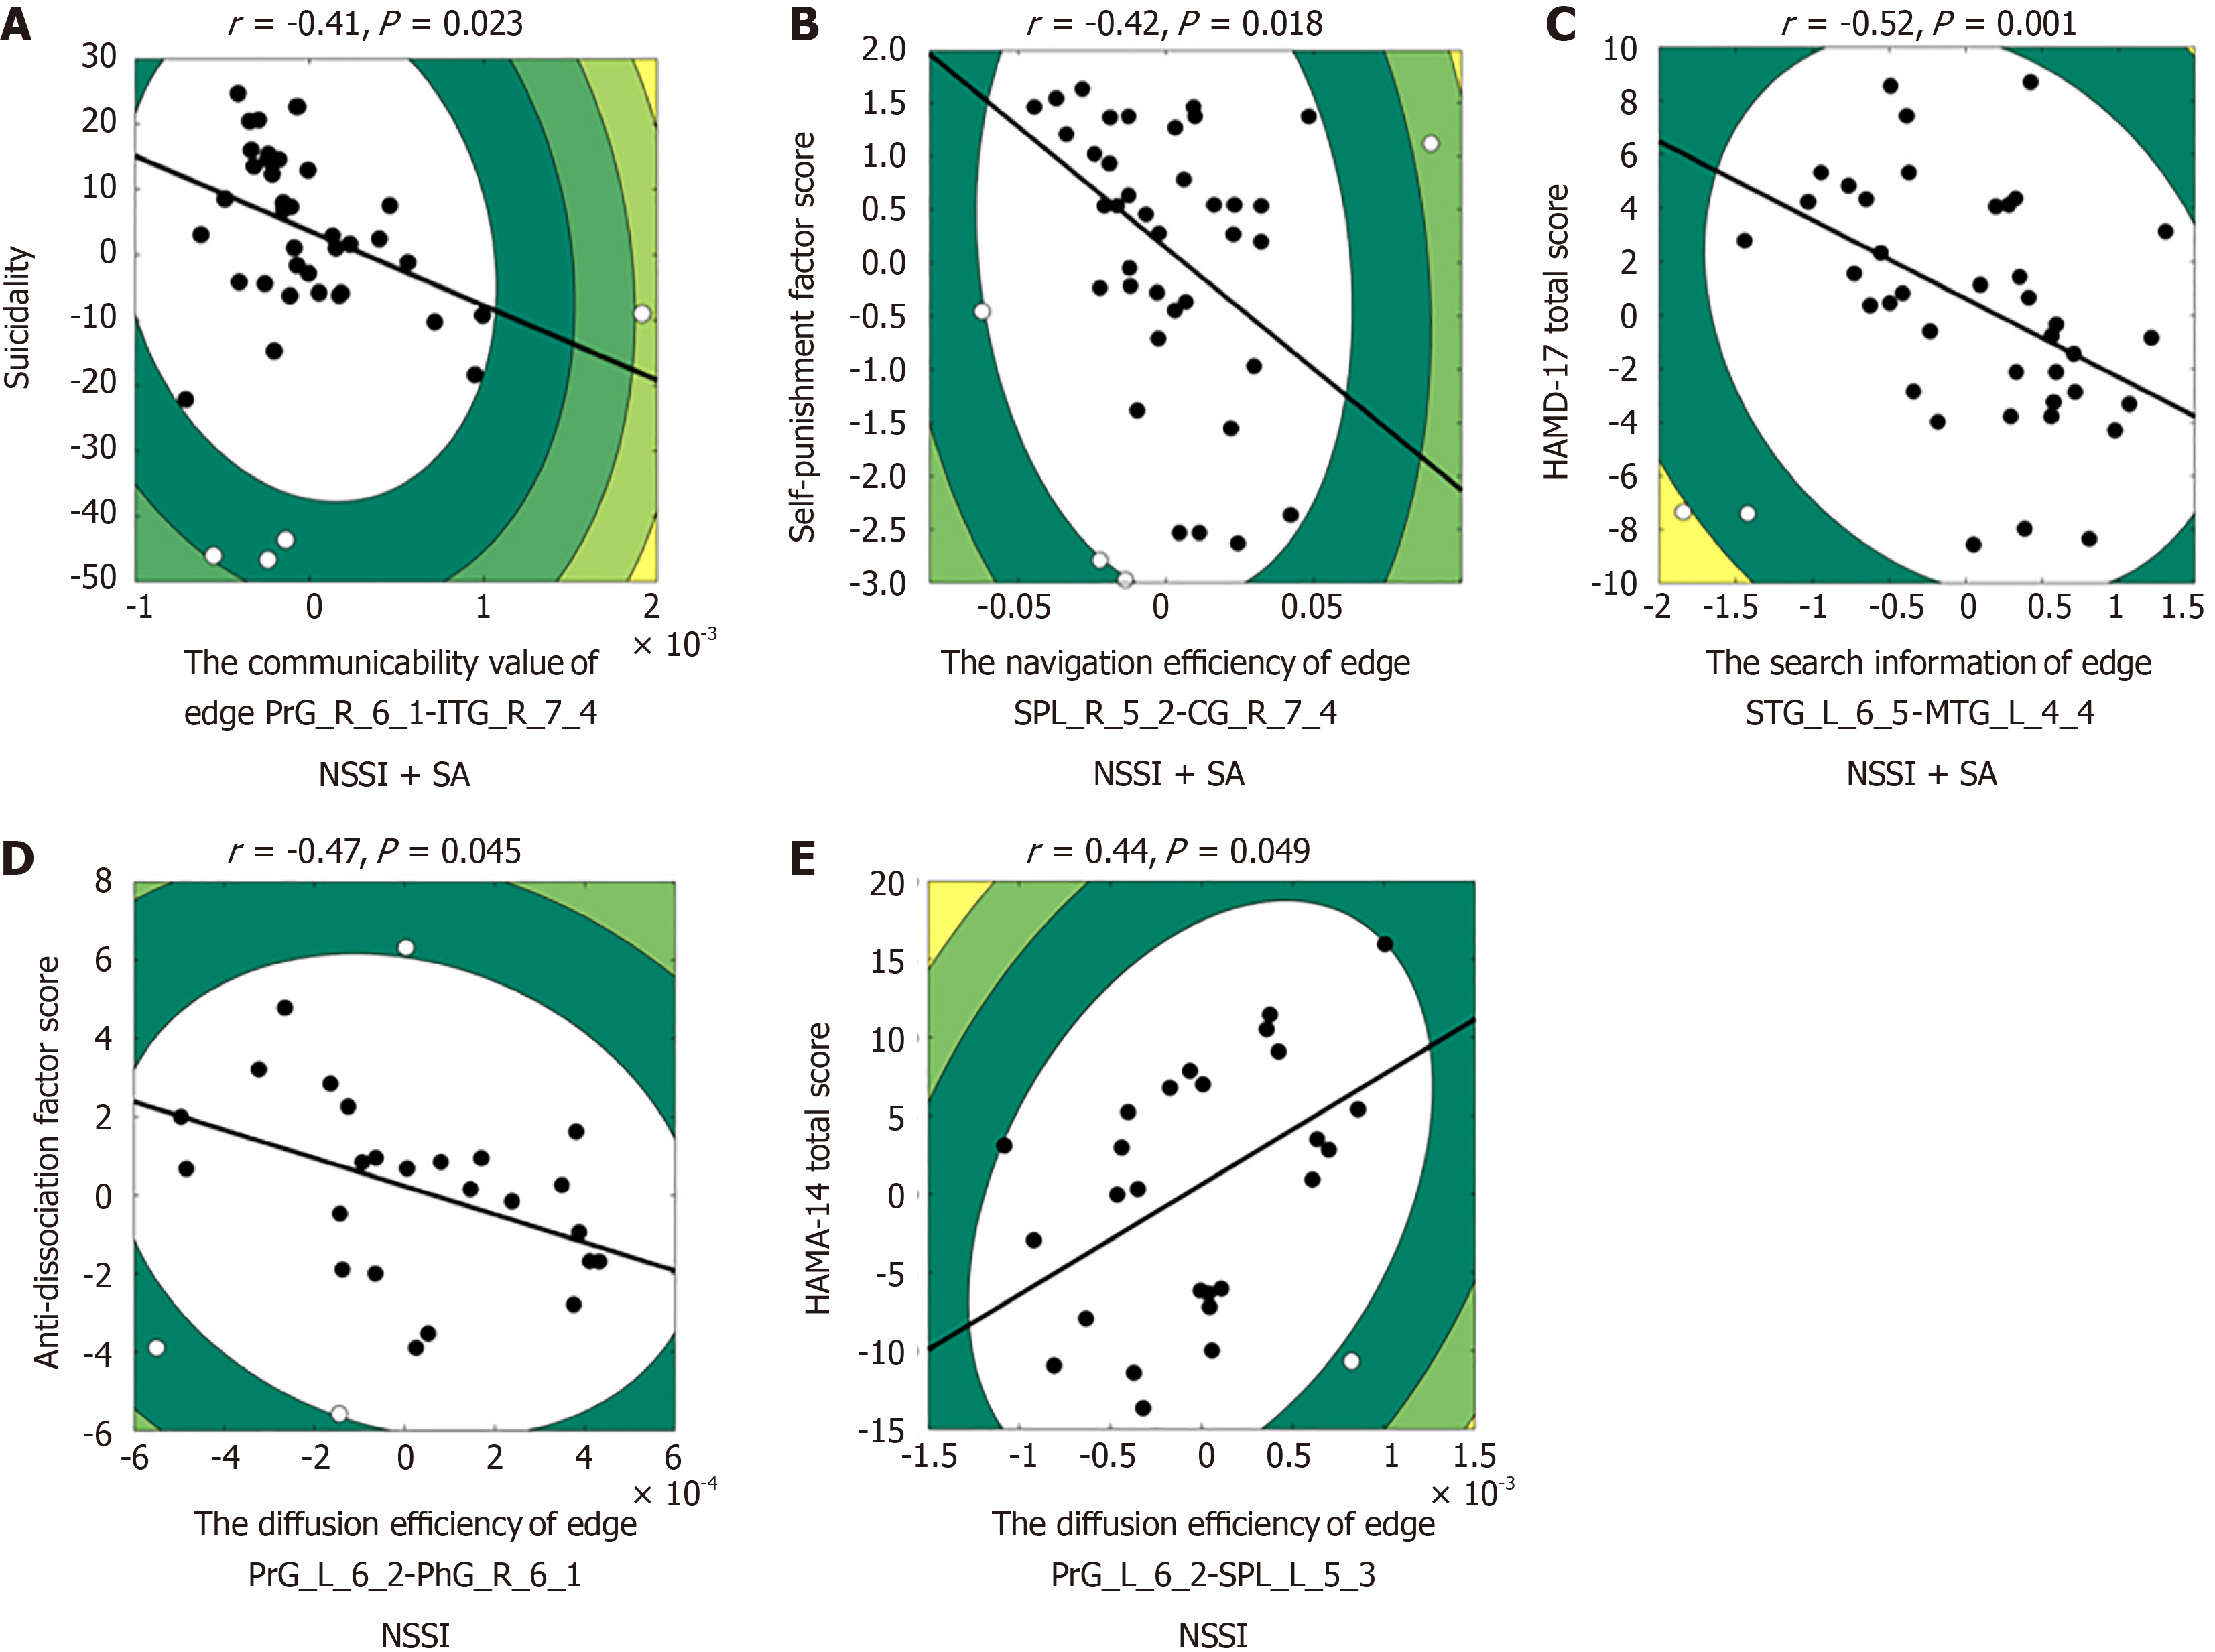
Figure 3 The correlation results between network communication models and clinical variables.
A: Suicidality; B: Self-punishment factor scores; C: The 17-item Hamilton Depression Scale total scores; D: Anti-dissociation factor scores; E: The 14-item Hamilton Anxiety Scale total scores. The contour lines indicate the boot-strapped Mahalanobis distance from the bivariate mean, and filled circles indicate data included in the correlation, while open circles indicate outliers. The solid black line denoted a linear regression over the data after outlier removal. SA: Suicide attempts; NSSI: Non-suicidal self-injury; PrG: Precentral gyrus; ITG: Inferior temporal gyrus; CG: Cingulate gyrus; SPL: Superior parietal lobule; STG: Superior temporal gyrus; MTG: Middle temporal gyrus; PhG: Parahippocampal gyrus; HAMD-17: The 17-item Hamilton Depression Scale; HAMA-14: The 14-item Hamilton Anxiety Scale.
- Citation: Wang S, Qin JL, Yang LL, Ji YY, Huang HX, Gao XS, Zhou ZM, Guo ZR, Wu Y, Tian L, Ni HJ, Zhou ZH. Structural network communication differences in drug-naive depressed adolescents with non-suicidal self-injury and suicide attempts. World J Psychiatry 2025; 15(5): 102706
- URL: https://www.wjgnet.com/2220-3206/full/v15/i5/102706.htm
- DOI: https://dx.doi.org/10.5498/wjp.v15.i5.102706


