Copyright
©The Author(s) 2025.
World J Psychiatry. May 19, 2025; 15(5): 102706
Published online May 19, 2025. doi: 10.5498/wjp.v15.i5.102706
Published online May 19, 2025. doi: 10.5498/wjp.v15.i5.102706
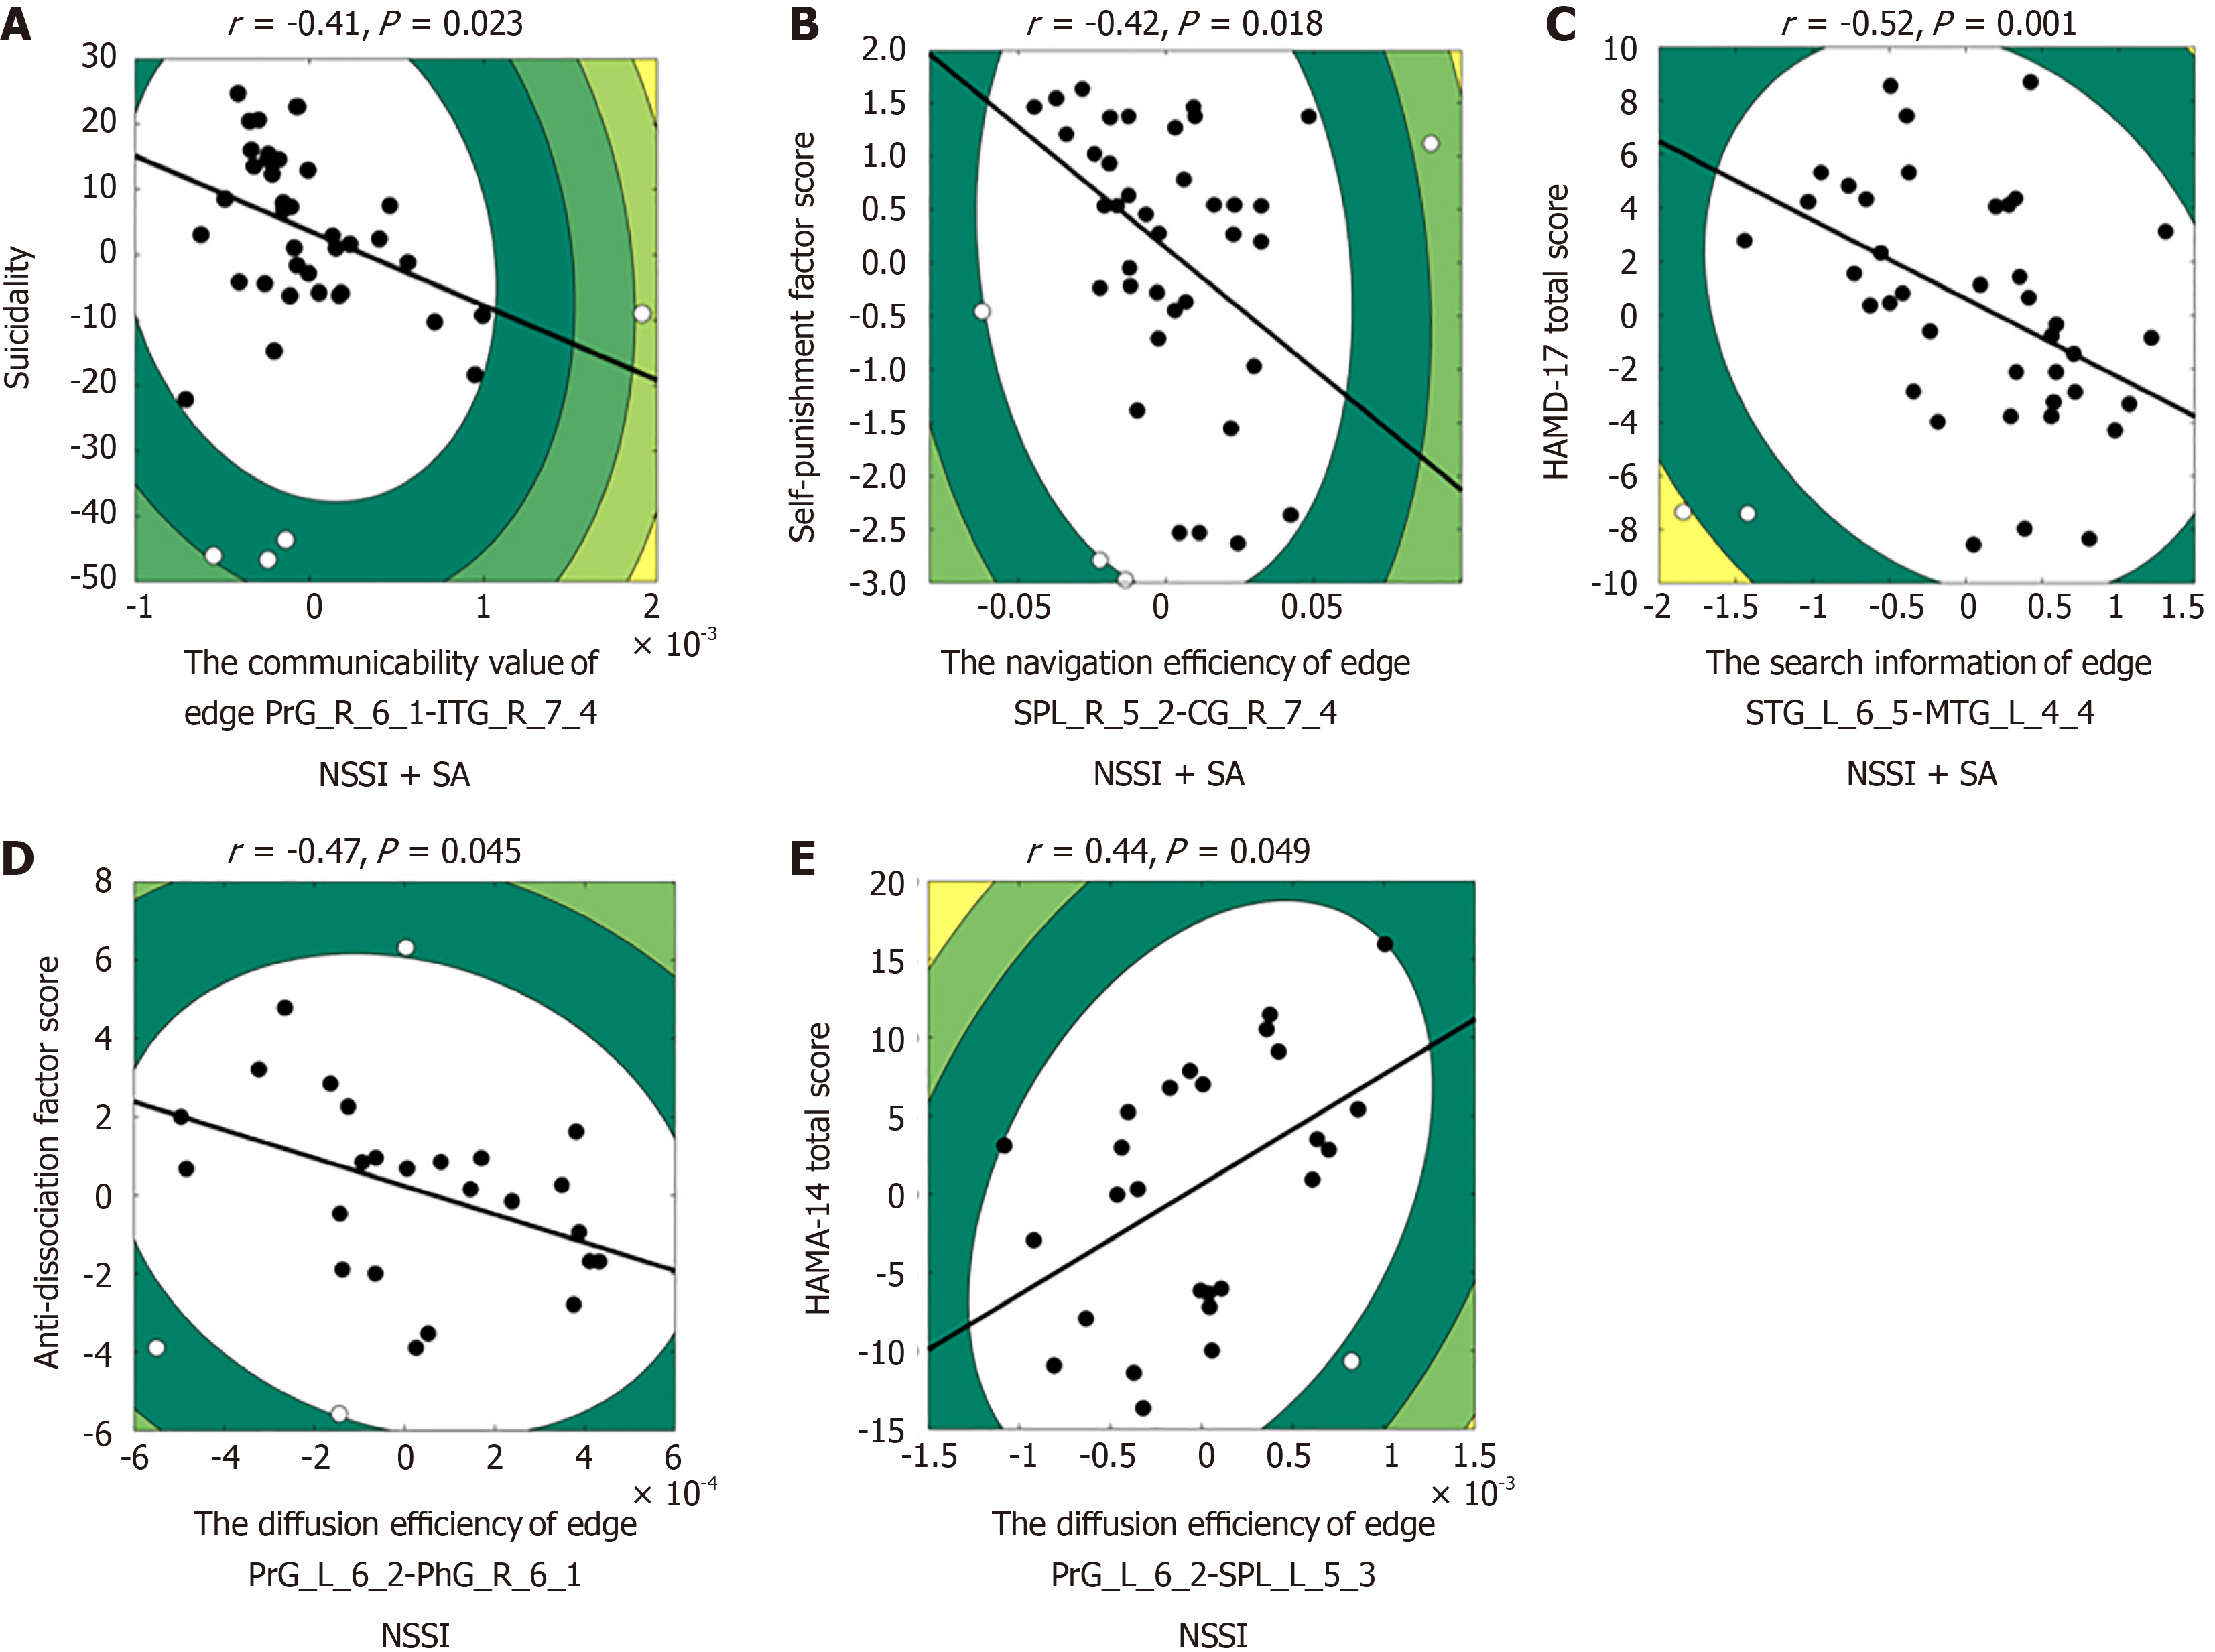
Figure 3 The correlation results between network communication models and clinical variables.
A: Suicidality; B: Self-punishment factor scores; C: The 17-item Hamilton Depression Scale total scores; D: Anti-dissociation factor scores; E: The 14-item Hamilton Anxiety Scale total scores. The contour lines indicate the boot-strapped Mahalanobis distance from the bivariate mean, and filled circles indicate data included in the correlation, while open circles indicate outliers. The solid black line denoted a linear regression over the data after outlier removal. SA: Suicide attempts; NSSI: Non-suicidal self-injury; PrG: Precentral gyrus; ITG: Inferior temporal gyrus; CG: Cingulate gyrus; SPL: Superior parietal lobule; STG: Superior temporal gyrus; MTG: Middle temporal gyrus; PhG: Parahippocampal gyrus; HAMD-17: The 17-item Hamilton Depression Scale; HAMA-14: The 14-item Hamilton Anxiety Scale.
- Citation: Wang S, Qin JL, Yang LL, Ji YY, Huang HX, Gao XS, Zhou ZM, Guo ZR, Wu Y, Tian L, Ni HJ, Zhou ZH. Structural network communication differences in drug-naive depressed adolescents with non-suicidal self-injury and suicide attempts. World J Psychiatry 2025; 15(5): 102706
- URL: https://www.wjgnet.com/2220-3206/full/v15/i5/102706.htm
- DOI: https://dx.doi.org/10.5498/wjp.v15.i5.102706


