Copyright
©The Author(s) 2025.
World J Psychiatry. May 19, 2025; 15(5): 102618
Published online May 19, 2025. doi: 10.5498/wjp.v15.i5.102618
Published online May 19, 2025. doi: 10.5498/wjp.v15.i5.102618
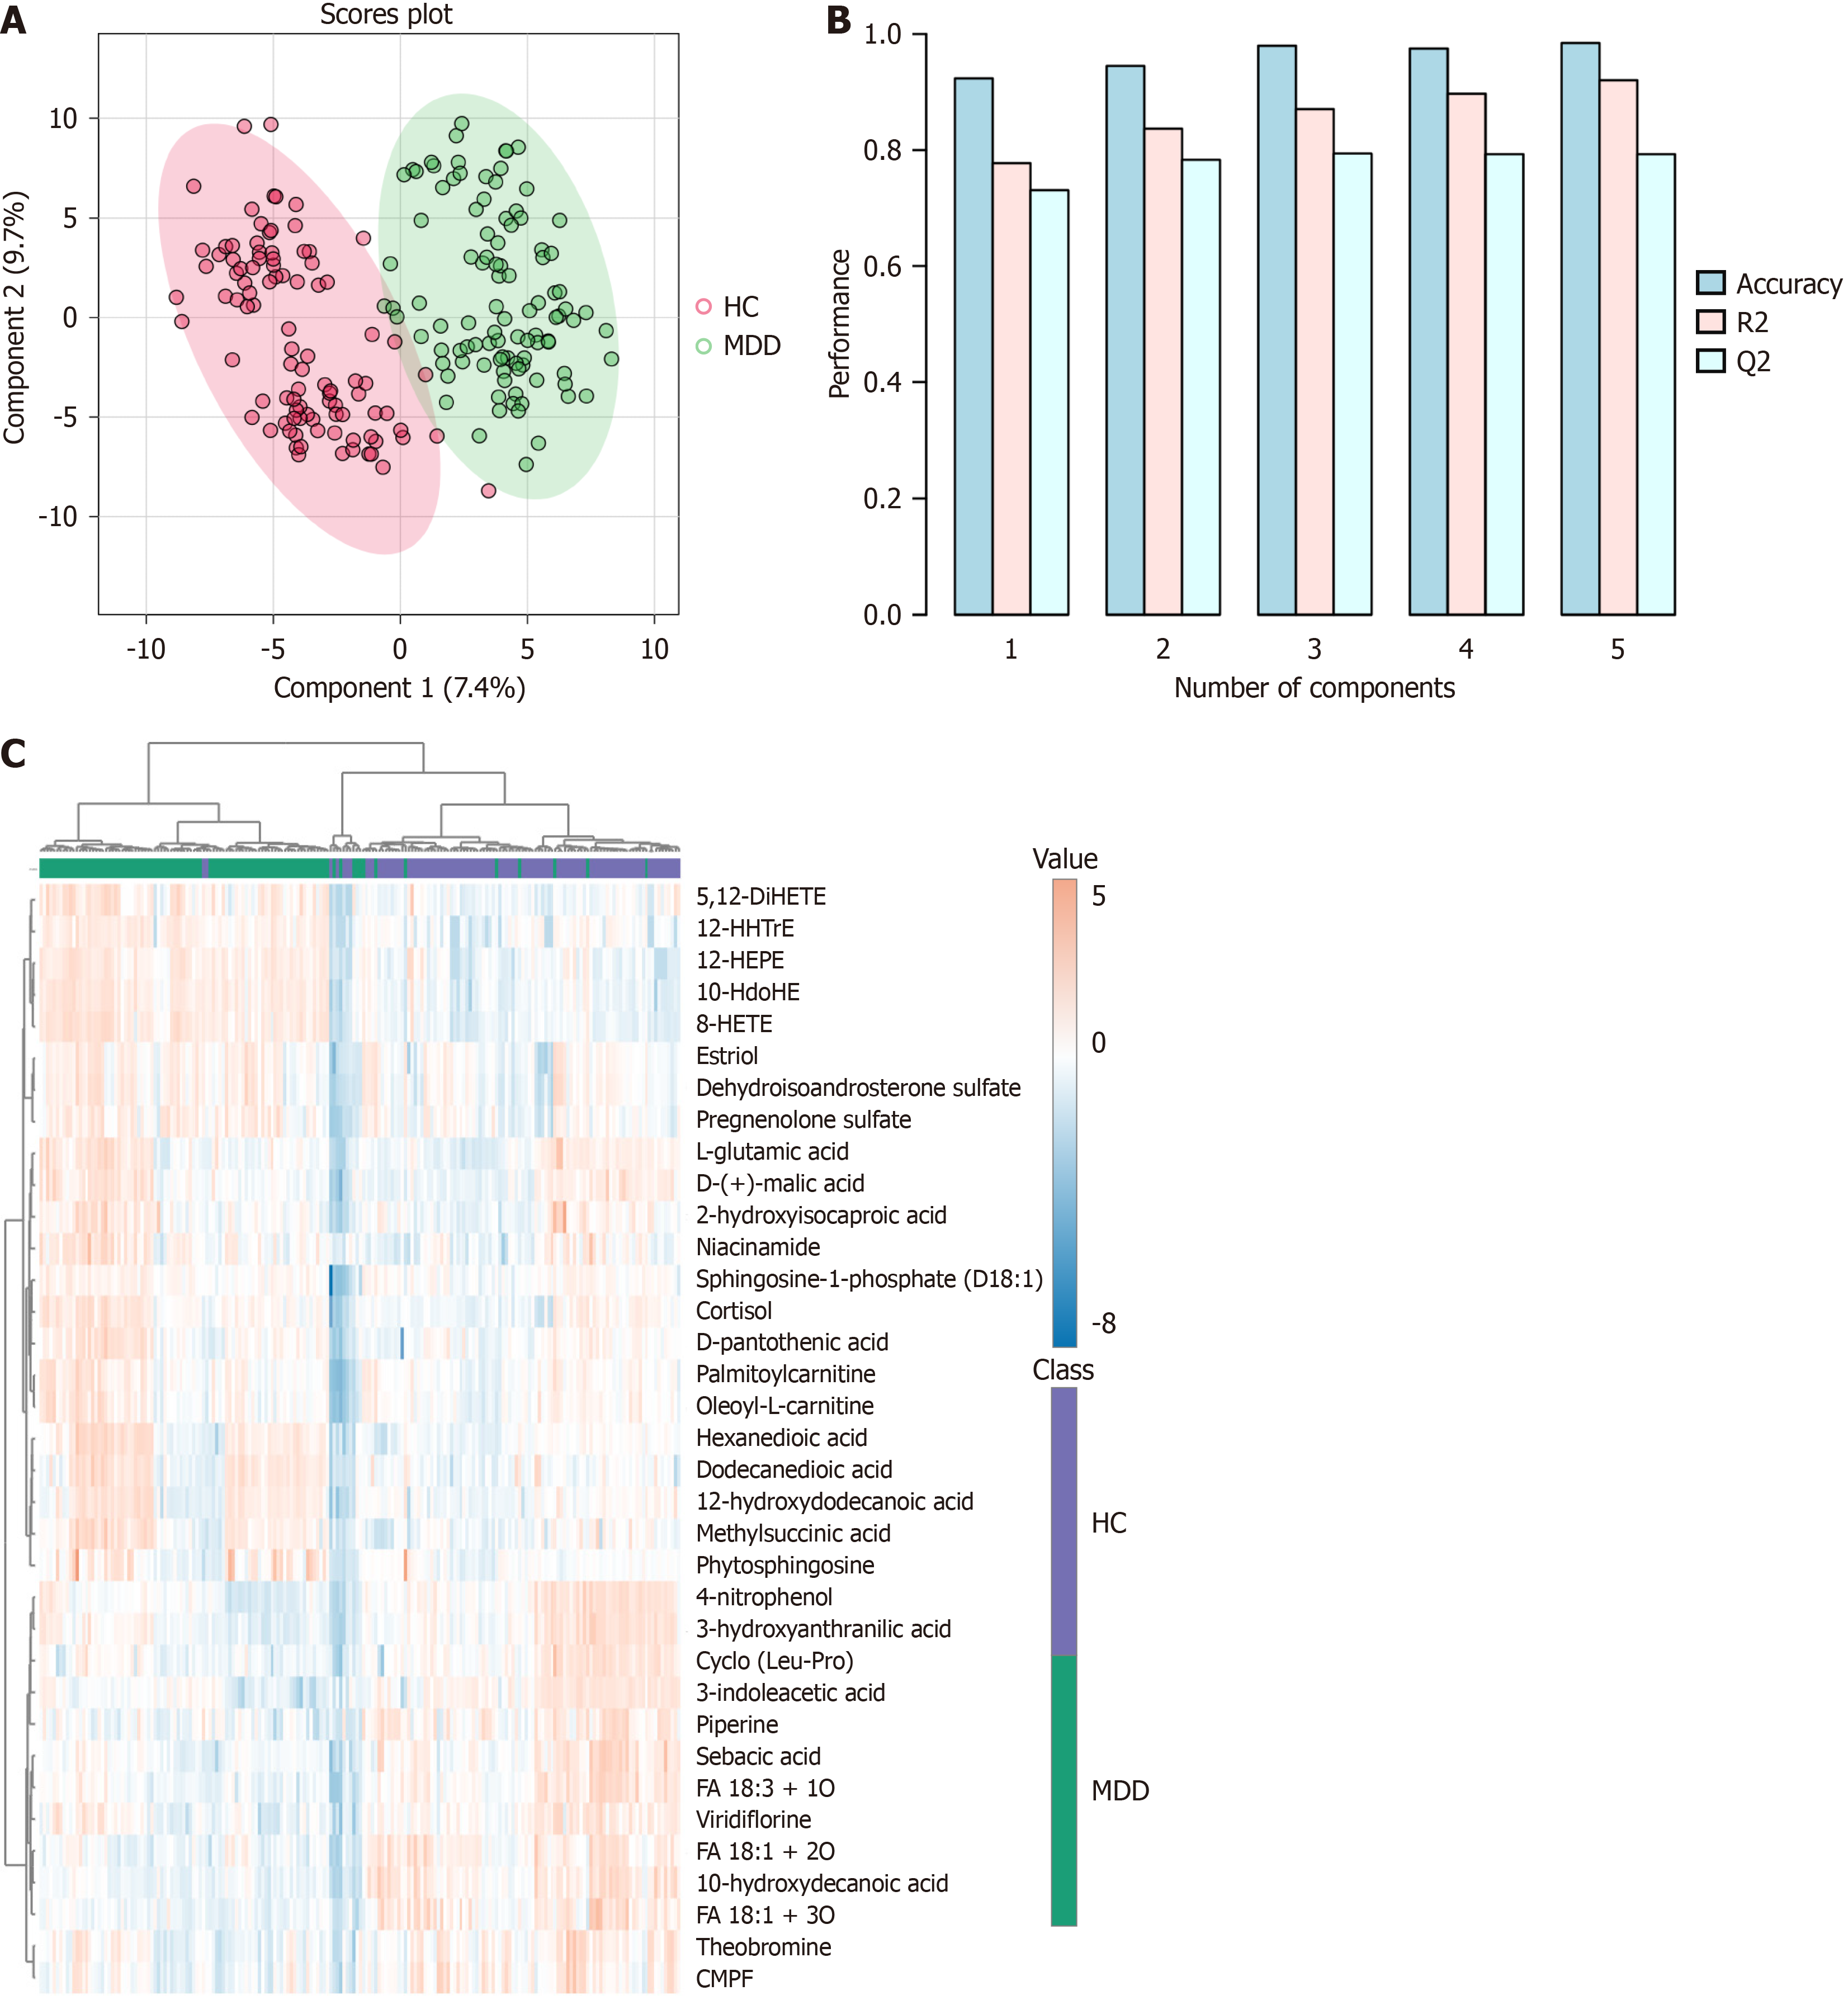
Figure 1 Metabolomic analysis of serum samples from major depressive disorder and healthy control groups.
A: 2D partial least squares discriminant analysis scores plot of top 2 components; B: Overview of the performance of the top 5 components; C: The heatmap of representative metabolites to distinguish major depressive disorder and healthy control. 1The model with three components has the highest Q2 value, thus demonstrating the best prediction performance. HC: Healthy control; MDD: Major depressive disorder; FA: Fatty acid; CMPF: 3-Carboxy-4-methyl-5-propyl-2-furanpropanoic acid.
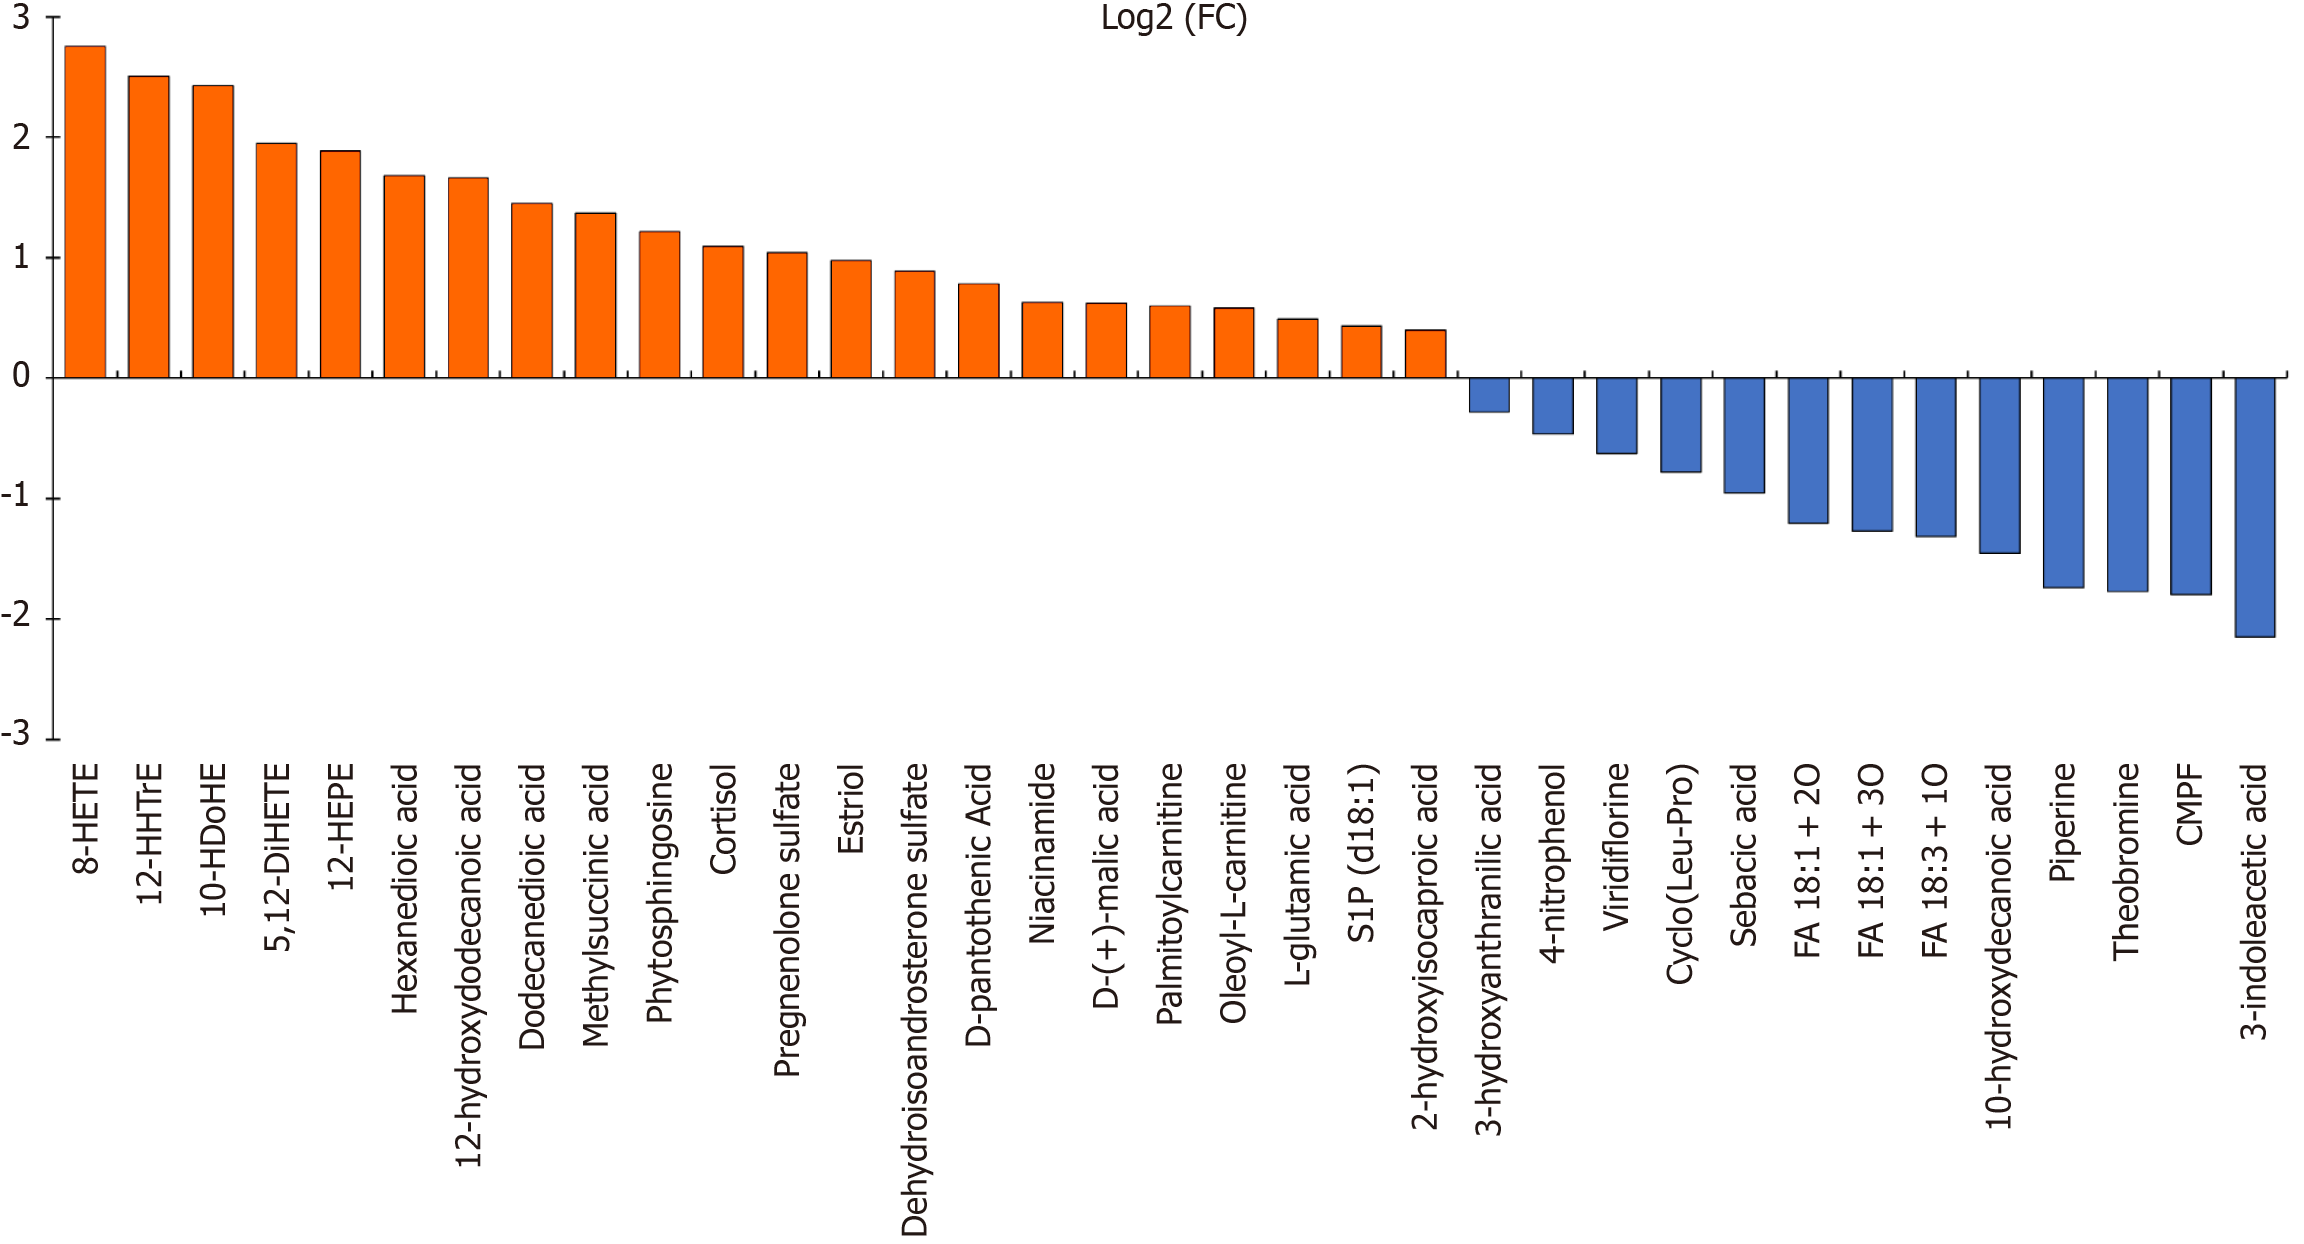
Figure 2 Total 35 differential metabolites between major depressive disorder and healthy control groups.
The abscissa represents each feature, and the ordinate represents the fold change after the log2 transformation. Red: Major depressive disorder (MDD) > healthy control (HC); Blue: MDD < HC. FC: Fold change; CMPF: 3-Carboxy-4-methyl-5-propyl-2-furanpropanoic acid.
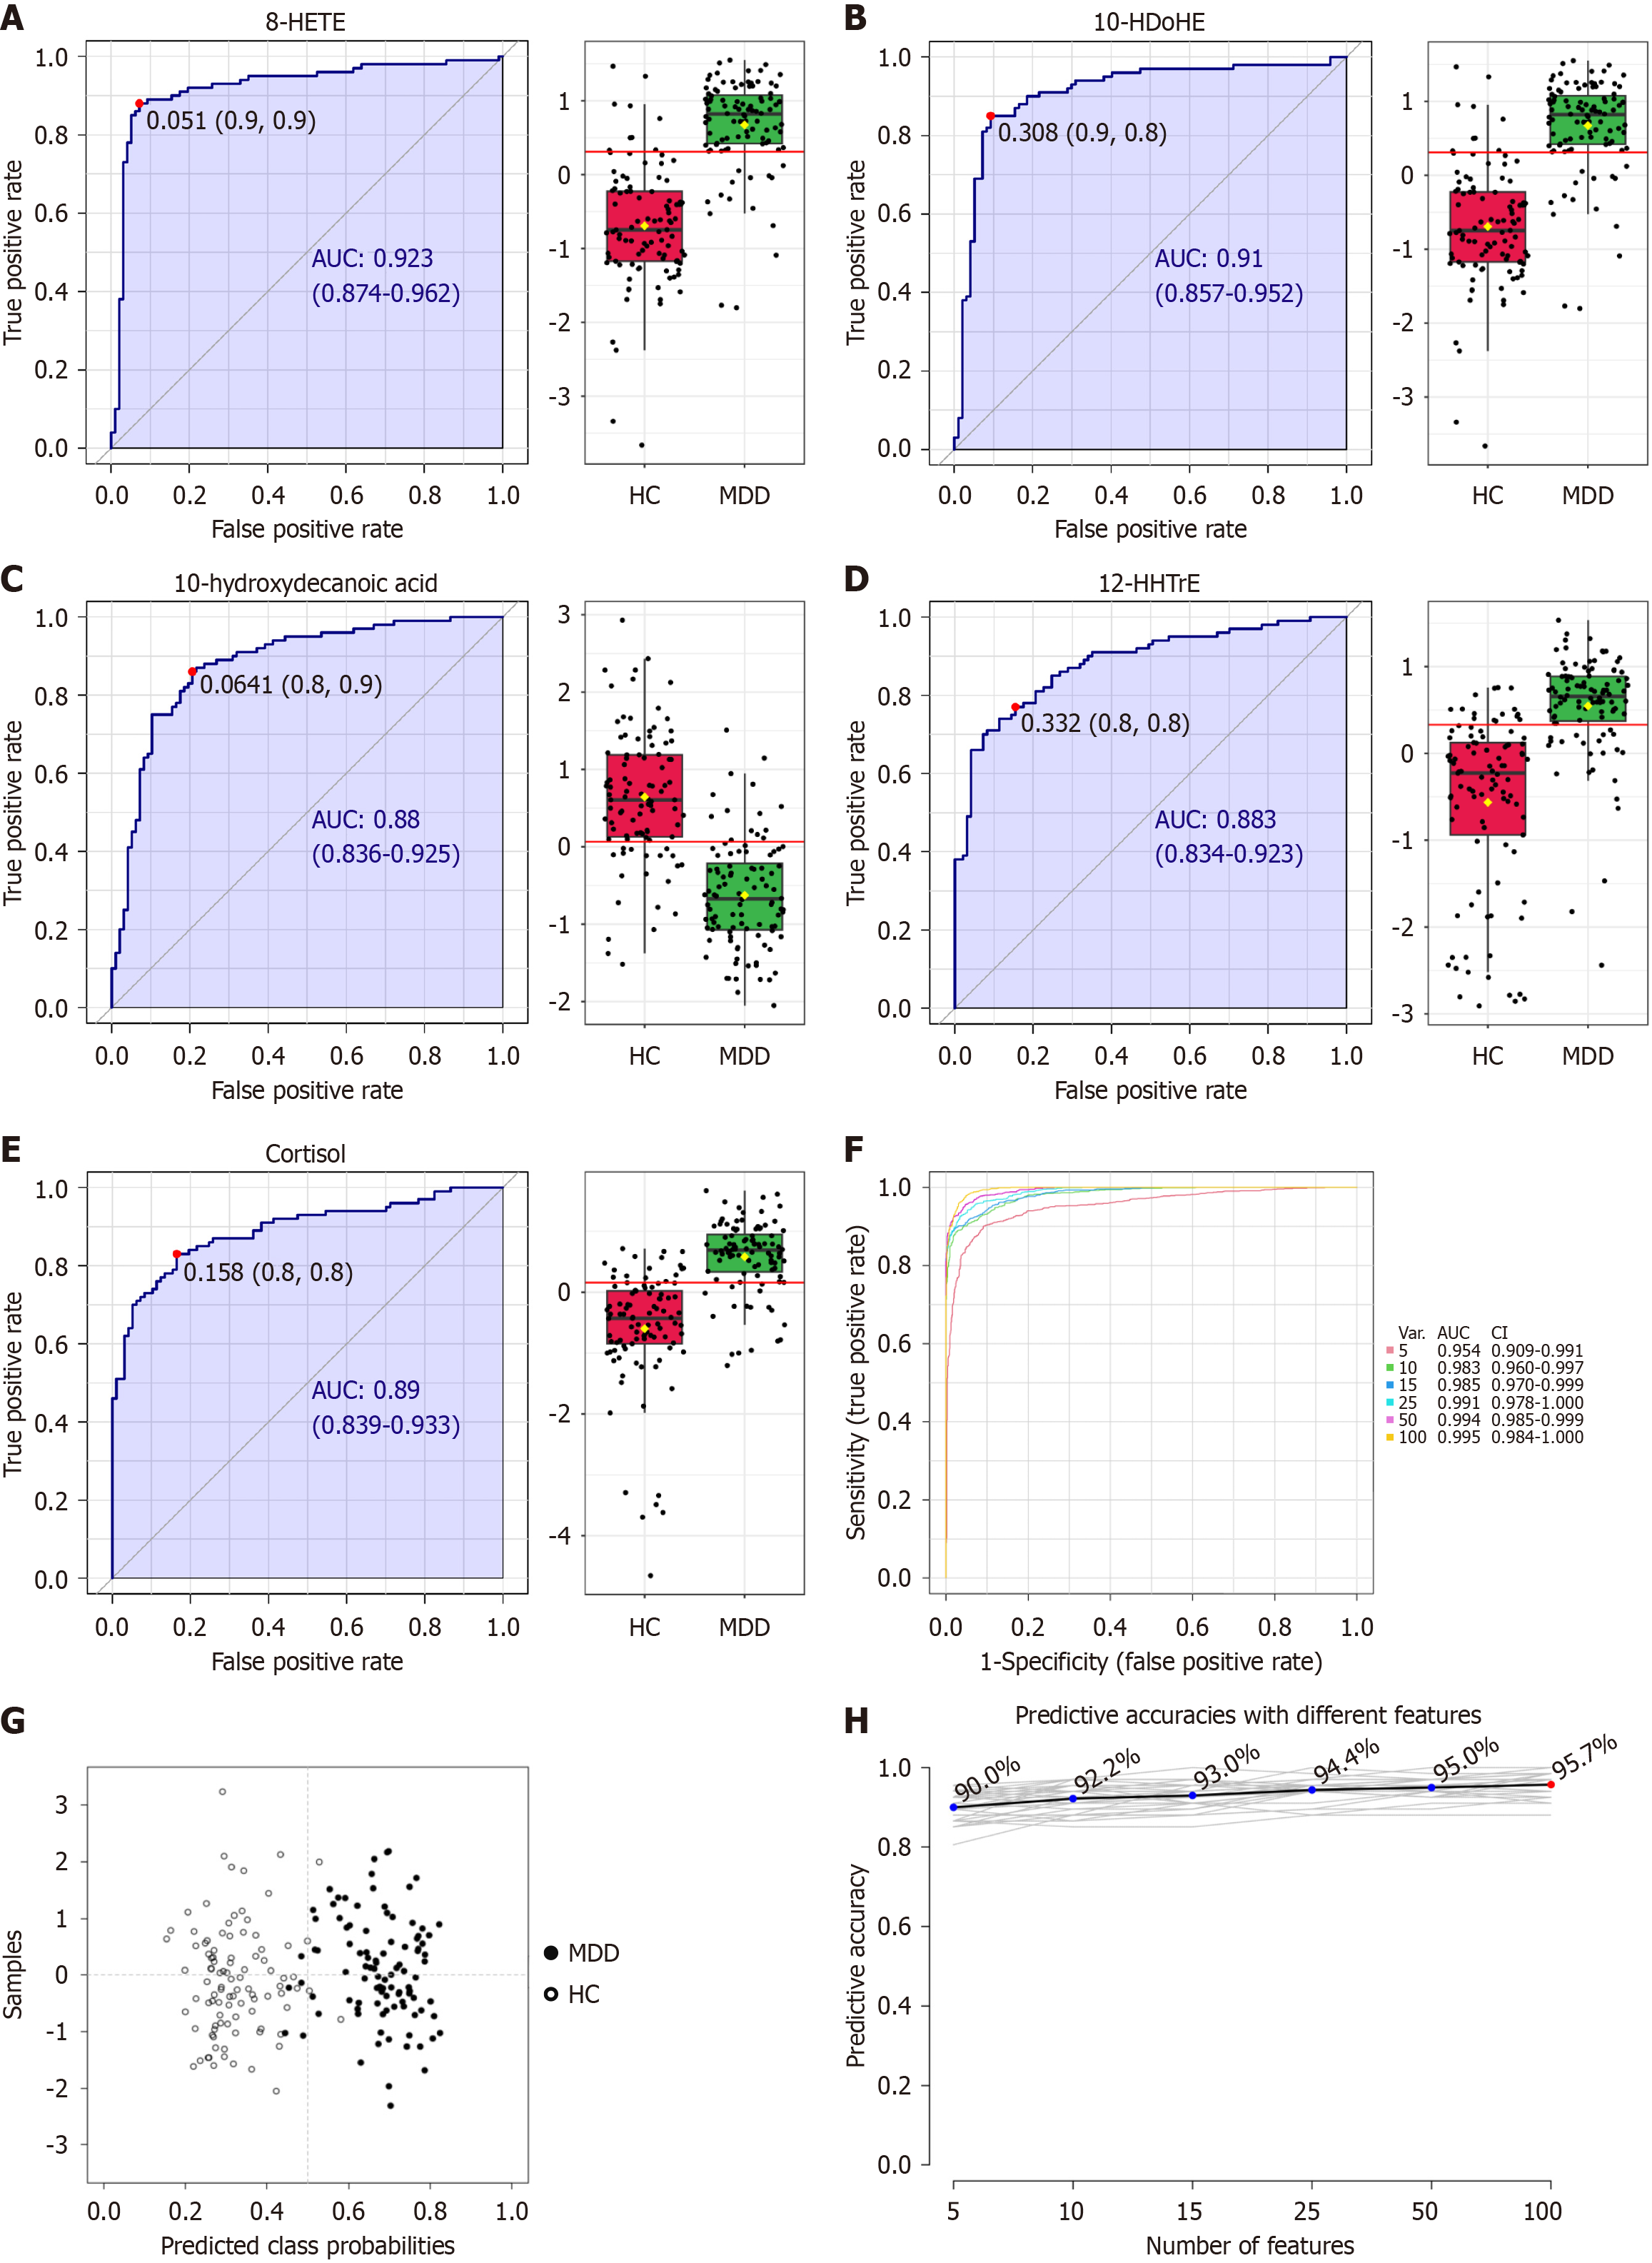
Figure 3 Receiver operating characteristic analysis revealing candidate metabolomic biomarkers for major depressive disorder diag
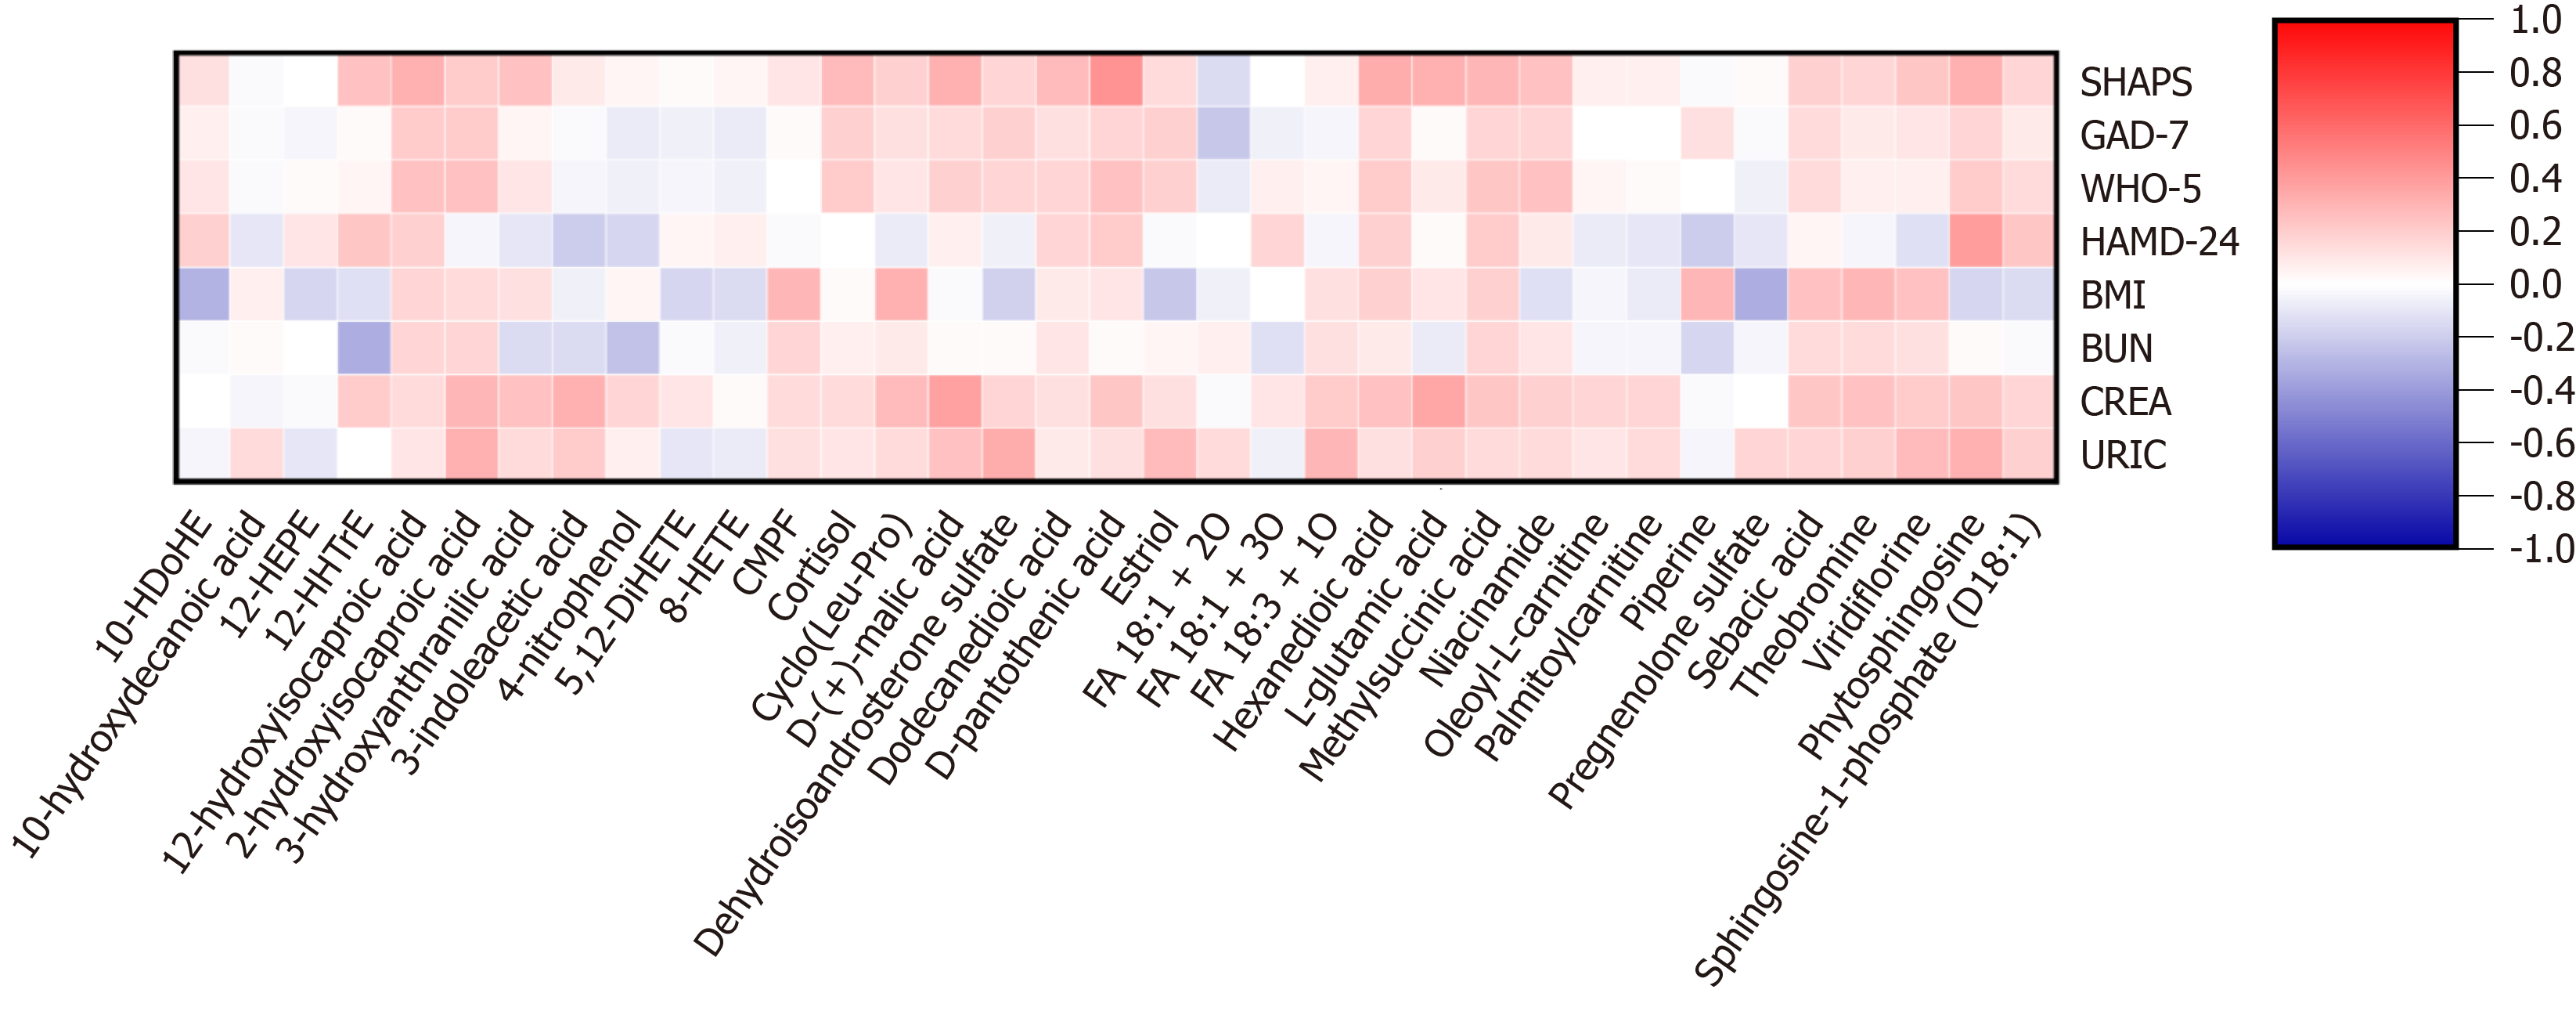
Figure 4 Spearman correlations of metabolites and clinical variables in patients with major depressive disorder and healthy controls.
The red background represents the positive correlations between the two compared variables, while the blue background represents the negative correlations. FA: Fatty acid; SHAPS: Snaith-Hamilton Pleasure Scale; GAD-7: Generalized Anxiety Disorder 7-item scale; WHO-5: 5-item World Health Organization Well-Being Index; HAMD-24: Hamilton Depression Rating Scale-24 items; BMI: Body mass index; BUN: Blood urea nitrogen; CREA: Creatinine; URIC: Uric acid; CMPF: 3-Carboxy-4-methyl-5-propyl-2-furanpropanoic acid.
- Citation: Cao B, Liu YL, Wang N, Huang Y, Lu CX, Li QY, Zou HY. Alterations of serum metabolic profile in major depressive disorder: A case-control study in the Chinese population. World J Psychiatry 2025; 15(5): 102618
- URL: https://www.wjgnet.com/2220-3206/full/v15/i5/102618.htm
- DOI: https://dx.doi.org/10.5498/wjp.v15.i5.102618


