Copyright
©The Author(s) 2025.
World J Psychiatry. May 19, 2025; 15(5): 102618
Published online May 19, 2025. doi: 10.5498/wjp.v15.i5.102618
Published online May 19, 2025. doi: 10.5498/wjp.v15.i5.102618
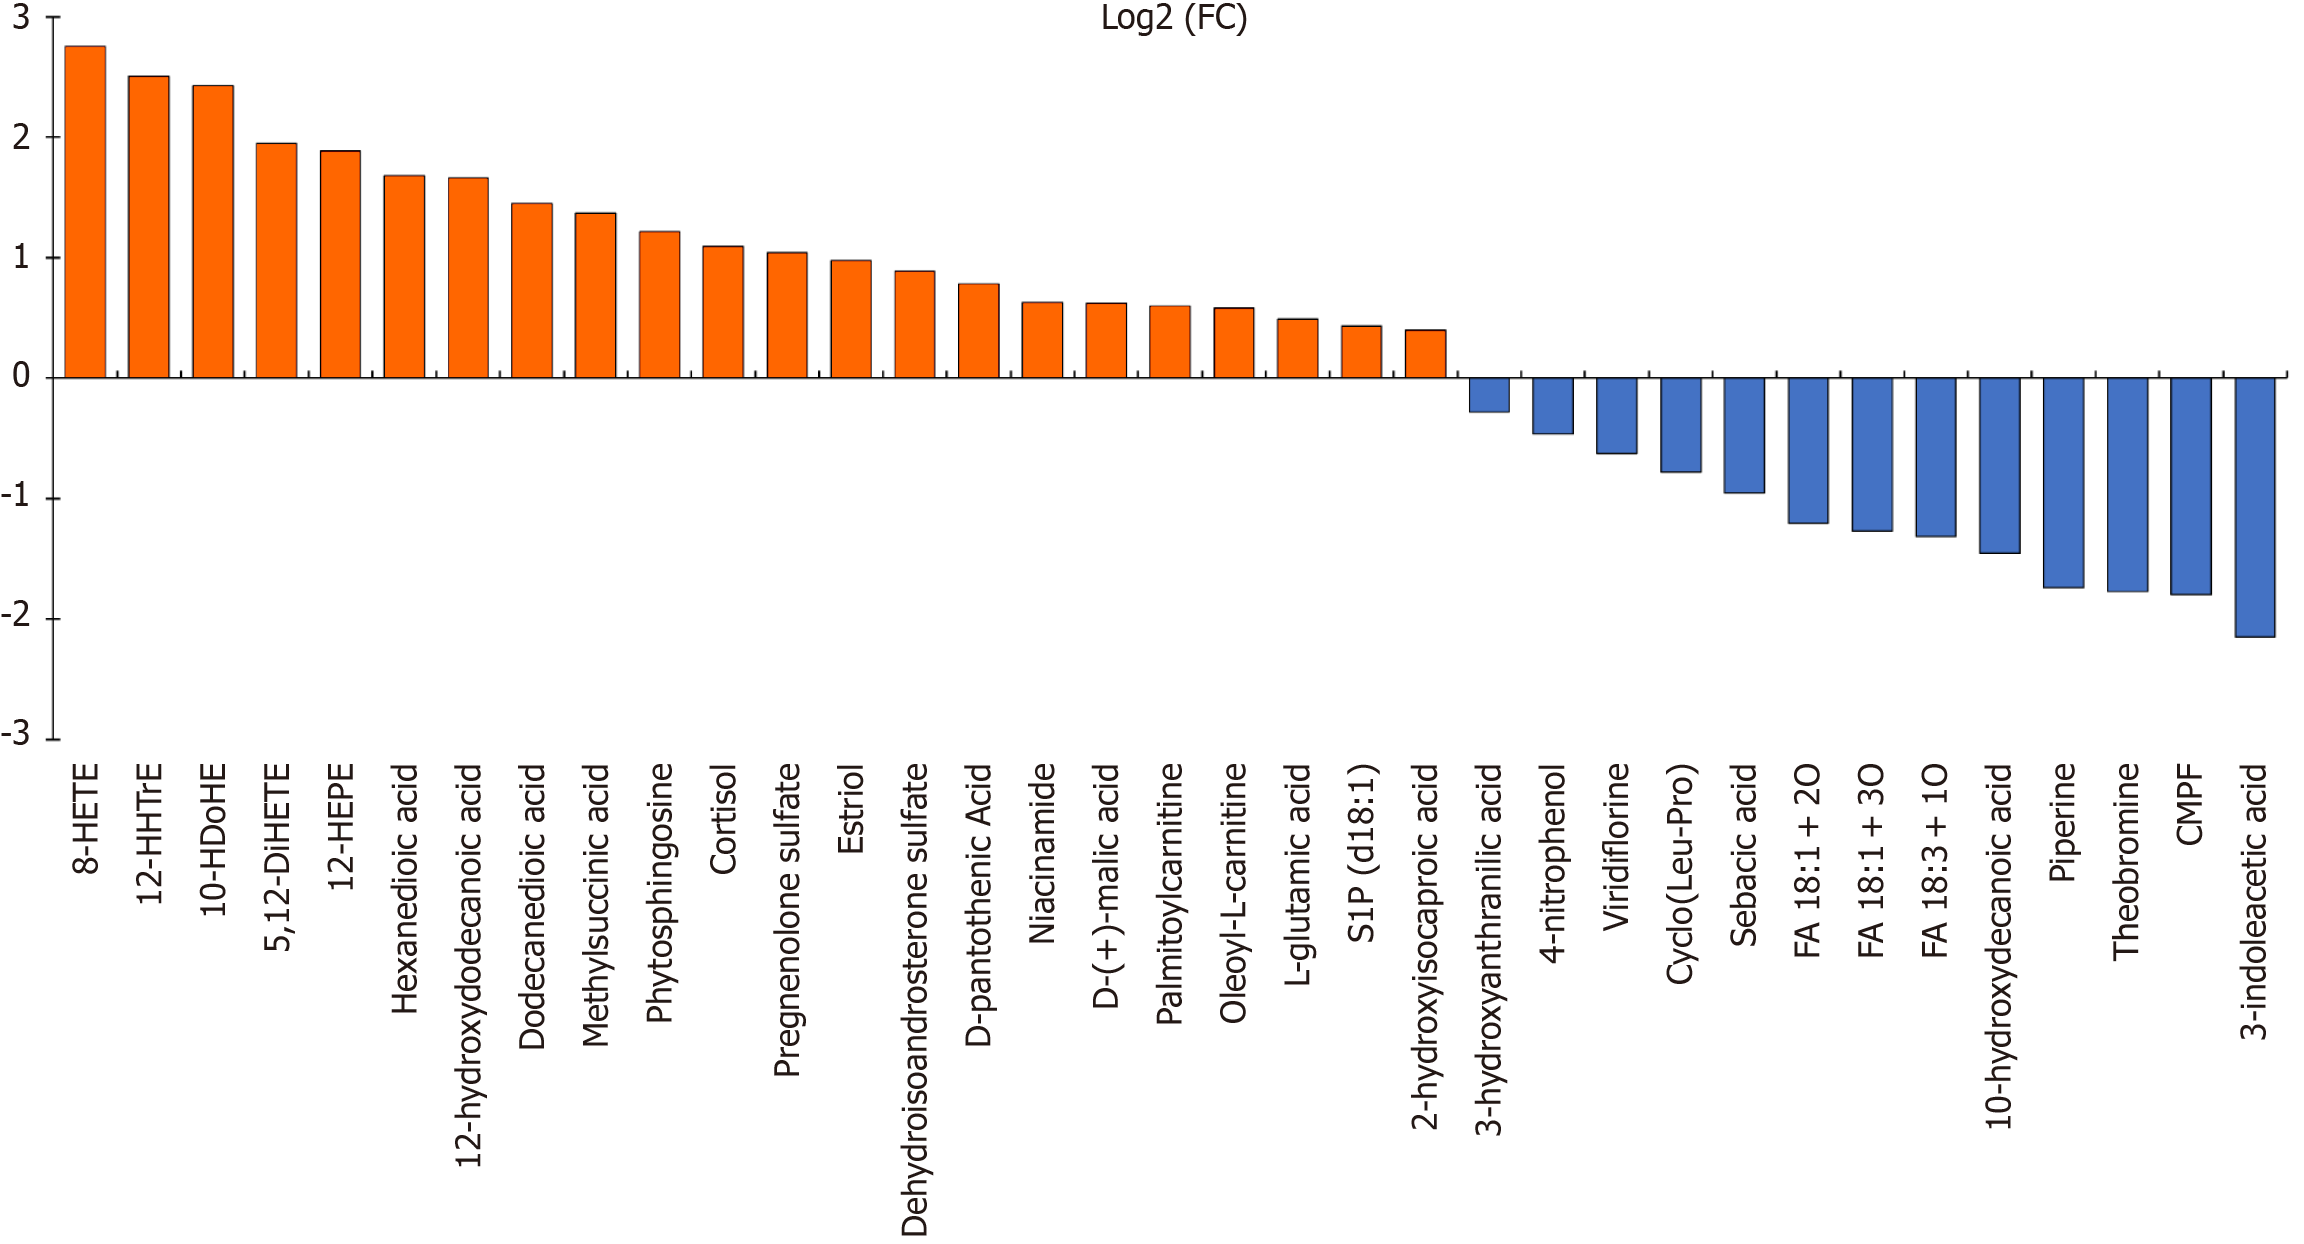
Figure 2 Total 35 differential metabolites between major depressive disorder and healthy control groups.
The abscissa represents each feature, and the ordinate represents the fold change after the log2 transformation. Red: Major depressive disorder (MDD) > healthy control (HC); Blue: MDD < HC. FC: Fold change; CMPF: 3-Carboxy-4-methyl-5-propyl-2-furanpropanoic acid.
- Citation: Cao B, Liu YL, Wang N, Huang Y, Lu CX, Li QY, Zou HY. Alterations of serum metabolic profile in major depressive disorder: A case-control study in the Chinese population. World J Psychiatry 2025; 15(5): 102618
- URL: https://www.wjgnet.com/2220-3206/full/v15/i5/102618.htm
- DOI: https://dx.doi.org/10.5498/wjp.v15.i5.102618


