Copyright
©The Author(s) 2021.
World J Psychiatr. Feb 19, 2021; 11(2): 35-49
Published online Feb 19, 2021. doi: 10.5498/wjp.v11.i2.35
Published online Feb 19, 2021. doi: 10.5498/wjp.v11.i2.35
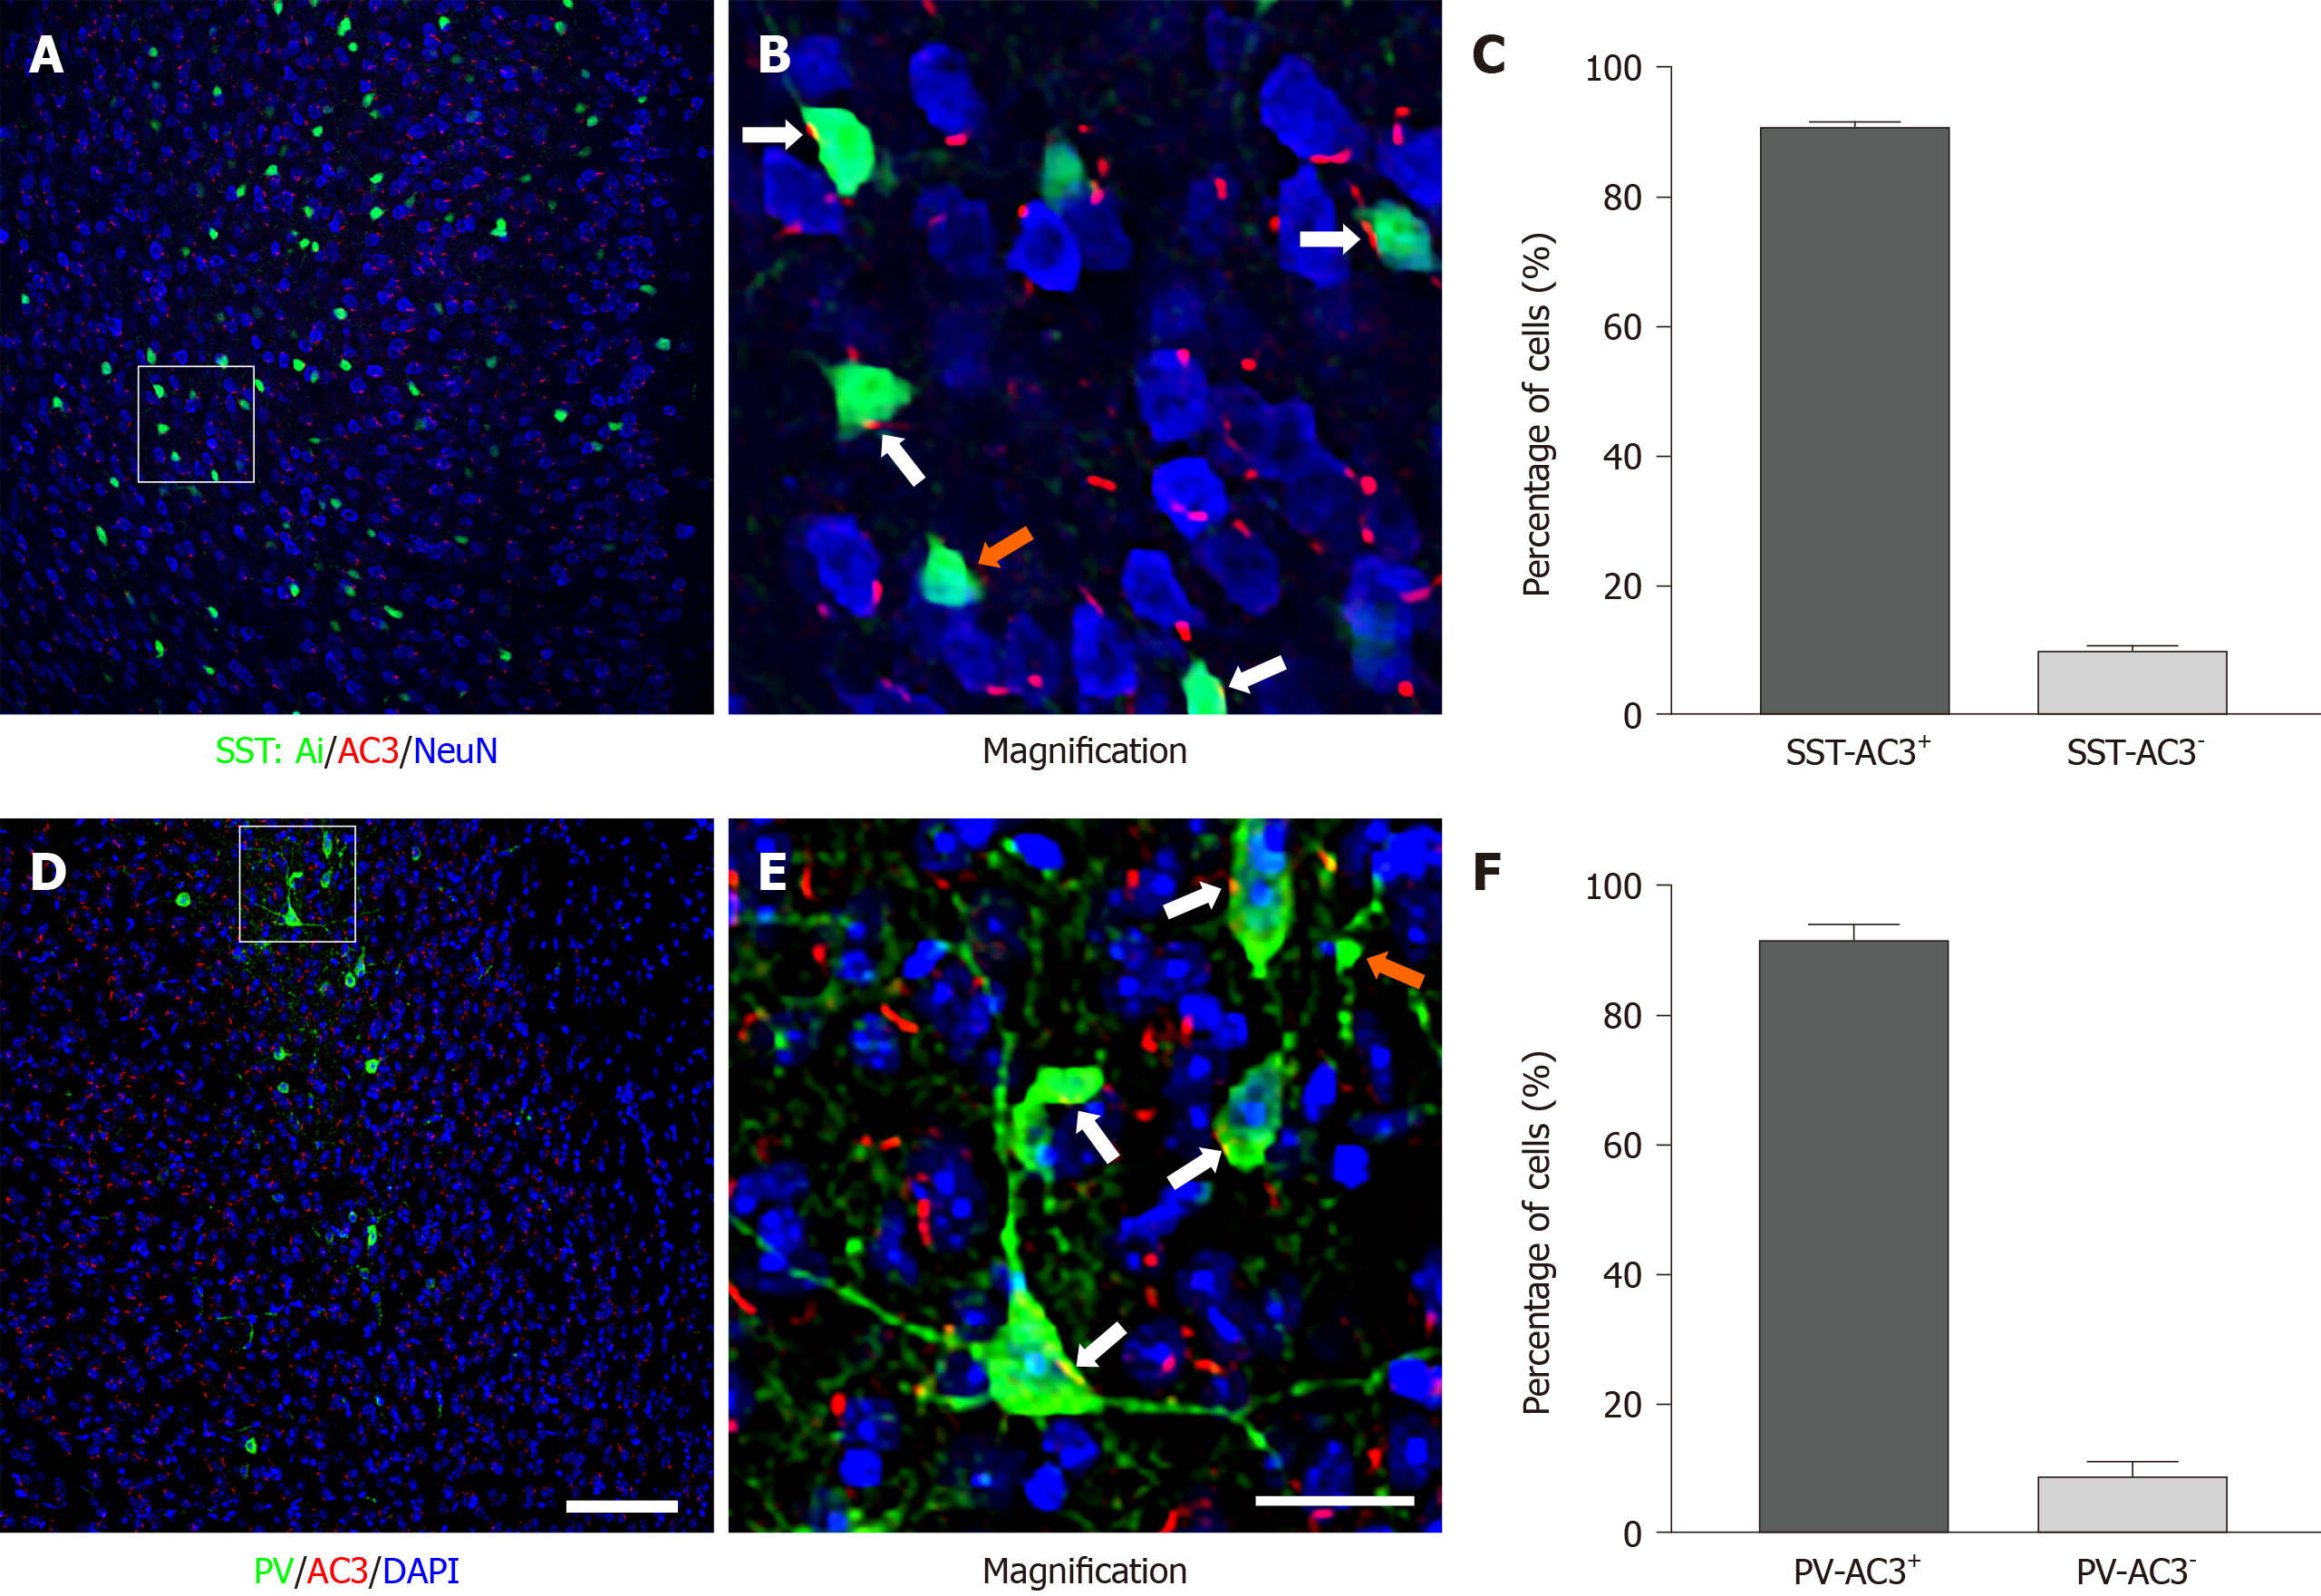
Figure 1 Expression of type 3 adenylyl cyclase in cortical somatostatin-positive and parvalbumin-positive GABAergic interneurons.
A and B: Representative images showing type 3 adenylyl cyclase (AC3) expression in somatostatin-positive (SST+) interneurons at low (A) and high (B) magnifications in the prefrontal cortex brain slice. Solid arrows in B indicate SST+ interneurons, which are also AC3-positve (SST-AC3+ cells). Empty arrow in B indicates SST+ interneurons, which are AC3-negative (SST-AC3- cells); C: Proportion of AC3 expressed in cortical SST+ neurons, n = 6; D and E: Representative images showing AC3 expression in parvalbumin-positive (PV+) interneurons at low (D) and high (E) magnifications in the prefrontal cortex brain slice. Solid arrows indicate PV+ interneurons, which are also AC3-positve (PV-AC3+ cells). Empty arrow in E indicates PV+ interneurons, which are AC3-negative (PV-AC3- cells); F: Proportion of AC3 expressing in cortical PV+ neurons, n = 5. Scale bars represent 100 μm in D and 20 μm in E, respectively.
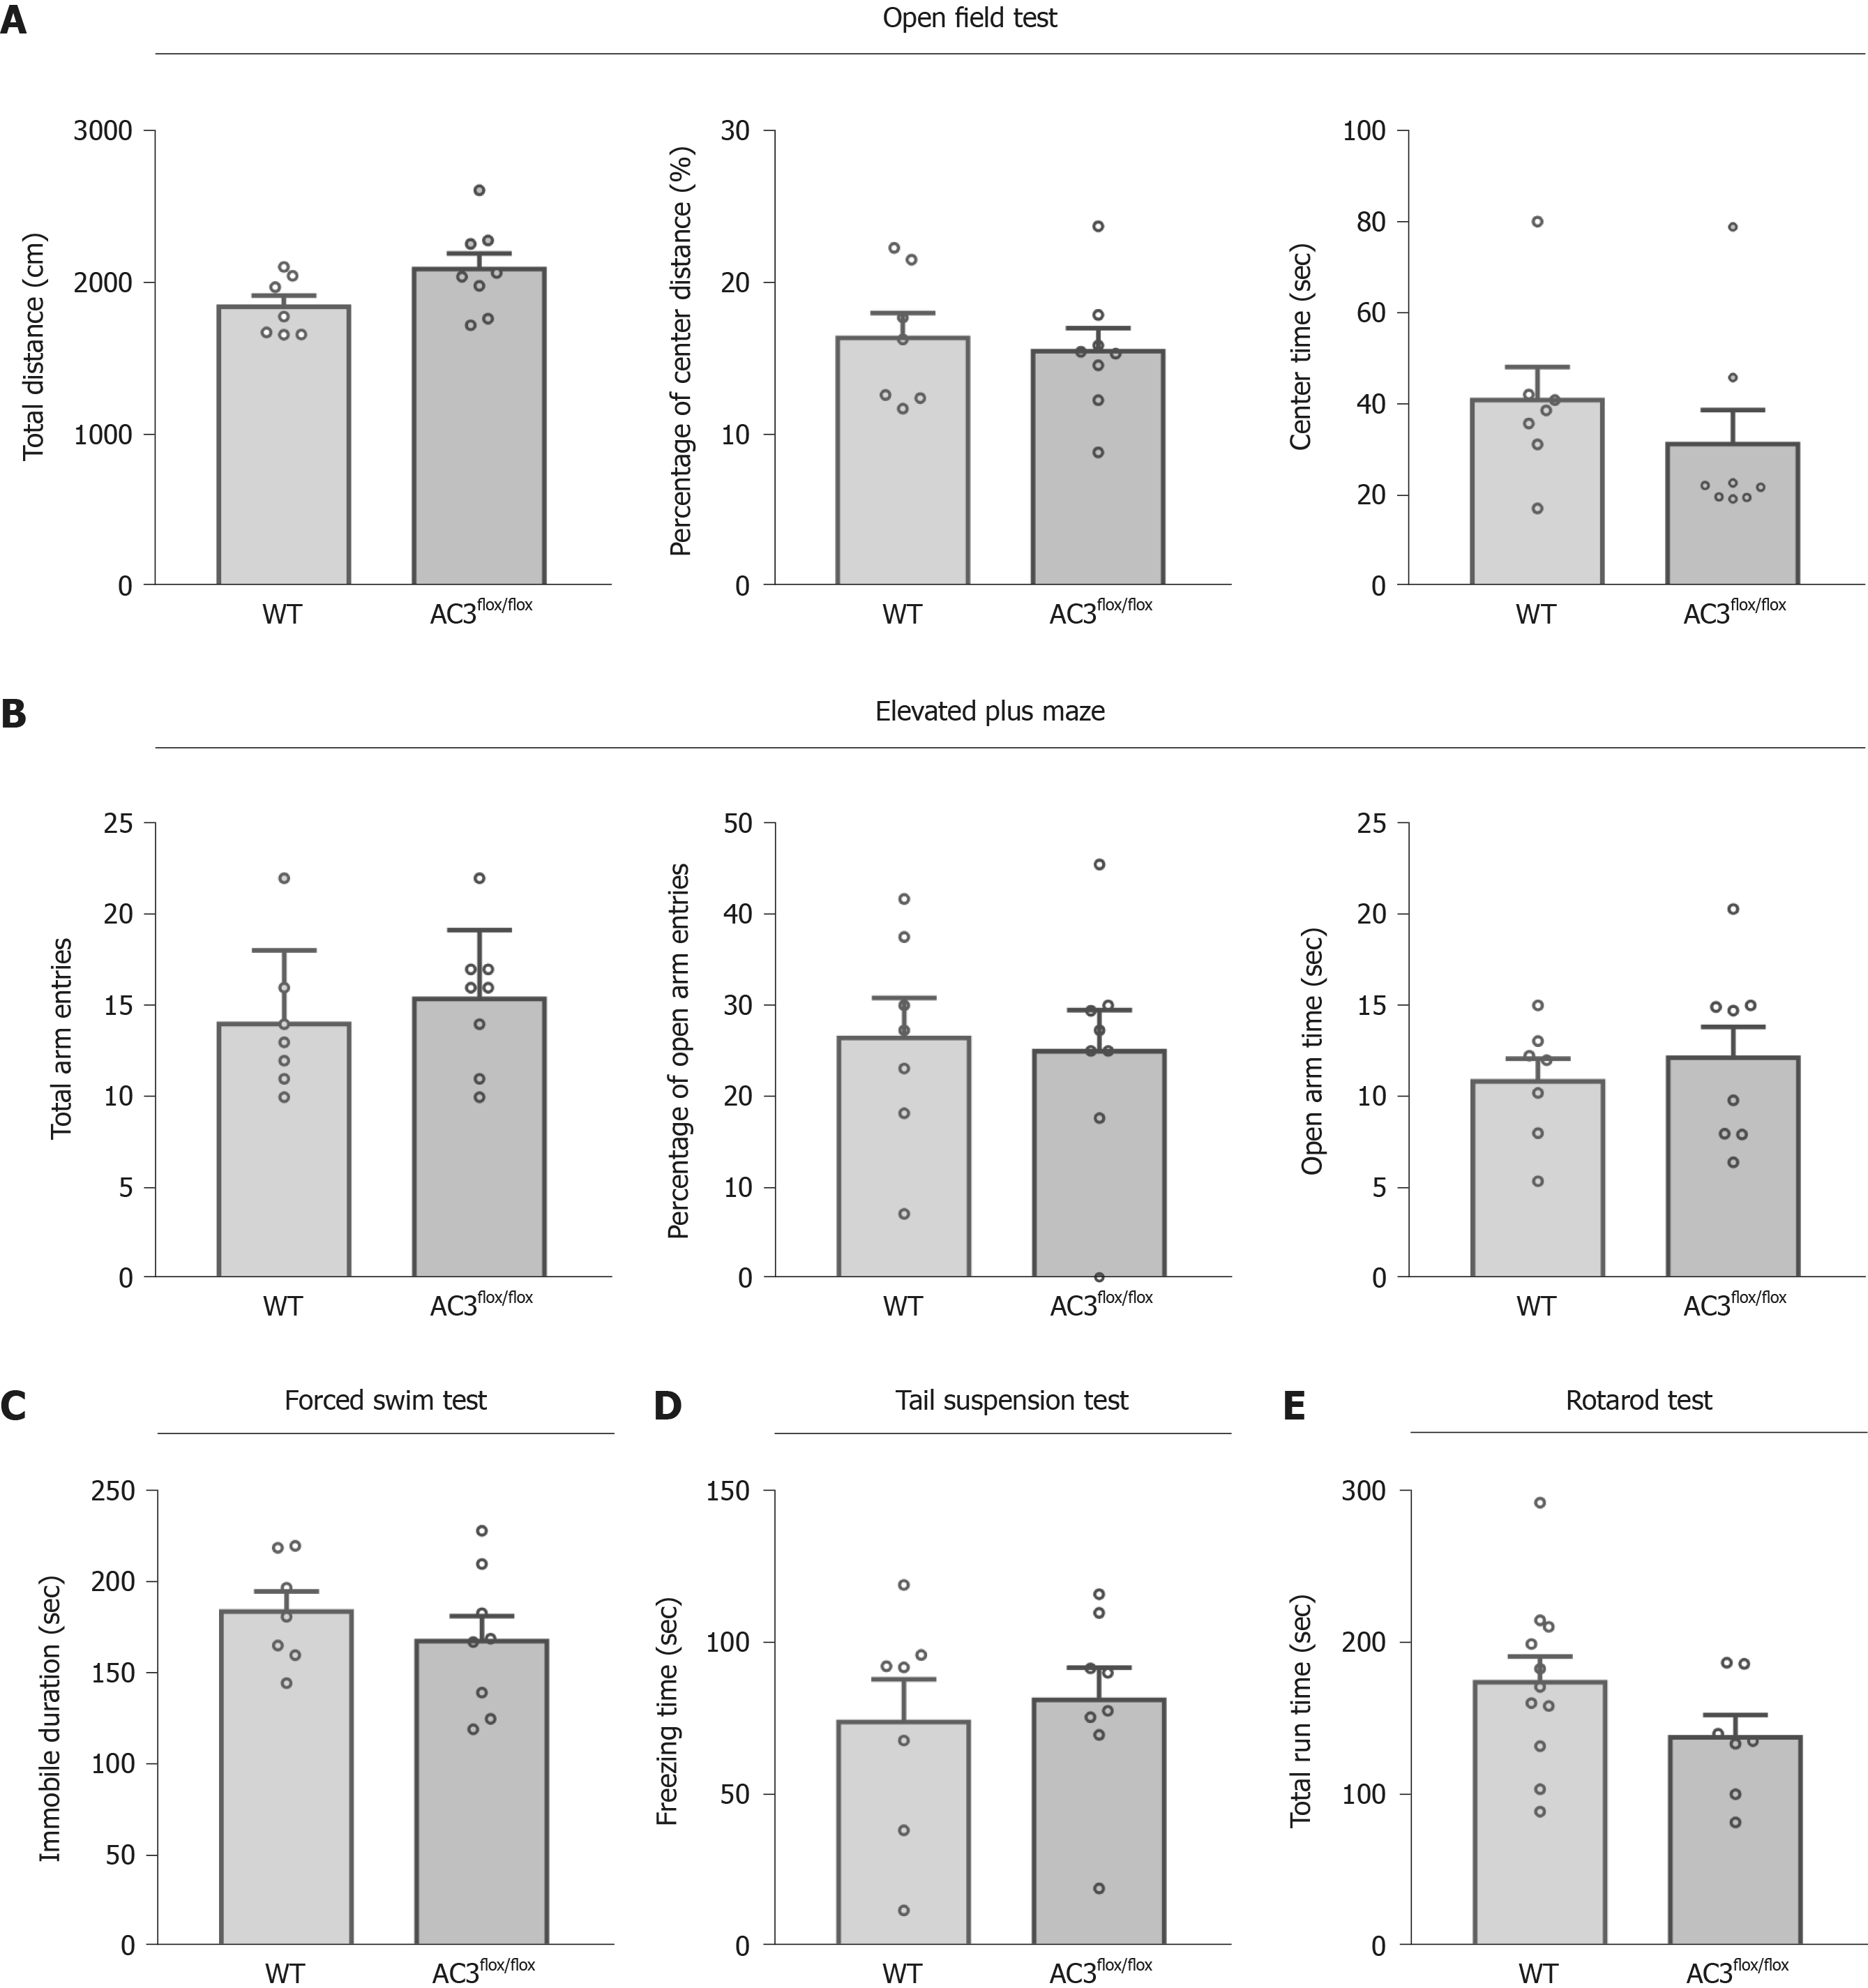
Figure 2 Type 3 adenylyl cyclaseflox/flox mice exhibit normal emotion-related behaviors and motor ability compared with wild-type C57 mice.
A and B: Anxiety-related behavioral tests were illustrated by the open field test (A) and elevated plus maze (B); C and D: Depression-like behavioral tests were examined by the forced swimming test (C) and tail suspension test (D); E: Motor ability was examined by the rotarod test. Bars represent the mean ± standard error of the mean. Data were analyzed using the Student’s t-test. n = 7 for the wild-type (WT) group, n = 8 for the type 3 adenylyl cyclase (AC3)flox/flox group.
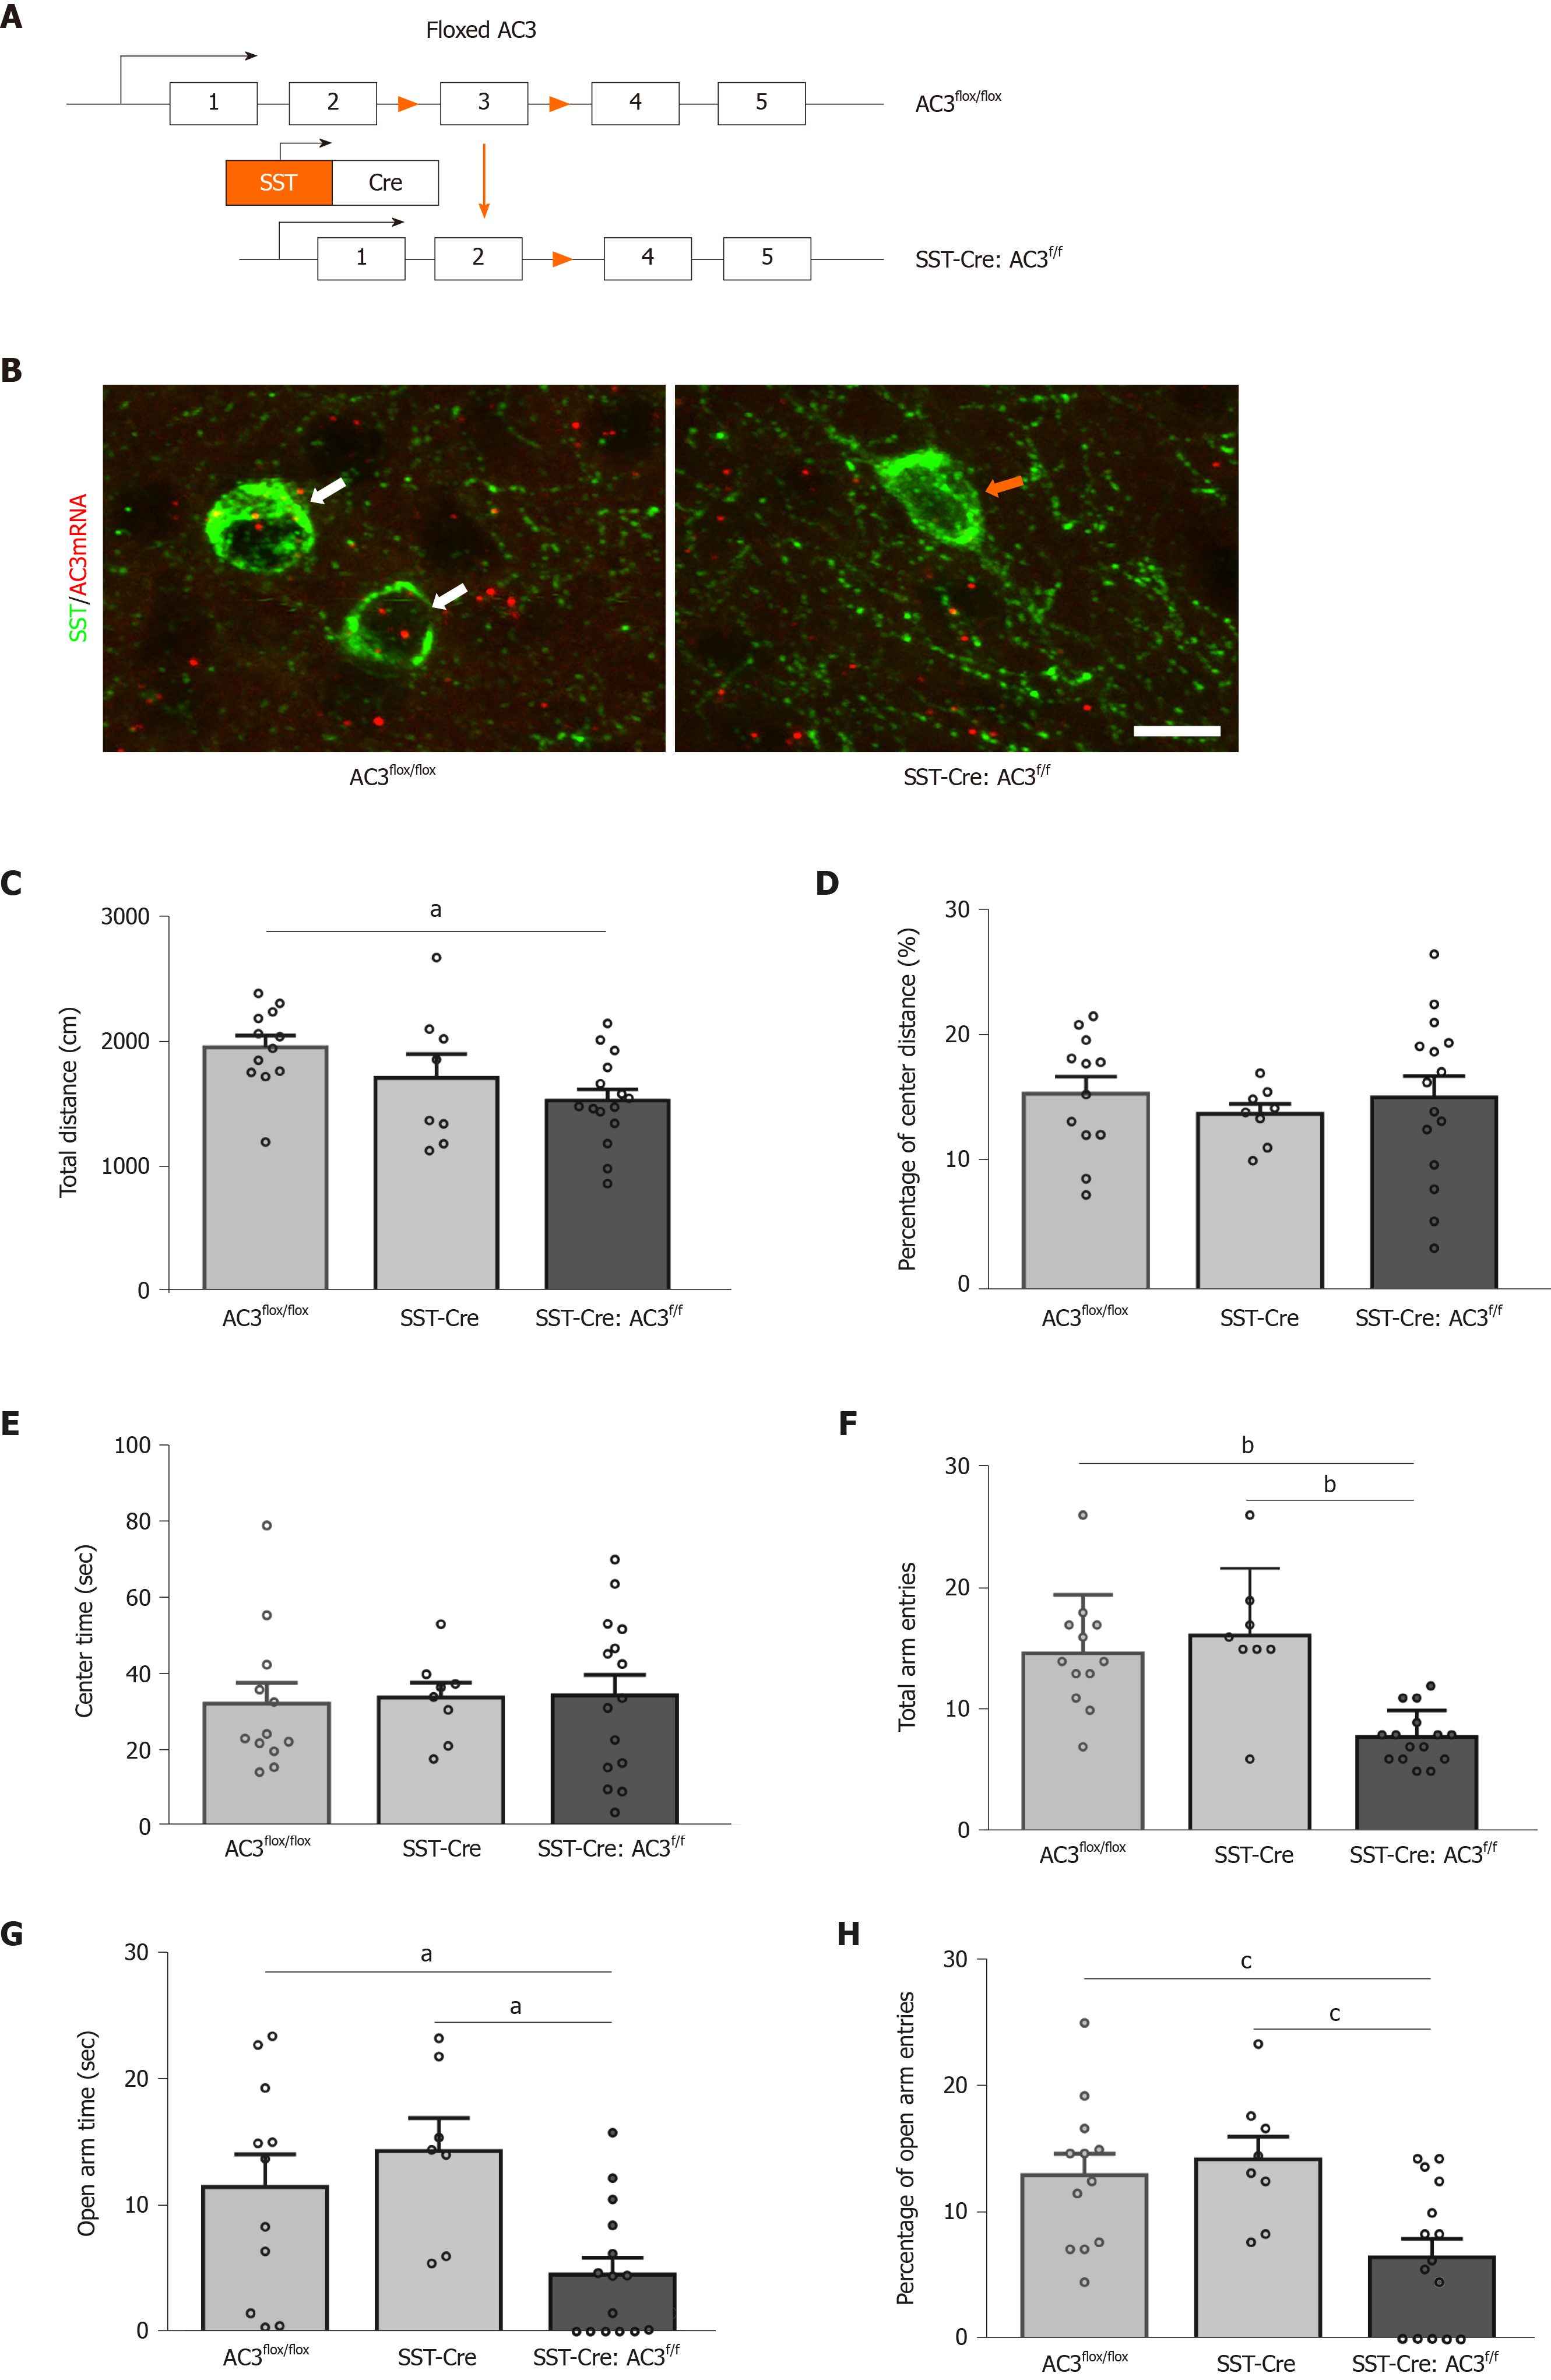
Figure 3 Somatostatin-positive-Cre recombinase:type 3 adenylyl cyclasef/f mice showed anxiety-like behavior.
A: Strategy for generation of somatostatin-positive-Cre recombinase: type 3 adenylyl cyclasef/f (SST-Cre:AC3f/f) mice in which type 3 adenylyl cyclase (AC3, ADCY3) was selectively ablated in SST+ interneurons; B: Fluorescence in situ hybridization showing the representative micrographs of ADCY3 mRNA expression (red) in SST+ interneurons (green) from AC3flox/flox control mice (left) and SST-Cre:AC3f/f mice (right). Solid arrows indicated that SST+ interneurons are co-expressed ADCY3 mRNA in AC3flox/flox control mice. Empty arrow indicated that ADCY3 mRNA fluorescence is missing in SST+ interneurons in SST-Cre:AC3f/f mice. Scale bar: 10 μm; C-E: Showing SST-Cre:AC3f/f mice showed less total distance (C) but comparable percentage of center distance (D) and center time (E) in the open field test; F-H: SST-Cre:AC3f/f mice exhibited decreased total arm entries (F), open arm time (G) and percentage of open arm entries (H) in the elevated plus maze test. Bars represent the mean ± standard error of the mean. Data were analyzed using one-way analysis of variance followed by post hoc Tukey’s multiple comparisons test. n = 12 for AC3flox/flox group, n = 8 for SST-Cre group, n = 15 for SST-Cre:AC3f/f group. aP < 0.05 vs AC3flox/flox. bP < 0.01 vs AC3flox/flox. cP < 0.01 vs SST-Cre. dP < 0.05 vs SST-Cre. eP < 0.001 vs SST-Cre.
Figure 4 Somatostatin-Cre recombinase:type 3 adenylyl cyclasef/f mice showed depression-like behavior.
A and B: Somatostatin-Cre recombinase (SST-Cre):type 3 adenylyl cyclase (AC3)f/f mice showed increased immobile duration in forced swimming test (A) and more freezing time in tail suspension test (B). Bars represent the mean ± standard error of the mean. Data were analyzed using one-way analysis of variance followed by post hoc Tukey’s multiple comparisons test. n = 12 for AC3flox/flox group, n = 8 for SST-Cre group, n = 15 for SST-Cre:AC3f/f group. fP < 0.001 vs AC3flox/flox. gP < 0.05 vs SST-Cre. .
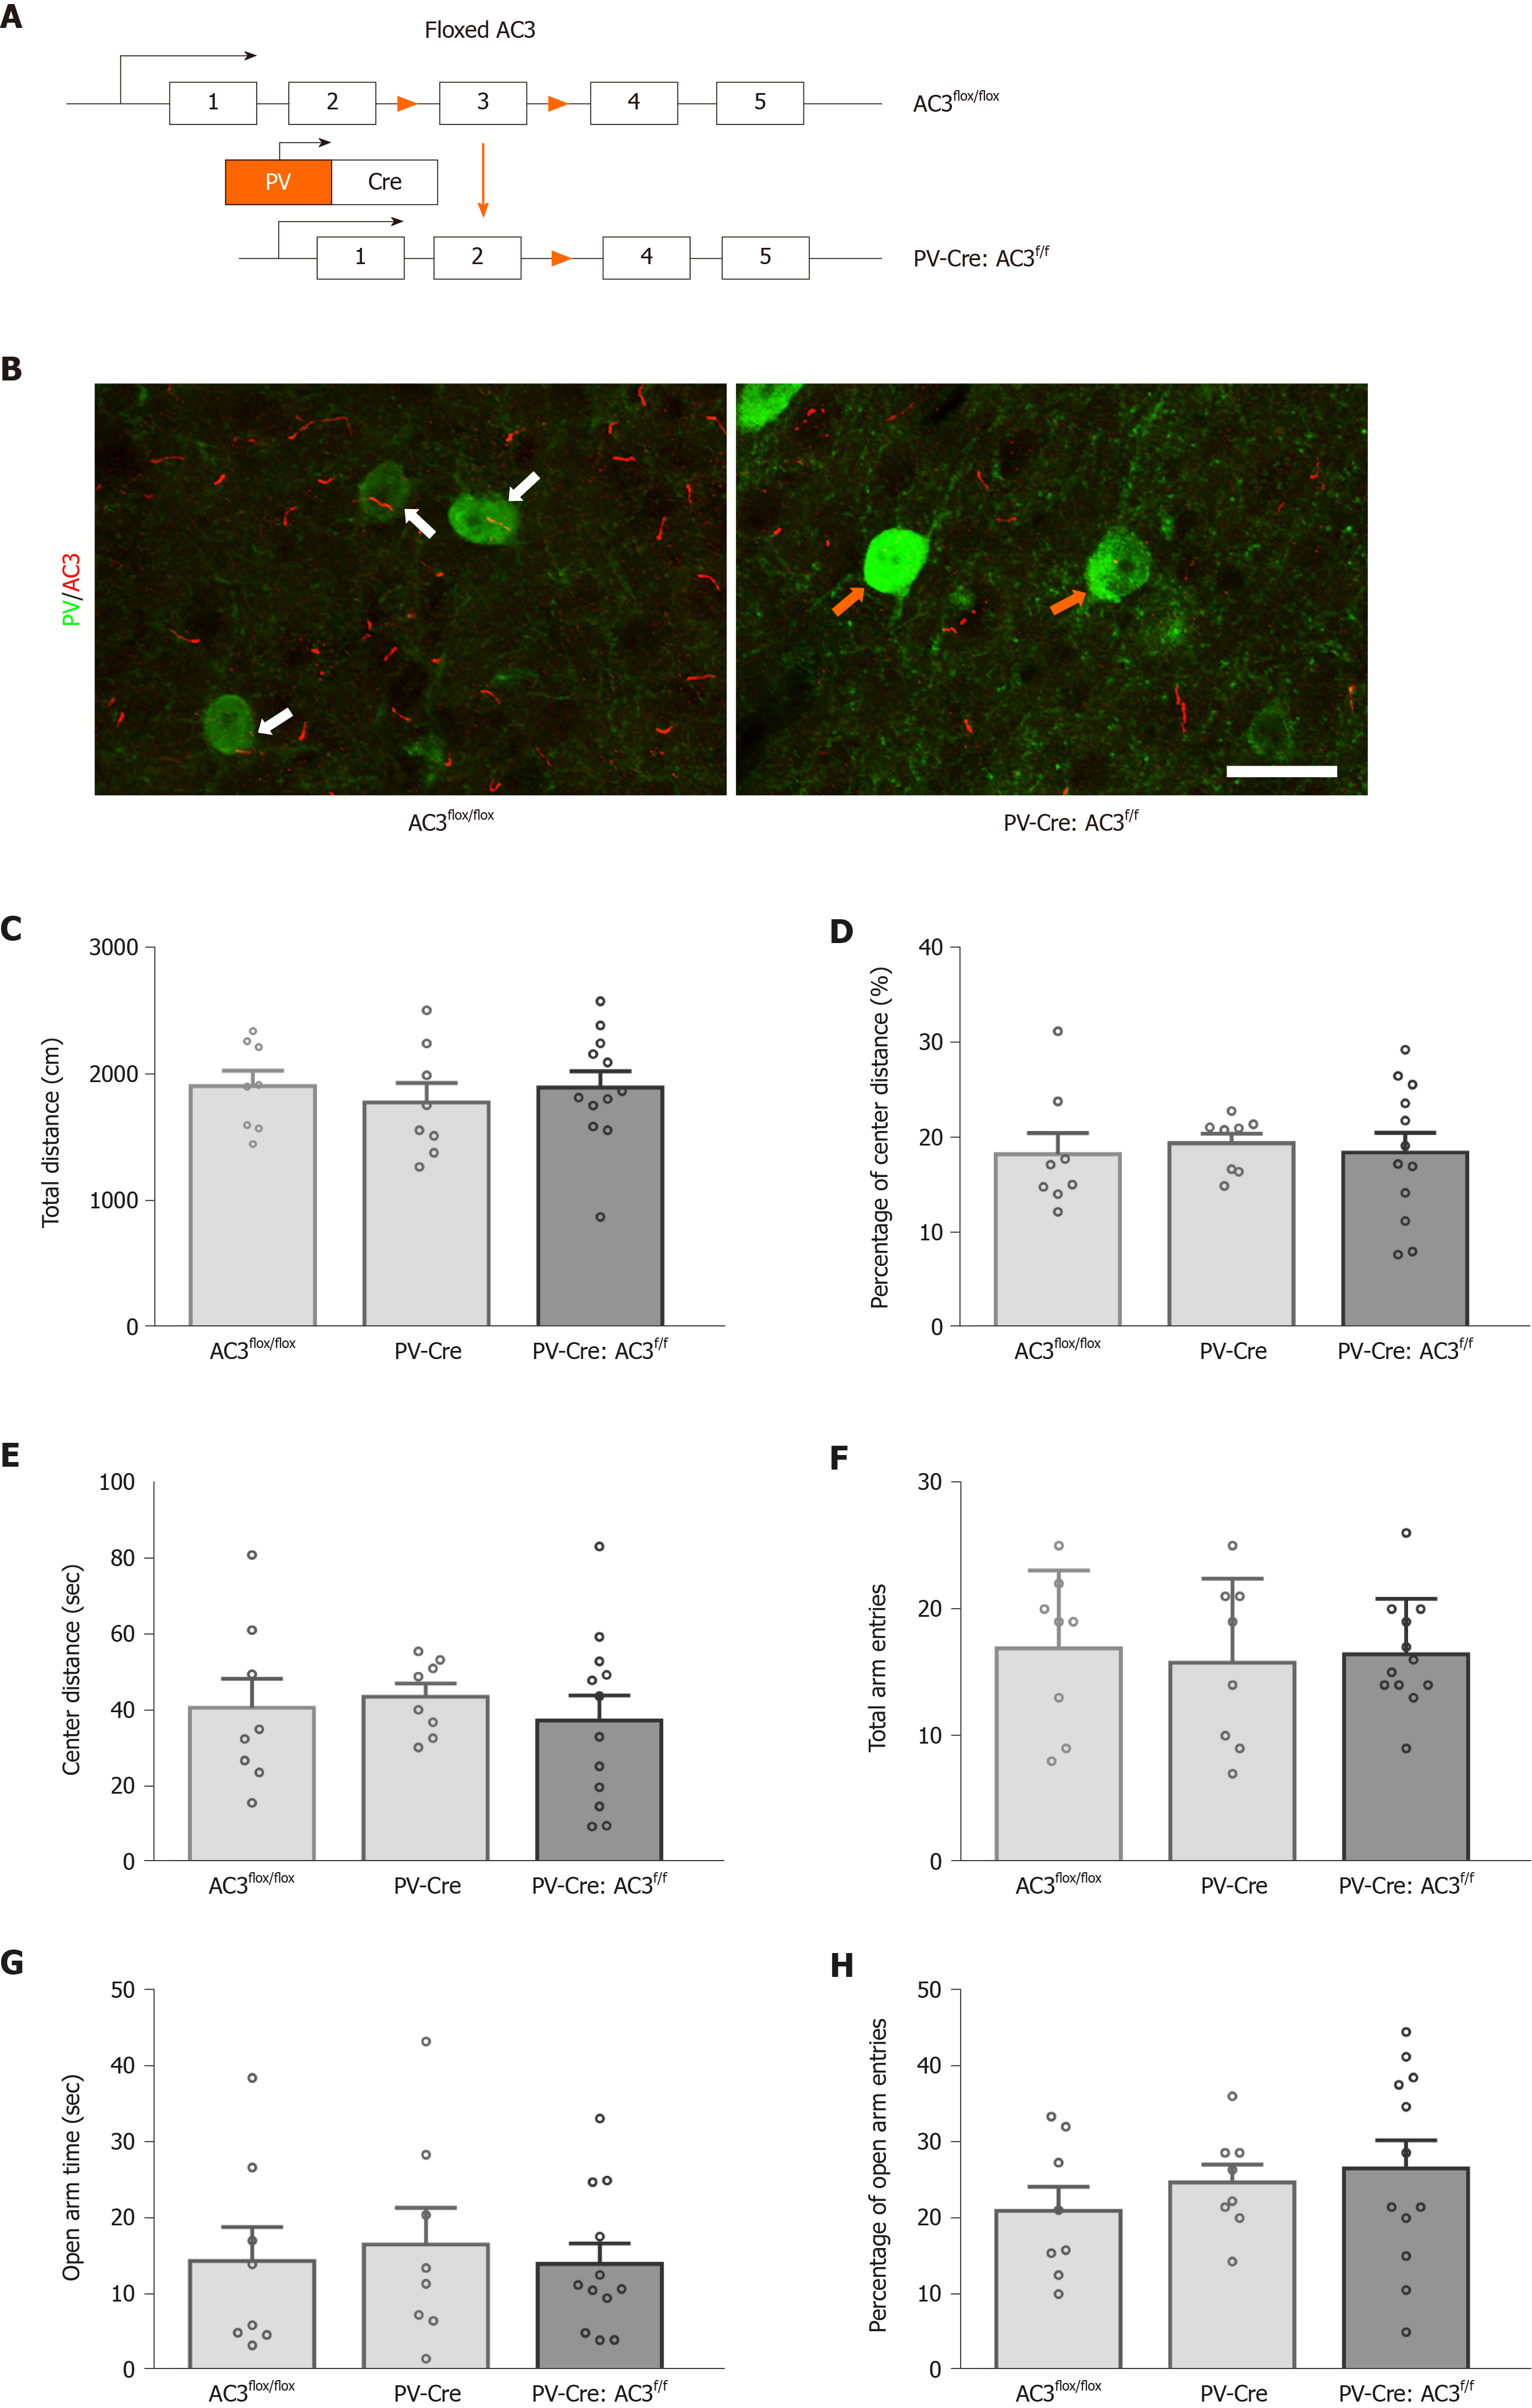
Figure 5 Parvalbumin-Cre recombinase:type 3 adenylyl cyclasef/f mice did not show anxiety-like behavior.
A: Strategy for generation of parvalbumin-Cre recombinase:type 3 adenylyl cyclasef/f (PV-Cre:AC3f/f) mice in which AC3 was selectively deleted in PV+ interneurons; B: Double immunohistochemistry showing the representative micrographs of AC3 protein expression (red) in PV+ interneurons (green) from AC3flox/flox control mice (left) and PV-Cre:AC3f/f mice (right). Solid arrows indicated that PV+ interneurons have well colocalization with AC3 in AC3flox/flox control mice. Empty arrow indicates that AC3 immunostaining disappeared in PV+ interneurons in PV-Cre:AC3f/f mice. Scale bar: 20 μm; C-E: Showing PV-Cre:AC3f/f mice showed similar total distance (C), percentage of center distance (D) and center time (E) in the open field test to control group; F-H: PV-Cre: AC3f/f mice exhibited comparable total arm entries (F), open arm time (G) and percentage of open arm entries (H) in elevated plus maze test compared with AC3flox/flox mice and PV-Cre mice. Bars represent the mean ± standard error of the mean. Data were analyzed using one-way analysis of variance followed by post hoc Tukey's multiple comparisons test. n = 8 for AC3flox/flox group, n = 8 for PV-Cre group, n = 12 for PV-Cre:AC3f/f group.
Figure 6 PV-Cre:AC3f/f mice did not show depression-like behaviors in the forced swimming test (A) and tail suspension test (B).
Bars represent the mean ± standard error of the mean. Data were analyzed using one-way analysis of variance followed by post hoc Tukey’s multiple comparisons test. n = 8 for type 3 adenylyl cyclase (AC3)flox/flox group, n = 8 for the parvalbumin-Cre recombinase (PV-Cre) group, n = 12 for the PV-Cre:AC3f/f group.
- Citation: Yang XY, Ma ZL, Storm DR, Cao H, Zhang YQ. Selective ablation of type 3 adenylyl cyclase in somatostatin-positive interneurons produces anxiety- and depression-like behaviors in mice. World J Psychiatr 2021; 11(2): 35-49
- URL: https://www.wjgnet.com/2220-3206/full/v11/i2/35.htm
- DOI: https://dx.doi.org/10.5498/wjp.v11.i2.35


