Copyright
©The Author(s) 2021.
World J Psychiatr. Feb 19, 2021; 11(2): 35-49
Published online Feb 19, 2021. doi: 10.5498/wjp.v11.i2.35
Published online Feb 19, 2021. doi: 10.5498/wjp.v11.i2.35
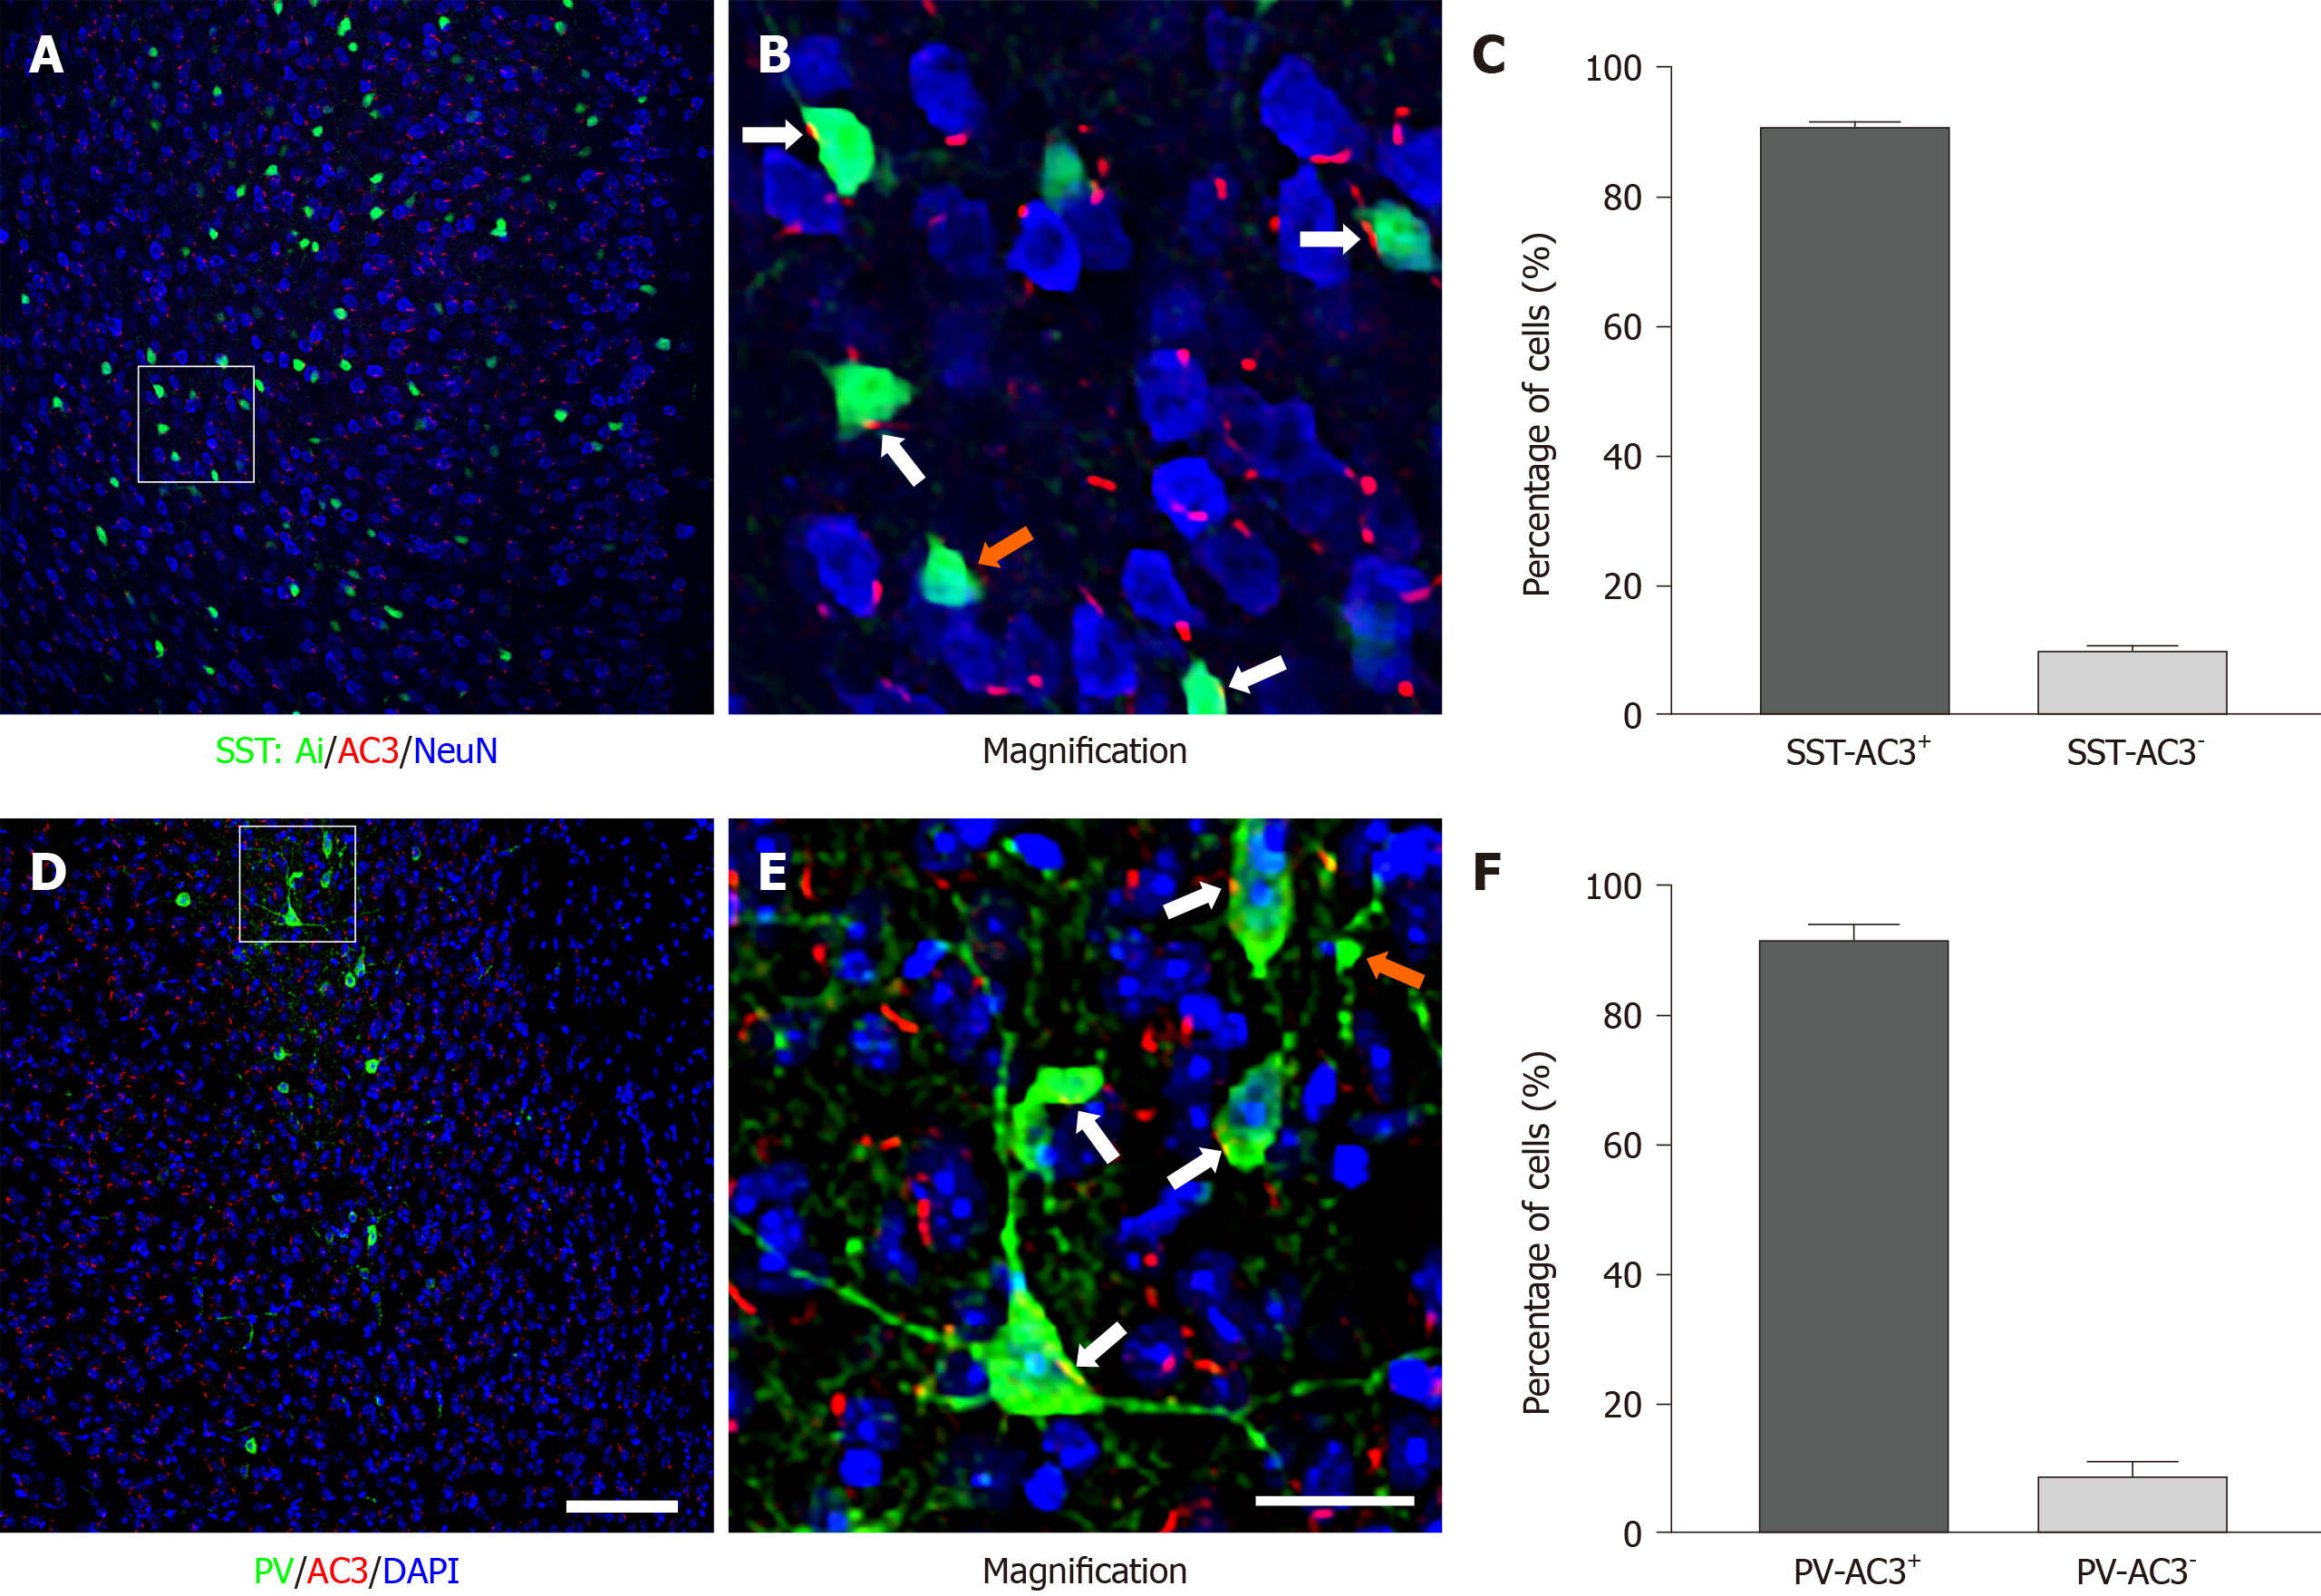
Figure 1 Expression of type 3 adenylyl cyclase in cortical somatostatin-positive and parvalbumin-positive GABAergic interneurons.
A and B: Representative images showing type 3 adenylyl cyclase (AC3) expression in somatostatin-positive (SST+) interneurons at low (A) and high (B) magnifications in the prefrontal cortex brain slice. Solid arrows in B indicate SST+ interneurons, which are also AC3-positve (SST-AC3+ cells). Empty arrow in B indicates SST+ interneurons, which are AC3-negative (SST-AC3- cells); C: Proportion of AC3 expressed in cortical SST+ neurons, n = 6; D and E: Representative images showing AC3 expression in parvalbumin-positive (PV+) interneurons at low (D) and high (E) magnifications in the prefrontal cortex brain slice. Solid arrows indicate PV+ interneurons, which are also AC3-positve (PV-AC3+ cells). Empty arrow in E indicates PV+ interneurons, which are AC3-negative (PV-AC3- cells); F: Proportion of AC3 expressing in cortical PV+ neurons, n = 5. Scale bars represent 100 μm in D and 20 μm in E, respectively.
- Citation: Yang XY, Ma ZL, Storm DR, Cao H, Zhang YQ. Selective ablation of type 3 adenylyl cyclase in somatostatin-positive interneurons produces anxiety- and depression-like behaviors in mice. World J Psychiatr 2021; 11(2): 35-49
- URL: https://www.wjgnet.com/2220-3206/full/v11/i2/35.htm
- DOI: https://dx.doi.org/10.5498/wjp.v11.i2.35


