Copyright
©The Author(s) 2021.
World J Psychiatr. Jan 19, 2021; 11(1): 1-12
Published online Jan 19, 2021. doi: 10.5498/wjp.v11.i1.1
Published online Jan 19, 2021. doi: 10.5498/wjp.v11.i1.1
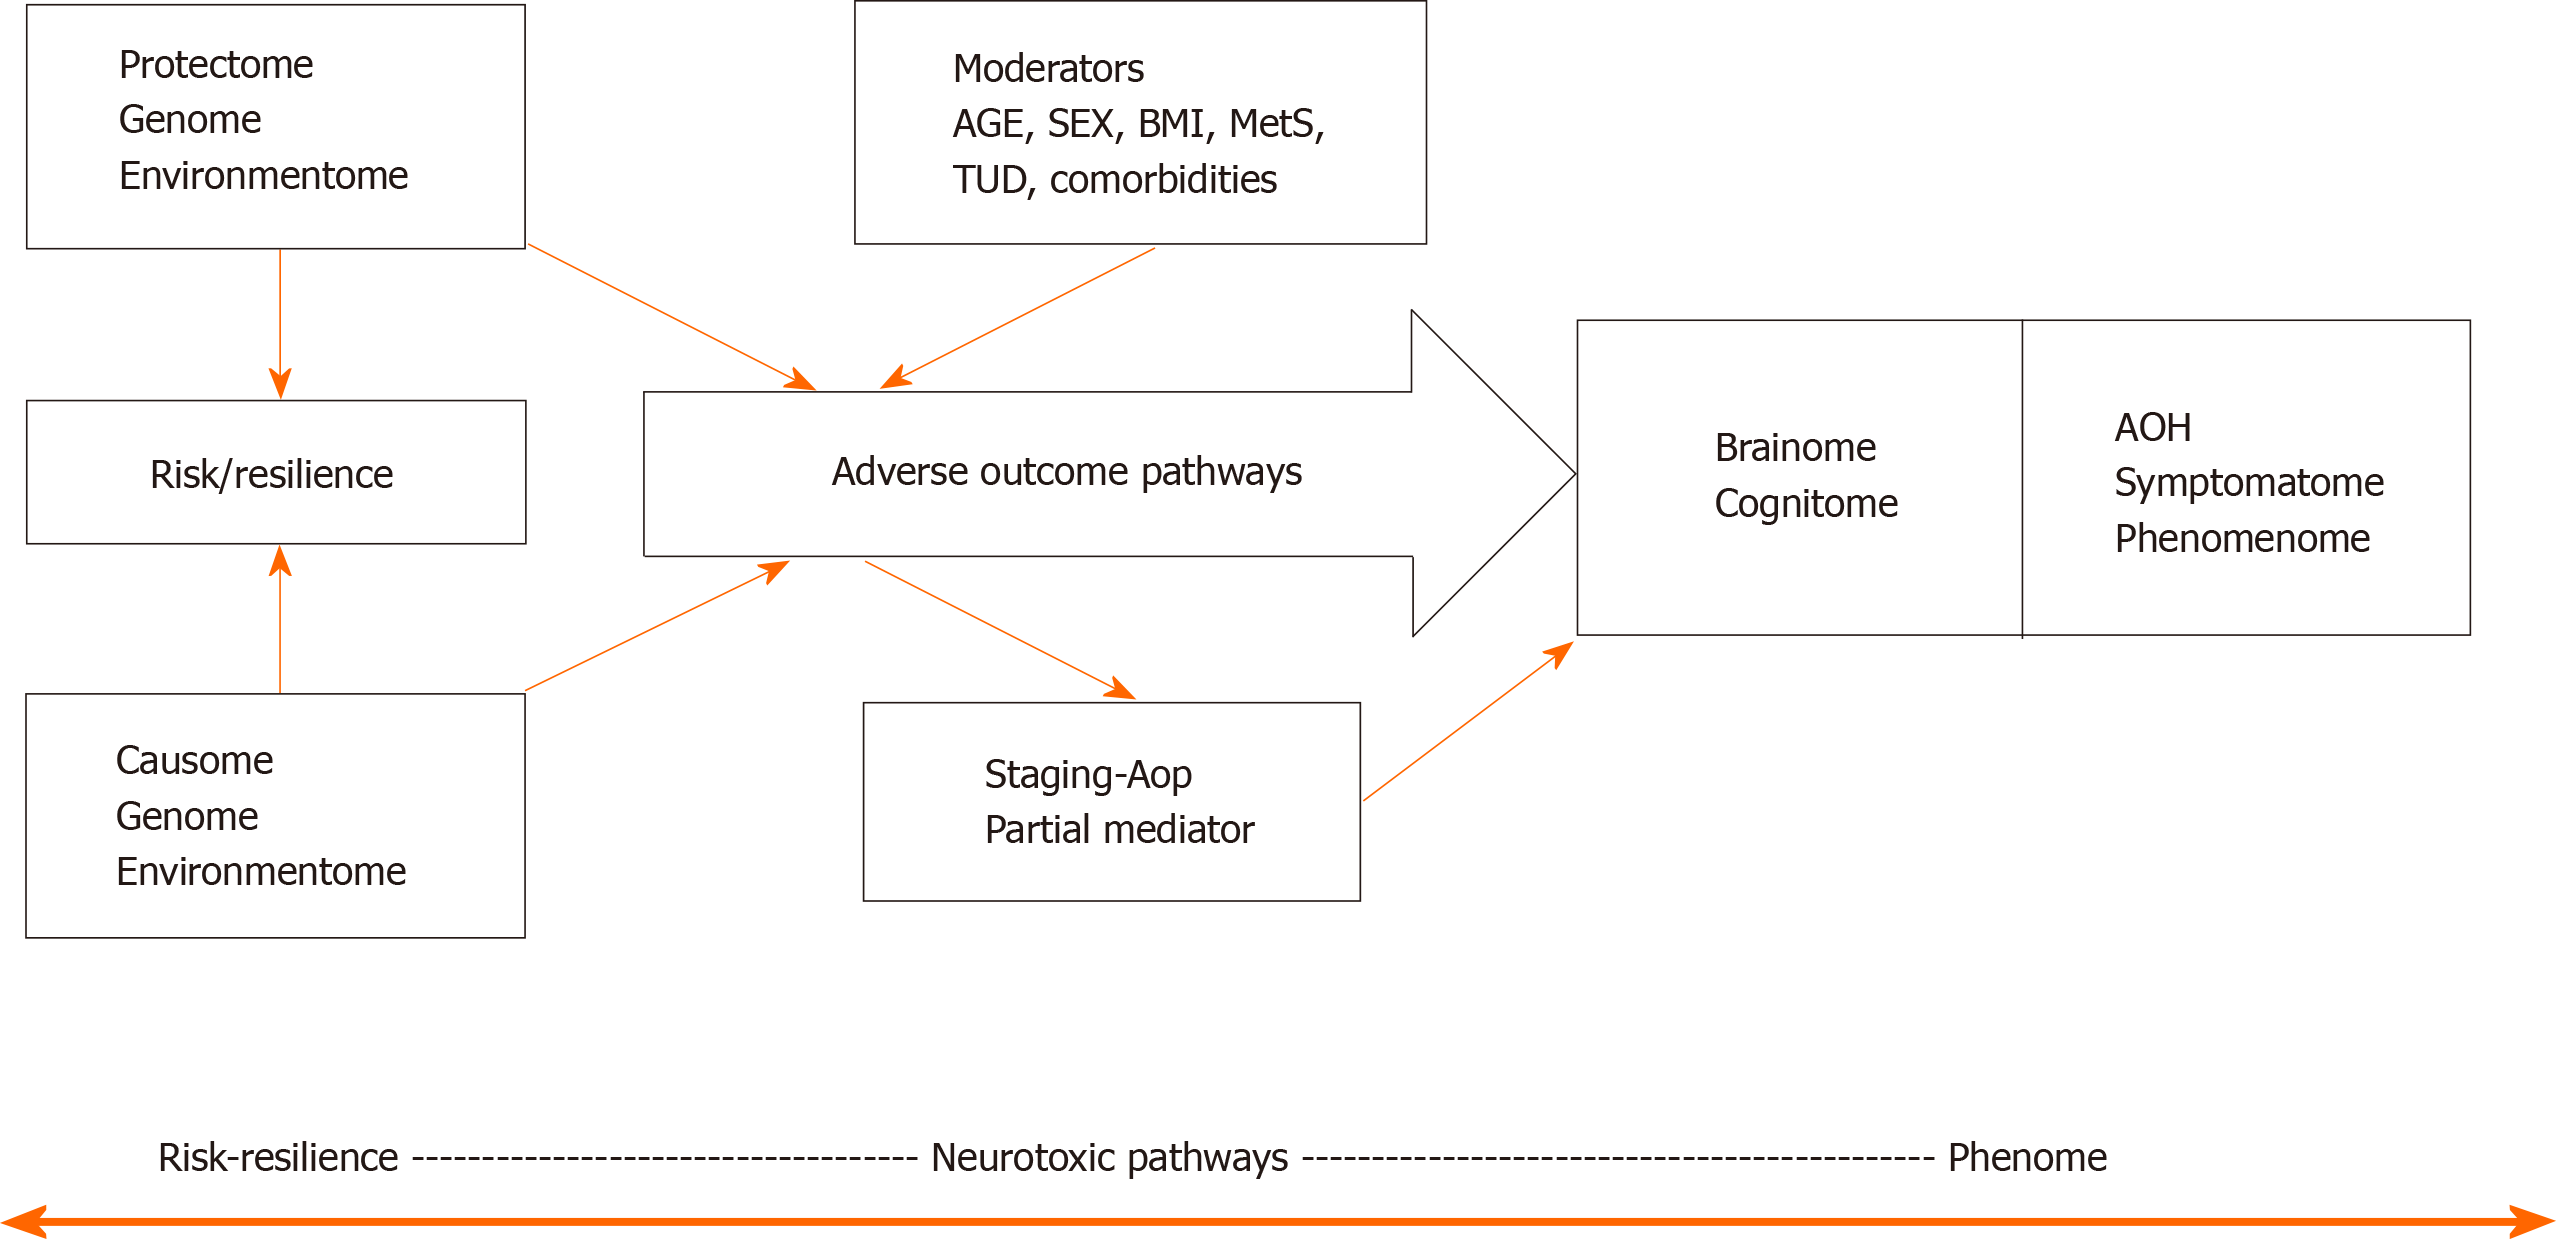
Figure 1 A causal theoretical model applicable to mood and psychotic disorders.
This model links causome features (genes and gene products and environmentome factors) with adverse outcome pathways (AOP) and the phenome of the illness. The phenome consists of brainome and cognitome factors and adverse health outcomes including in the symptomatome and the phenomenome. Moreover, staging of illness may partly mediate the effects of risk/resilience and AOPs on the phenome. Age, sex, body mass index, metabolic syndrome, tobacco use disorder, and psychiatric and medical comorbidities are frequent moderators of the effects of R/R and AOPs on the phenome. AOP: Adverse outcome pathway; AOH: Adverse health outcome; MetS: Metabolic syndrome; BMI: Body mass index.
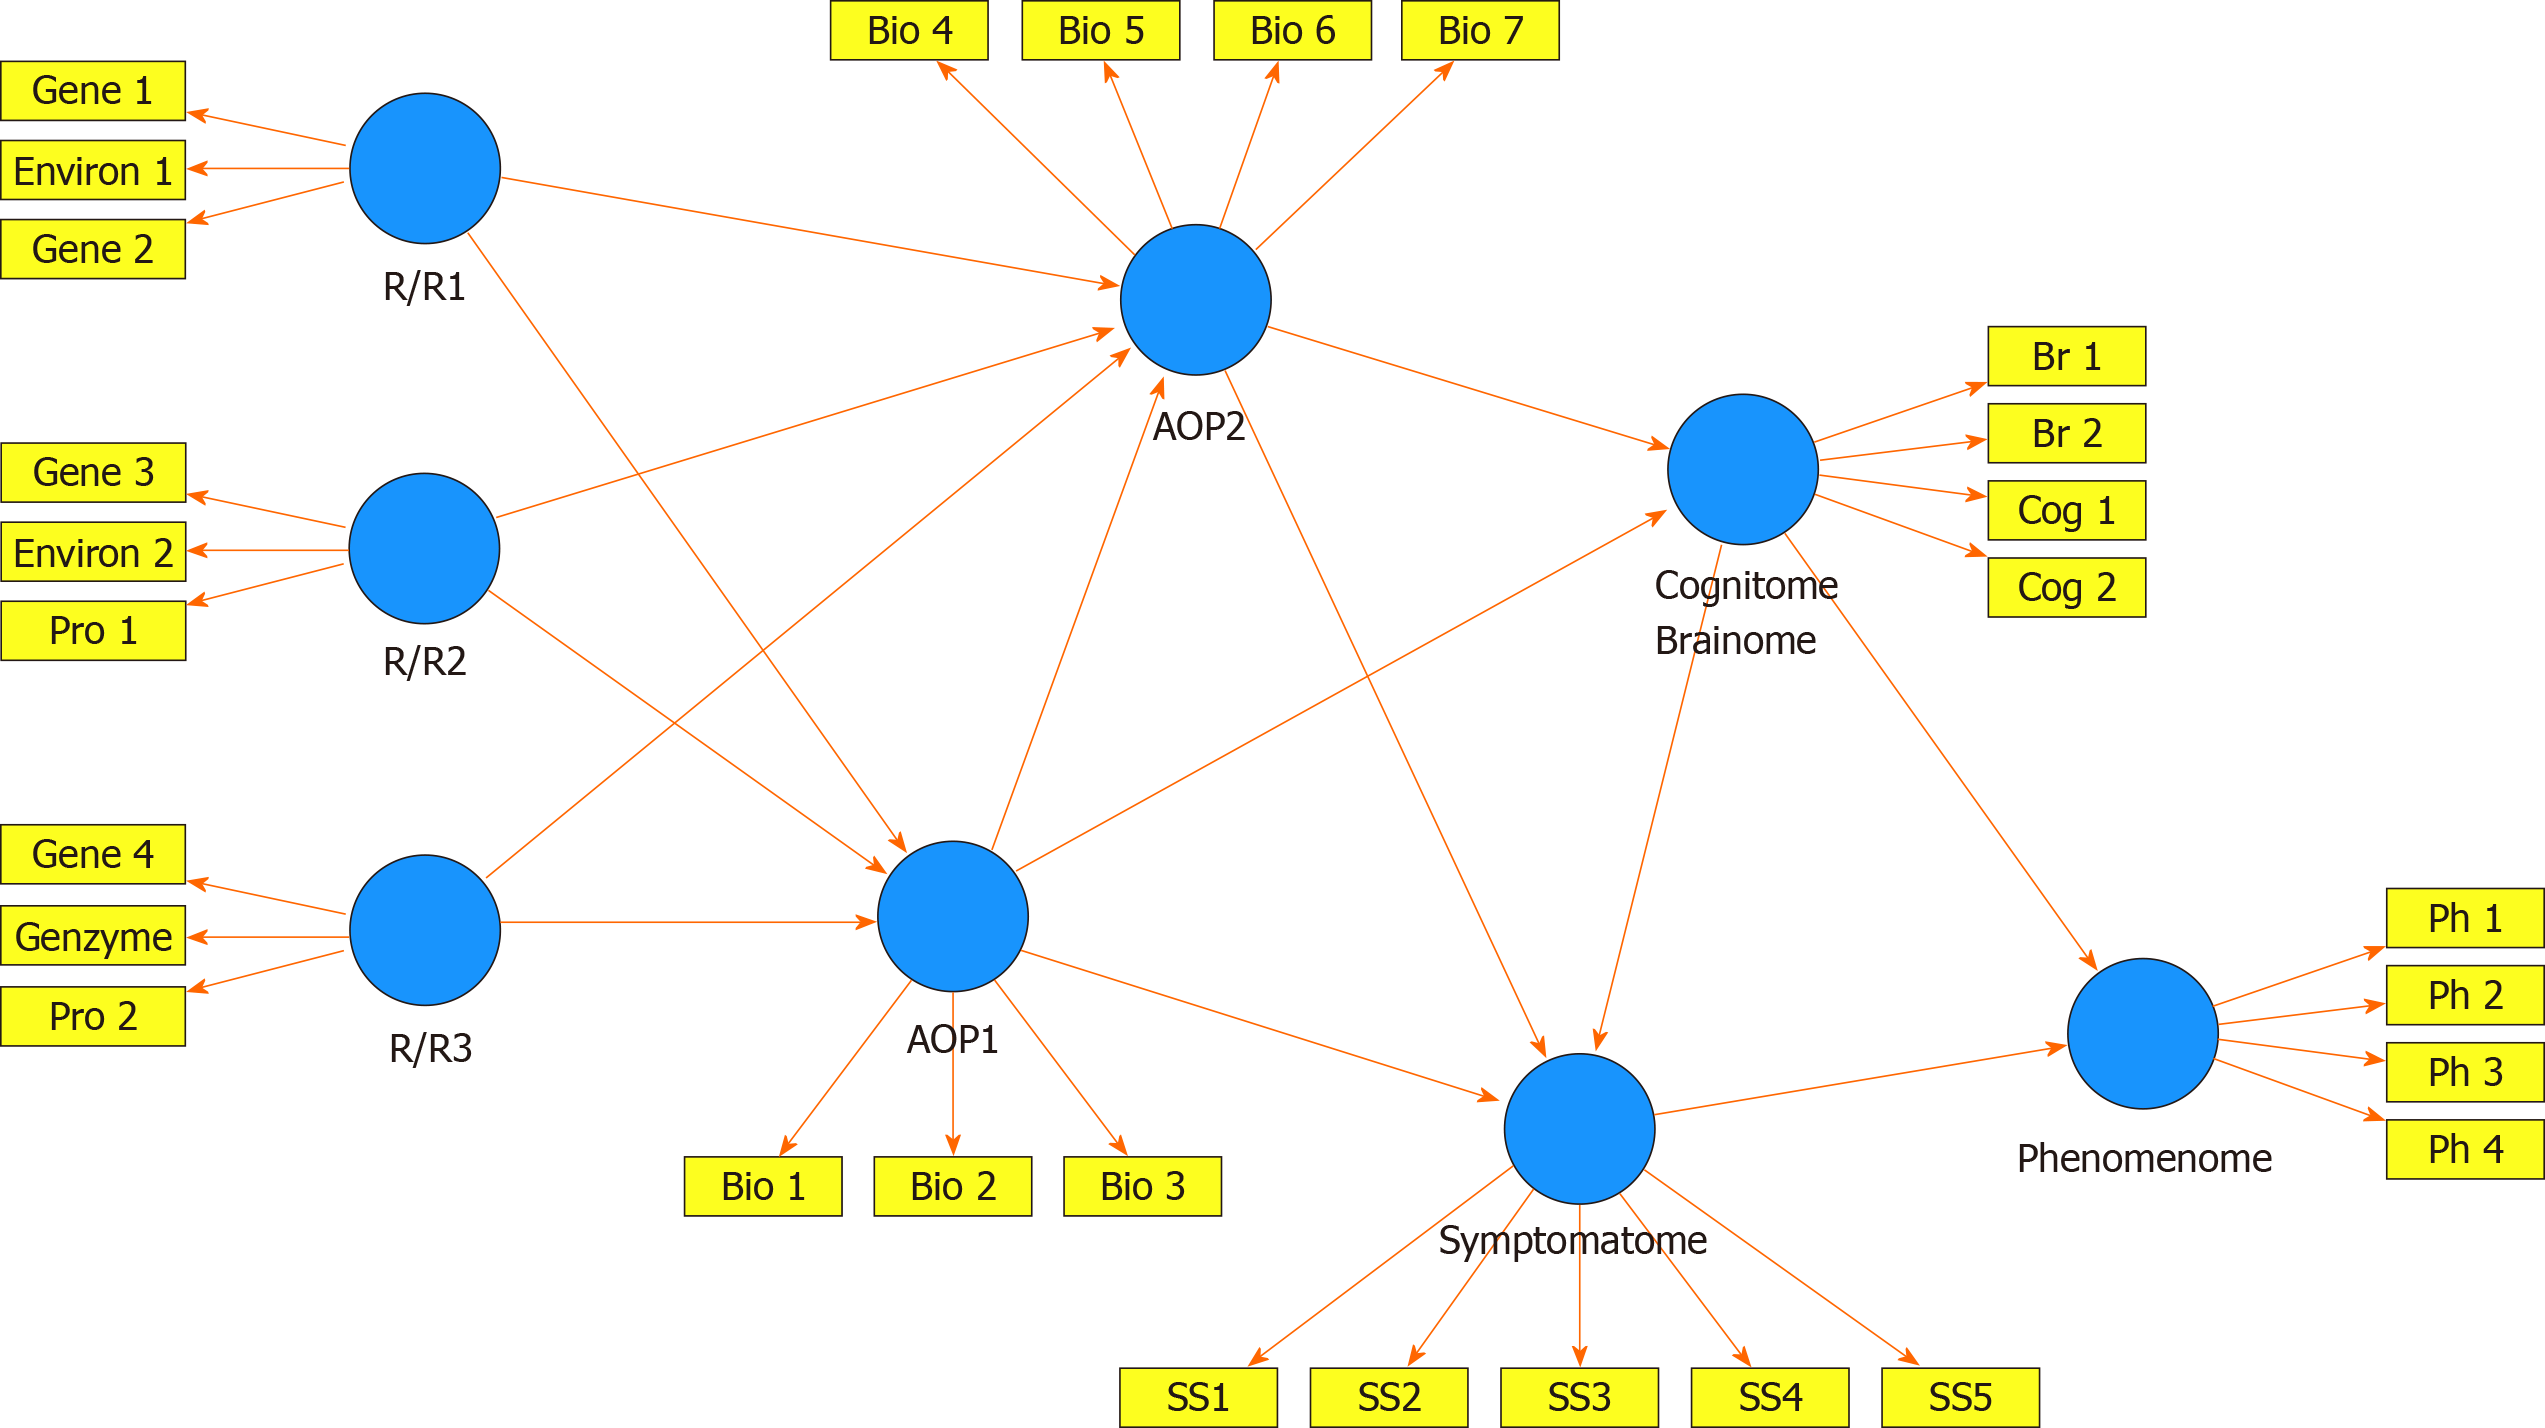
Figure 2 A causal framework of mental illness.
This framework links a multitude of risk/resilience (R/R) features, with adverse outcome pathways (AOPs), the cognitome and brainome, the symptomatome, and phenomenome of mood disorders and schizophrenia. The R/R features are computed as a combination of causal and protective (Pro) genetic and environmental (Environ) features. The AOP feature sets are latent vectors (in reflective models) extracted from molecular or biological pathways/networks (Bio). The cognitome-brainome feature set is a latent vector extracted from cognitive test probe scores (Cog) and brain imaging (Br) scores. The symptomatome is entered as a latent vector extracted from symptom profiles, staging, and phenotypes (SS). The phenomenome is entered as a latent vector extracted from phenomenological data. R/R: Risk/resilience; AOP: Adverse outcome pathway; Pro: Protective; Bio: Biological; SS: Symptom profiles, staging, and phenotypes; Br: Brain imaging; Cog: Cognitive test probe scores.
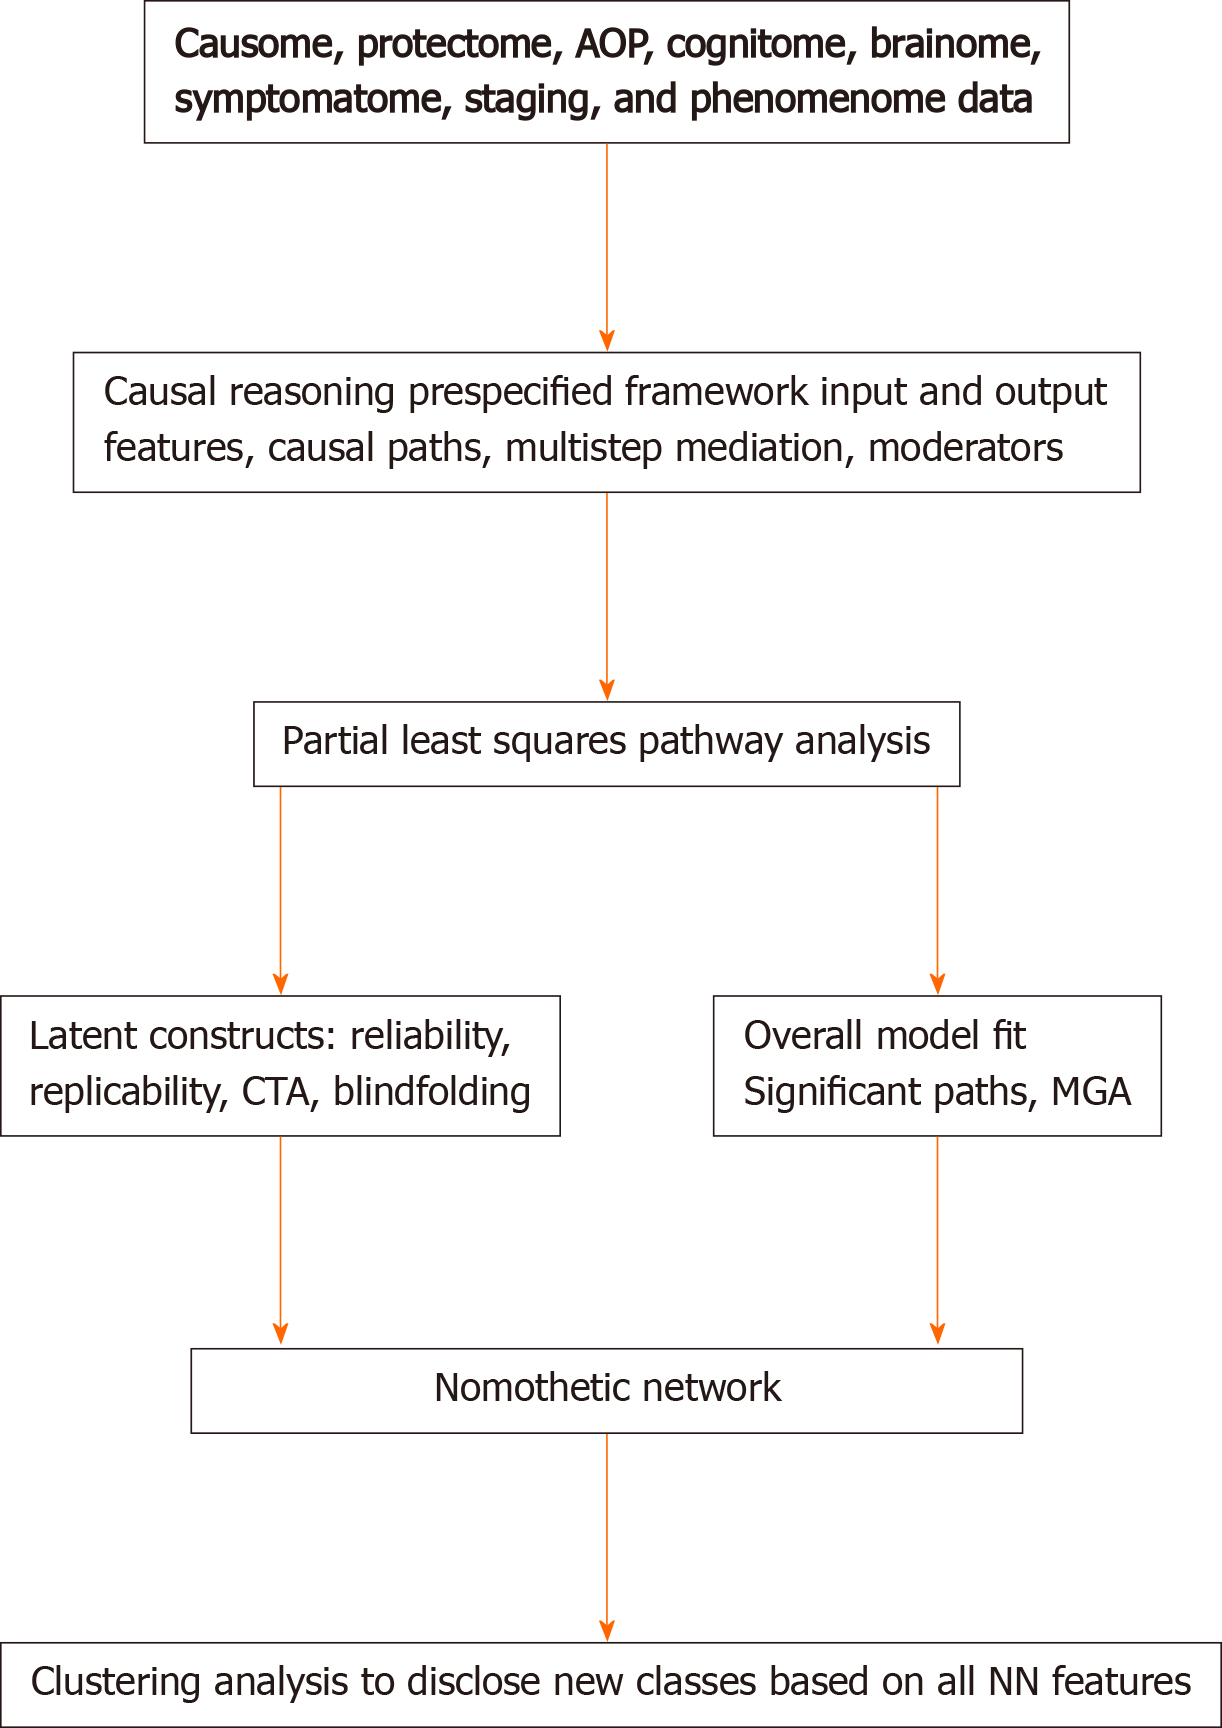
Figure 3 Nomothetic Network Psychiatry.
Use of Partial Least Squares analysis to construct nomothetic networks (NN). Clustering techniques are conducted on the latent variable scores to expose new diagnostic classes. PLS: Partial Least Squares; NN: Nomothetic networks; AOP: Adverse outcome pathways; CTA: Confirmatory tetrad analysis; MGA: Multi-group analysis.
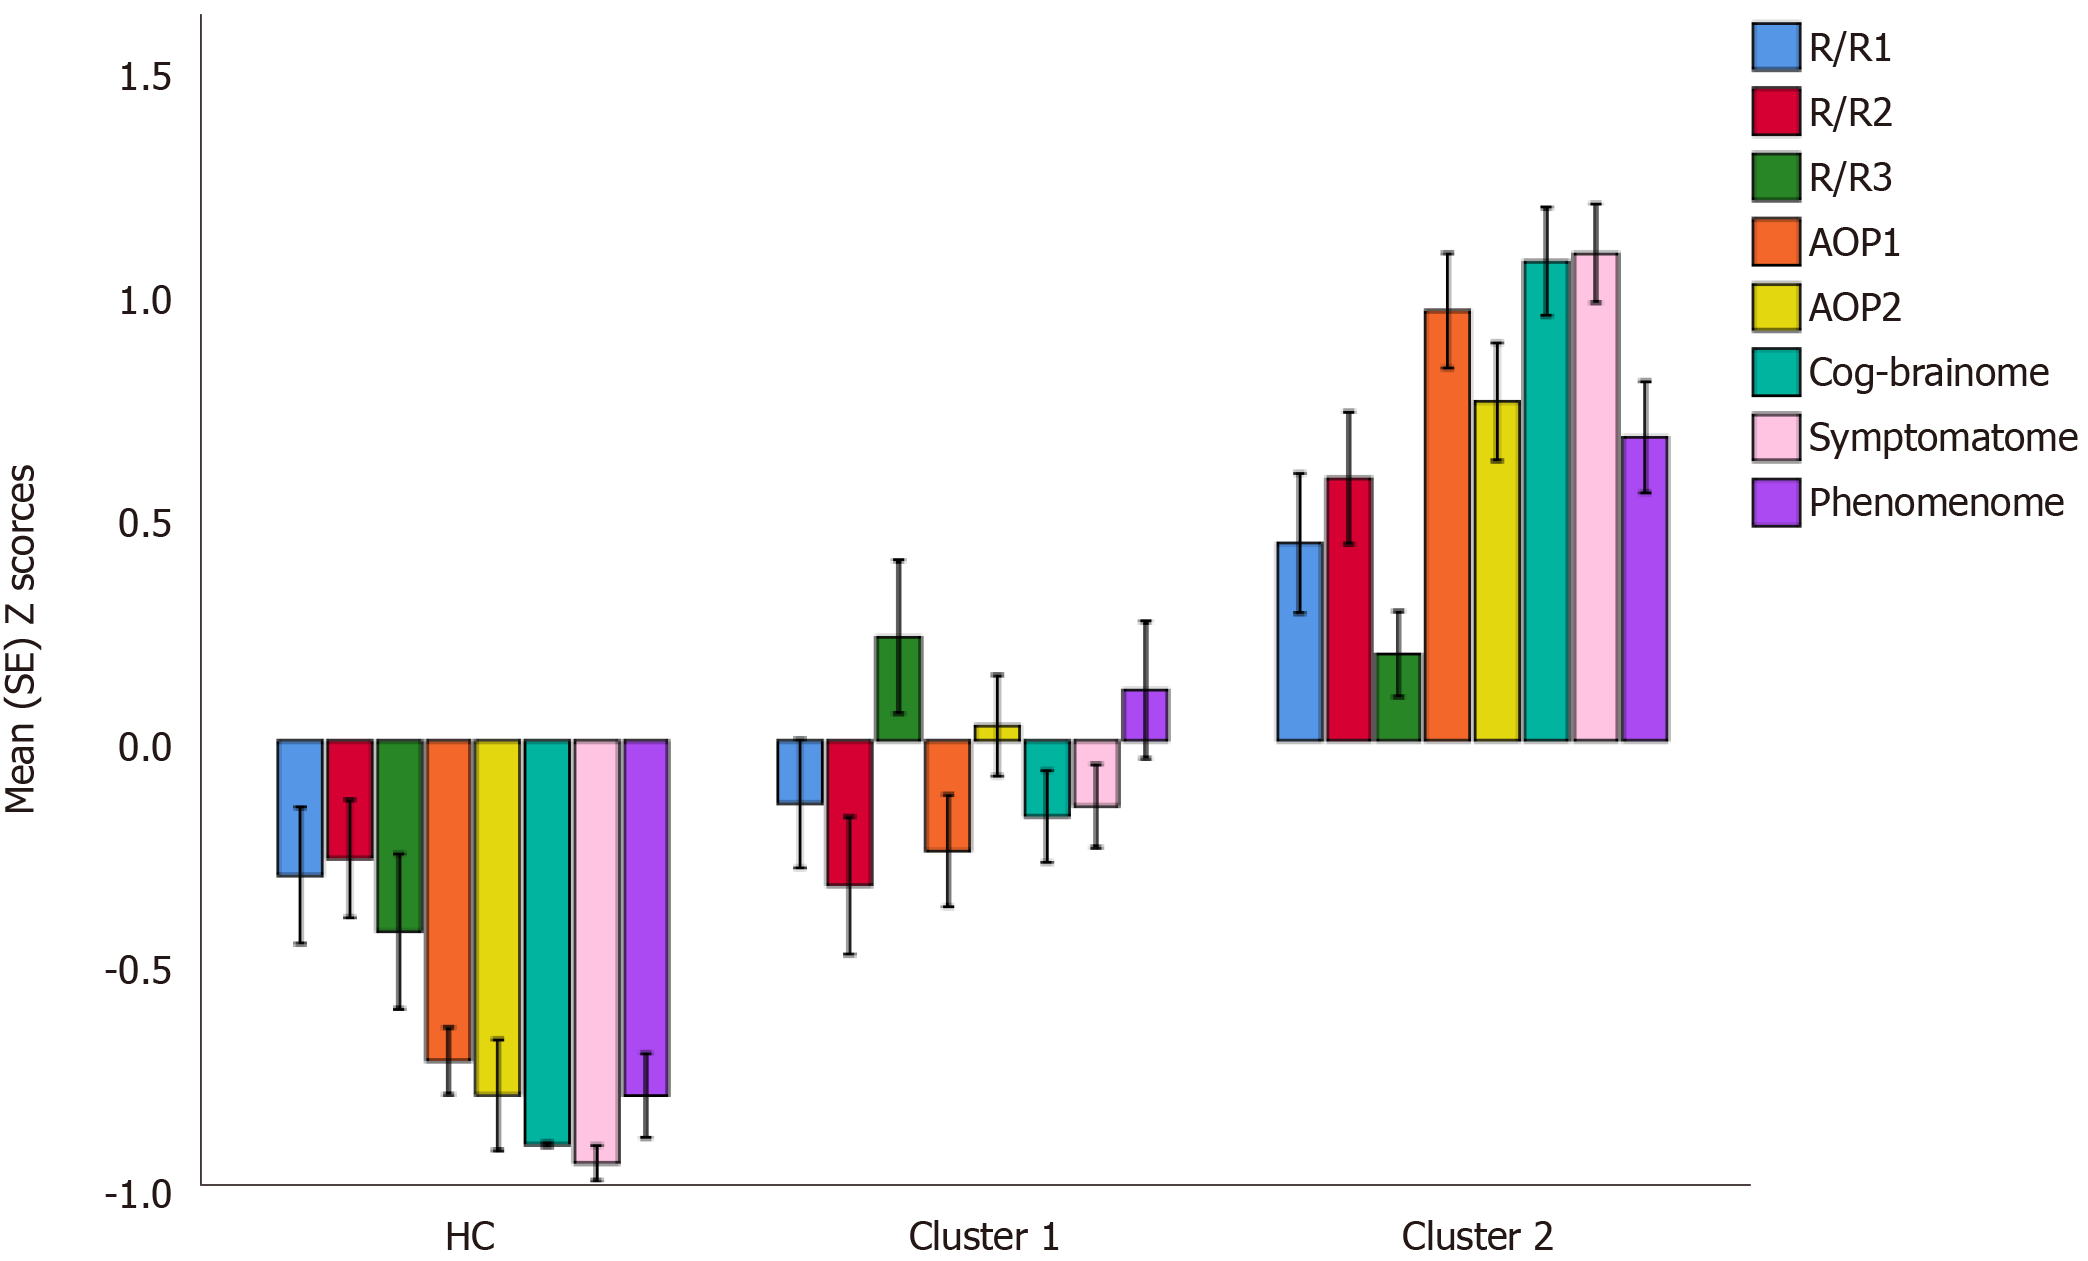
Figure 4 A hypothetical example of cluster analysis-generated classes, with the latent variable scores (in z transformation) displayed in a clustered bar graph.
R/R: Risk/resilience; AOP: Adverse outcome pathway; HC: Healthy control.
- Citation: Stoyanov D, Maes MH. How to construct neuroscience-informed psychiatric classification? Towards nomothetic networks psychiatry. World J Psychiatr 2021; 11(1): 1-12
- URL: https://www.wjgnet.com/2220-3206/full/v11/i1/1.htm
- DOI: https://dx.doi.org/10.5498/wjp.v11.i1.1


