Copyright
©2013 Baishideng Publishing Group Co.
World J Med Genet. Nov 27, 2013; 3(4): 41-54
Published online Nov 27, 2013. doi: 10.5496/wjmg.v3.i4.41
Published online Nov 27, 2013. doi: 10.5496/wjmg.v3.i4.41
Figure 1 Expression of lineage-specific differentiation- and stem cell-associated genes in various lung cancer cell lines.
Total RNA isolated from the cells was subjected to reverse transcription-polymerase chain reaction analyses; GLDC: Glycine decarboxylase; MSI1: Musashi-1; ACTB: β-Actin.
Figure 2 Expression of hypoxia-inducible factor α subunits and cell growth in A549 and QG56 cells under hypoxic conditions.
The cells were cultured under normoxic (N) or hypoxic (H) conditions. A: Expression of hypoxia-inducible factor (HIF)-1α and HIF-2α mRNA; B: Cell growth of A549; C: Cell growth of QG56 cells; D: Cell viability; The cells were cultured for 5 d; Bars, SD (n = 3).
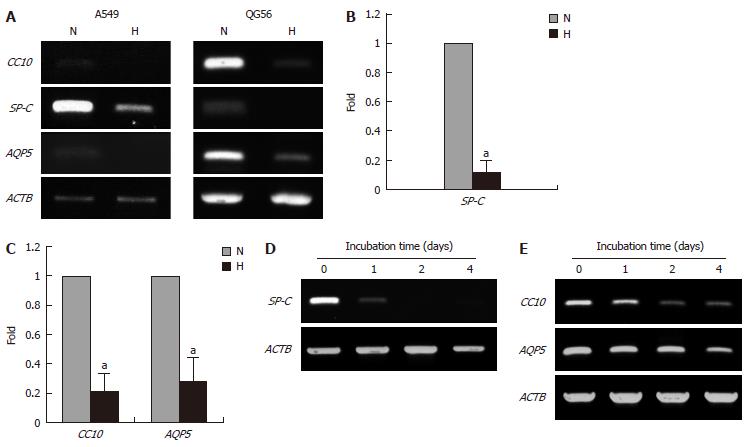
Figure 3 Effect of hypoxia on the expression of differentiation-associated genes.
The cells were cultured under normoxic (N) or hypoxic (H) conditions for 5 d. A: Expression of differentiation-associated genes in A549 and QG56 cells; B: Normalized expression levels of the genes in A549; C: Normalized expression levels of the genes in QG56 cells; D: Time-course of the expression of SP-C in A549 cells; E: The expression of CC10 and AQP5 in QG56 cells; The expression level of each gene was normalized to that of β-Actin (ACTB); Data are shown as fold-change relative to normoxia (normoxia values set to equal 1), aP < 0.05 (n = 3); The cells were cultured under hypoxic conditions for the indicated periods.
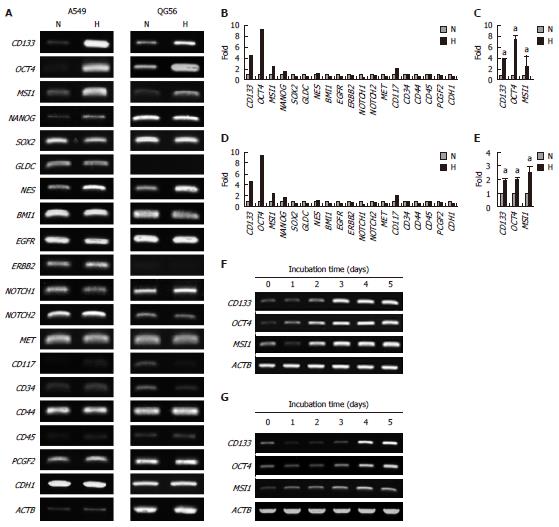
Figure 4 Effect of hypoxia on the expression of stem cell-associated genes.
The cells were cultured under normoxic (N) or hypoxic (H) conditions. A: Expression of stem cell-associated genes in A549 and QG56 cells; B and C: Normalized expression levels of the genes in A549 cells; Cells were cultured for 5 d; D and E: Normalized expression levels of the genes in QG56 cells; F: Time-course of the expression of CD133, OCT4, and MSI1 in A549; G: Time-course of the expression of CD133, OCT4, and MSI1 in QG56 cells (G). The expression level of each gene was normalized to that of β-Actin (ACTB); Data are shown as fold-change relative to normoxia (normoxia values set to equal 1). aP < 0.05 (n = 3); The cells were cultured for the indicated periods.
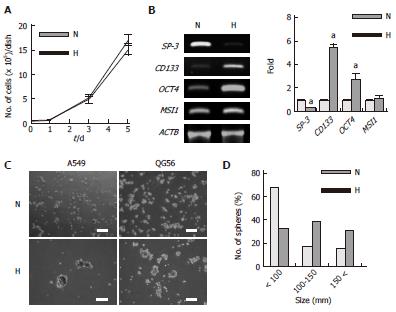
Figure 5 Changes in gene expression and sphere-forming activity of A549 and QG56 cells under hypoxic conditions.
The cells were cultured under normoxic (N) or hypoxic (4% O2) (H) conditions. A: Growth of A549 cells. Bars, SD (n = 3); B: Differentiation- and stem cell-related gene expression in A549 cells, the cells were cultured for 5 d, data are shown as fold-change relative to normoxia (normoxia values set to equal 1), aP < 0.05 (n = 3); C: Sphere formation; A549 or QG56 cells pre-cultured under normoxic or hypoxic (1% O2) conditions for 2 d were reseeded in BEBM supplemented with various additives (see Materials and Methods) and then further cultured for 7 d; Left panels represent A549 cells and right panels represent QG56 cells. Scale bars = 200 μm; D: Size distribution of the spheres formed by A549 cells.
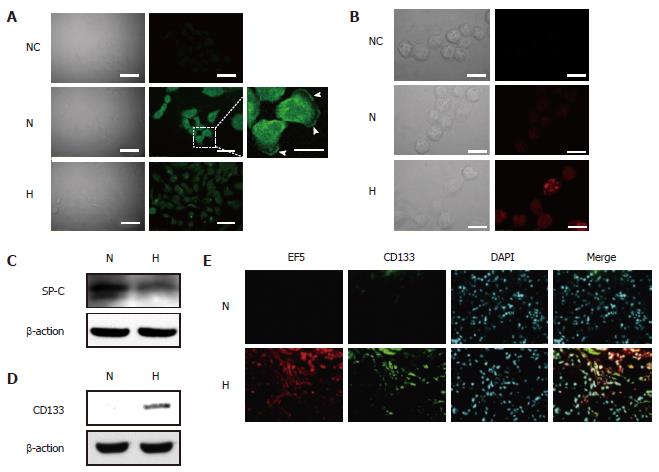
Figure 6 Expression of SP-C and CD133 proteins in hypoxic A549 cells in vitro and in vivo.
A549 cells were cultured under normoxic (N) or hypoxic (H) conditions for 5 d; A: Immunostaining for SP-C, arrowheads indicate the localization of SP-C proteins at cell membranes, NC indicates negative control (normal rabbit serum), Scale bars = 50 μm (white bars) and 20 μm (yellow bars); B: Immunostaining for CD133. Formaldehyde-fixed, nonpermeabilized cells were immunostained with phycoerythrin-conjugated monoclonal anti-CD133 antibody, NC indicates negative control, scale bars = 20 μm; C: Western blot analysis of SP-C protein expression; D: Western blot analysis of CD133 protein expression, C and D total cell lysates were subjected to immunoblot analysis for SP-C and CD133, β-Actin was used as a loading control; E: CD133 expression in hypoxic cells in A549 subcutaneous tumors, tissue sections were double-stained with an anti-CD133 antibody (green) and an anti-EF5 antibody (red). Nuclei were stained with DAPI. Upper panels represent the EF-5-negative (normoxic) area and bottom panels represent the EF-5-positive (hypoxic) area, scale bars = 100 μm.
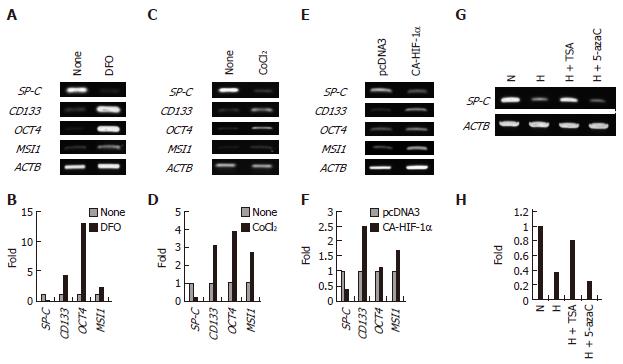
Figure 7 Hypoxia-inducible factor mediates the expression of differentiation- and stem cell-related genes in A549 cells.
A and B: Effect of DFO, the cells were cultured with or without 100 μmol/L DFO for 3 d; C and D: Effect of CoCl2, the cells were cultured in the presence or absence of 200 μmol/L CoCl2 for 3 d; E and F: Effect of the ectopic expression of HIF-1αP402A/P564A, the cells were transfected with pcDNA3.1 or pcDNA3.1/HIF-1αP402A/P564A and allowed to grow for 2 d; G and H: Effects of TSA and 5-azacytidine on the hypoxia-induced repression of SP-C expression, the cells were cultured under normoxic (N) or hypoxic (H) conditions in the presence or absence of TSA (300 nmol/L) or 5-azacytidine (5-azaC) (4 μmol/L) for 3 d. B, D, F, and H: The expression level of each gene was normalized to that of β-Actin (ACTB), data are shown as fold-change relative to normoxia (normoxia values set to equal 1).
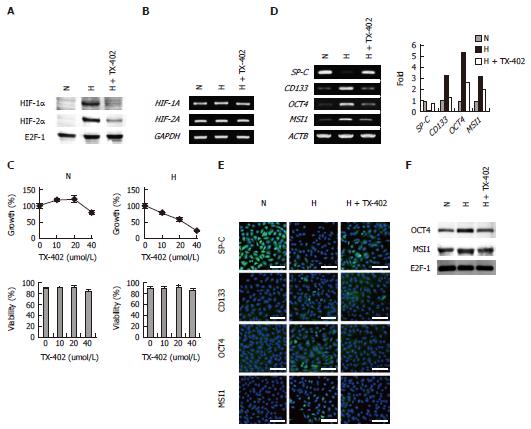
Figure 8 Effects of TX-402 on hypoxia-inducible factor-α expression, cell proliferation, viability and gene expression levels of A549 cells.
The cells were cultured under normoxic (N) or hypoxic (H) conditions in the presence or absence of 20 μmol/L TX-402 for 3 d; A: Expression of HIF-α subunits, Nuclear extracts and total RNA were subjected to Western blot; B: Expression of HIF-α subunits, Nuclear extracts and total RNA were subjected to reverse transcription-polymerase chain reaction (RT-PCR) analysis; C: Cell growth and viability, bars, SD (n = 3); D: RT-PCR analysis of the expression of SP-C, CD133, OCT4 and MSI1 Mrna, the expression level of each gene was normalized to that of β-Actin (ACTB), data are shown as fold-change relative to normoxia (normoxia values set to equal 1); E: Immunofluorescence analysis of the expression of SP-C, CD133, OCT4 and MSI1 protein, Nuclei were stained with DAPI, and the merged images are shown, Perinuclear and nuclear localization of OCT4 and MSI1 was observed, Scale bars = 50 μm; F: Western blot analysis of the nuclear localization of OCT4 and MSI1, Nuclear extracts of the cells were subjected to the analysis, E2F-1 was used as a loading control.
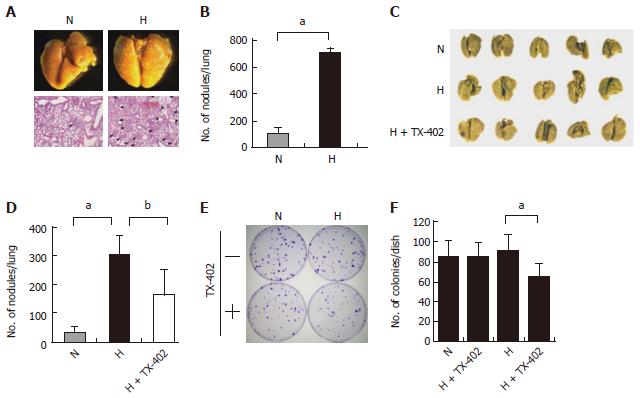
Figure 9 Effect of TX-402 on the lung-colonizing capability of A549 cells cultured under hypoxic conditions.
A, B: Macroscopic and histological observations of the lungs. A549 cells cultured under normoxic (N) or hypoxic (H) conditions for 5 d were injected into the tail vein of Balb/c nude mice (n = 5), the lungs were processed for macroscopic and histological (hematoxylin and eosin staining) observations, and the number of metastatic foci was counted, data are presented as the mean ± SE, bP < 0.01; C,D: Effect of TX-402 on the hypoxia-induced lung-colonizing ability of A549 cells. A549 cells cultured under normoxic (N) or hypoxic (H) conditions with vehicle or 20 μmol/L TX-402 for 3 d were injected into the tail vein of BALB/c nude mice (n = 5), The lungs were fixed, and the number of nodules per lung was then counted. Data are presented as the mean ± SE, bP < 0.01 and aP < 0.05; E, F: Colony-forming ability of TX-402-treated A549 cells, A549 cells (100 cells/dish) cultured under normoxic (N) or hypoxic (H) conditions in the presence of solvent (DMSO) or 20 μmol/L TX-402 for 3 d were seeded and cultured for an additional 14 d, the colonies were stained with crystal violet, data are presented as the mean ± SD (n = 6), bP < 0.01.
- Citation: Akimoto M, Nagasawa H, Hori H, Uto Y, Honma Y, Takenaga K. An inhibitor of HIF-α subunit expression suppresses hypoxia-induced dedifferentiation of human NSCLC into cancer stem cell-like cells. World J Med Genet 2013; 3(4): 41-54
- URL: https://www.wjgnet.com/2220-3184/full/v3/i4/41.htm
- DOI: https://dx.doi.org/10.5496/wjmg.v3.i4.41


