Copyright
©2013 Baishideng Publishing Group Co.
World J Med Genet. Nov 27, 2013; 3(4): 41-54
Published online Nov 27, 2013. doi: 10.5496/wjmg.v3.i4.41
Published online Nov 27, 2013. doi: 10.5496/wjmg.v3.i4.41
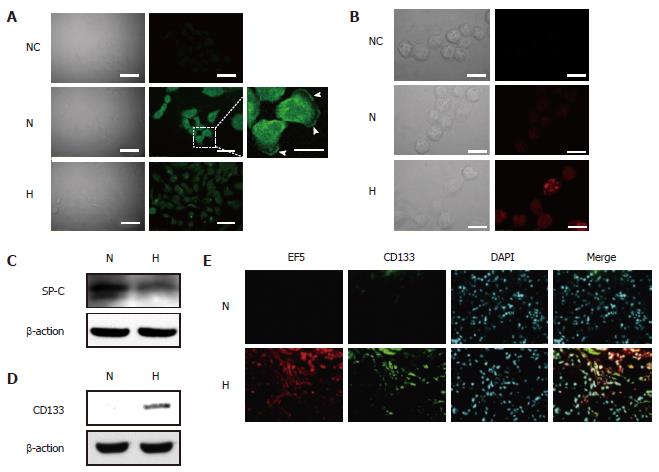
Figure 6 Expression of SP-C and CD133 proteins in hypoxic A549 cells in vitro and in vivo.
A549 cells were cultured under normoxic (N) or hypoxic (H) conditions for 5 d; A: Immunostaining for SP-C, arrowheads indicate the localization of SP-C proteins at cell membranes, NC indicates negative control (normal rabbit serum), Scale bars = 50 μm (white bars) and 20 μm (yellow bars); B: Immunostaining for CD133. Formaldehyde-fixed, nonpermeabilized cells were immunostained with phycoerythrin-conjugated monoclonal anti-CD133 antibody, NC indicates negative control, scale bars = 20 μm; C: Western blot analysis of SP-C protein expression; D: Western blot analysis of CD133 protein expression, C and D total cell lysates were subjected to immunoblot analysis for SP-C and CD133, β-Actin was used as a loading control; E: CD133 expression in hypoxic cells in A549 subcutaneous tumors, tissue sections were double-stained with an anti-CD133 antibody (green) and an anti-EF5 antibody (red). Nuclei were stained with DAPI. Upper panels represent the EF-5-negative (normoxic) area and bottom panels represent the EF-5-positive (hypoxic) area, scale bars = 100 μm.
- Citation: Akimoto M, Nagasawa H, Hori H, Uto Y, Honma Y, Takenaga K. An inhibitor of HIF-α subunit expression suppresses hypoxia-induced dedifferentiation of human NSCLC into cancer stem cell-like cells. World J Med Genet 2013; 3(4): 41-54
- URL: https://www.wjgnet.com/2220-3184/full/v3/i4/41.htm
- DOI: https://dx.doi.org/10.5496/wjmg.v3.i4.41


