Copyright
©The Author(s) 2017.
World J Orthop. Sep 18, 2017; 8(9): 660-673
Published online Sep 18, 2017. doi: 10.5312/wjo.v8.i9.660
Published online Sep 18, 2017. doi: 10.5312/wjo.v8.i9.660
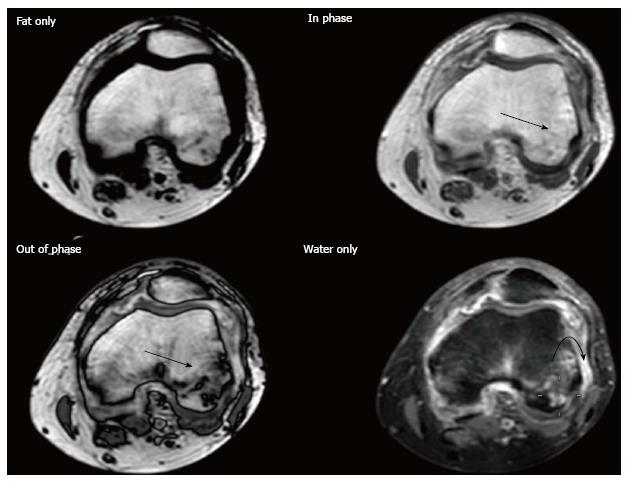
Figure 1 DIXON.
Thirty-two years old woman with knee pain and suspected rheumatoid arthritis. Post-contrast DIXON study was performed. Opposed-phase image shows large hypointense areas in both condyles (arrows), which are hardly seen on the in-phase image, consistent with bone marrow edema. Note the presence of bone erosions and synovitis (curved arrow) better depicted on water only imaging.
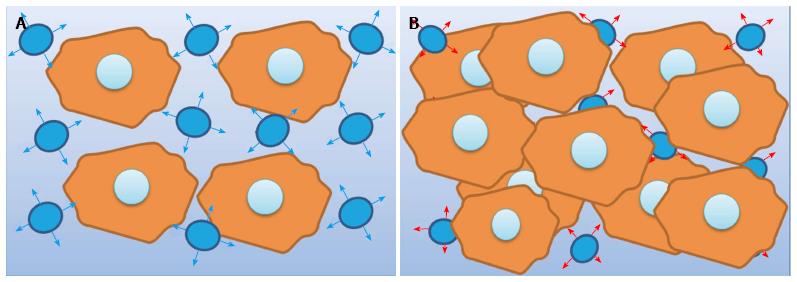
Figure 2 Diffusion-weighted imaging.
A: Free water diffusion. The diagram represents the free motion of water molecules in the extracellular space between cells in normal tissue; B: Restricted water diffusion. The diagram represents the restricted motion of water molecules in the extracellular space due to hypercellularity. Another condition that leads to a decrease in the extracellular space is the presence of cytotoxic edema, while the presence of debris and detritus as in the case of abscesses may result also in restricted diffusion.
Figure 3 Dynamic-contrast enhanced-magnetic resonance imaging.
Dynamic-contrast enhanced-magnetic resonance imaging analysis may be performed using a monocompartmental or a bicompartmental model. A: Diagram represents a monocompartmental model in which only vascular space is considered for distribution of gadolinium chelate; B: Diagram represents a bicompartmental model in which, besides the vascular space, the extracellular extravascular space with leakage and recirculation of gadolinium molecules are also considered. The main parameters derived for those models are detailed in Table 2.
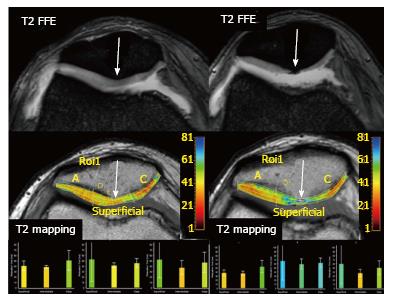
Figure 4 Osteoarthritis progression.
A 49-year-old woman with knee pain is studied with two consecutive MRI studies. The first MRI (left images) shows a moderate joint effusion with patchy areas of increased signal intensity on T2 FFE sequence within the patellar cartilage. T2 mapping demonstrates diffuse increase in T2 relaxation times, more conspicuous at the patellar apex (arrows) consistent with early cartilage damage. Follow-up MRI performed 15 mo later (right images), demonstrates severe cartilage thinning, especially at patellar apex, that correlates with a severe increase in T2 relaxation times on the T2 mapping study. This clinical example demonstrates how T2 mapping can help to detect patients with evidence of early OA. MRI: Magnetic resonance imaging; OA: Osteoarthritis.
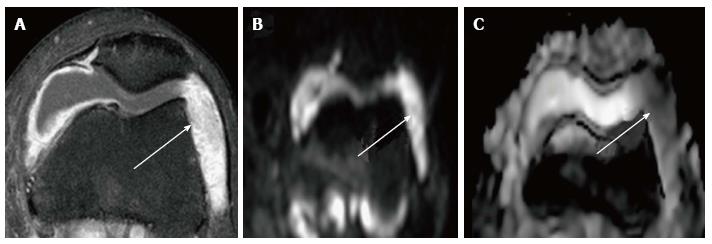
Figure 5 Synovial fluid evaluation with diffusion-weighted imaging.
In a 42-year-old woman with RA and knee swelling. A: Axial post contrast fat-suppressed TSE T1-weighted sequence shows articular fluid and synovial enhancement; B, C: DWI with a b value of 900 s/mm2 and corresponding ADC map confirm the presence of an effusion without significant restriction of free water motion (ADC: 2, 8 × 10⁻³ mm2/s) consistent with transudate due to rheumatoid arthritis, as confirmed by arthrocentesis. In this case, DWI helps to exclude infection. Note the presence of a prominent chondral erosion near to patellar apex (asterisk on A). DWI: Diffusion-weighted imaging; RA: Rheumatoid arthritis; ADC: Apparent diffusion coefficient.
Figure 6 Septic synovitis.
Magnetic resonance imaging findings in a 22-year-old man with knee pain and fever. A: Axial post contrast fat-suppressed TSE T1-weighted image shows a large joint effusion with synovial thickening and intense enhancement; B, C: DWI with a b value of 800 s/mm2 and corresponding ADC map demonstrate areas of severely restricted diffusion (ADC: 1, 8 × 10⁻³ mm2/s) within the articular fluid at the lateral patellar recess consistent with exudate, as proven by arthrocentesis. DWI: Diffusion-weighted imaging; ADC: Apparent diffusion coefficient; TSE: Turbo spin echo.
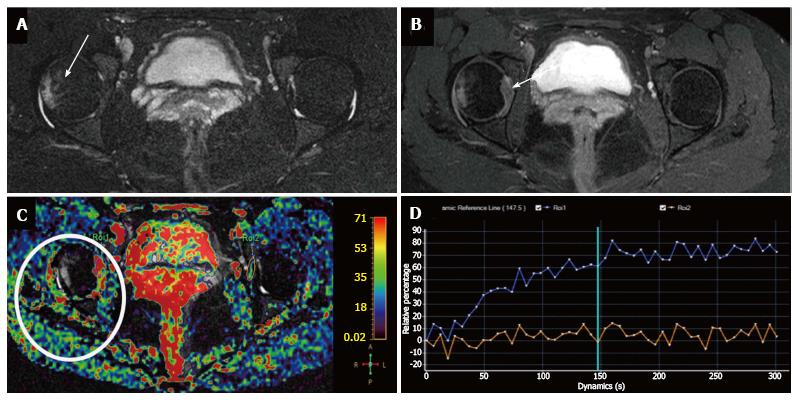
Figure 7 Evaluation of inflammatory arthritis with dynamic-contrast enhanced-magnetic resonance imaging in a 42-year-old woman with rheumatoid arthritis and right hip pain.
A: Axial STIR shows mild articular effusion in the right hip with subtle signs of subchondral bone edema (arrow); B: Axial post-gadolinium SPIR GE T1-weighted image demonstrates moderate synovial thickening and enhancement especially at the medial articular surface (arrow); C: Relative enhancement map; D: Dynamic-contrast enhanced-magnetic resonance imaging demonstrate a type I TIC (blue curve) in the right hip, with progressive enhancement, compared to absence of significant enhancement in the contralateral hip (orange curve). This finding helps to confirm the inflammatory involvement of right hip. STIR: Short inversion time recovery.
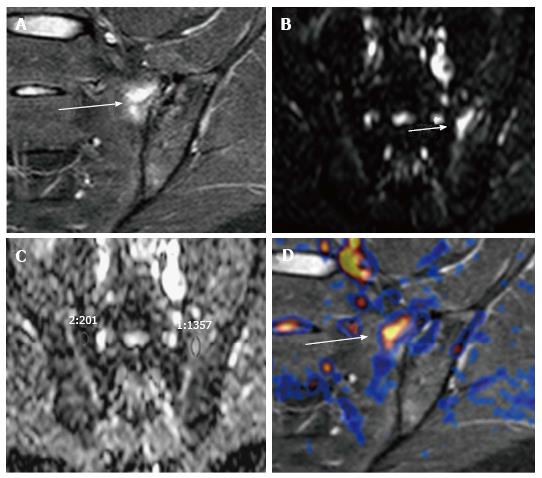
Figure 8 Acute sacroiliitis in a 32-year-old woman with left hip pain.
A-C: Coronal STIR shows a focus of subchondral bone edema in the left hemisacrum (arrow, A), which appears hyperintense on (B) high b value DWI, with (C) significantly higher ADC values than contralateral bone marrow (1.3 × 10⁻³ mm2/s vs 0.2 × 10⁻³ mm2/s); D: Fused DWI and STIR images allow a better depiction of bone edema. STIR: Short inversion time recovery; DWI: Diffusion-weighted imaging; ADC: Apparent diffusion coefficient.
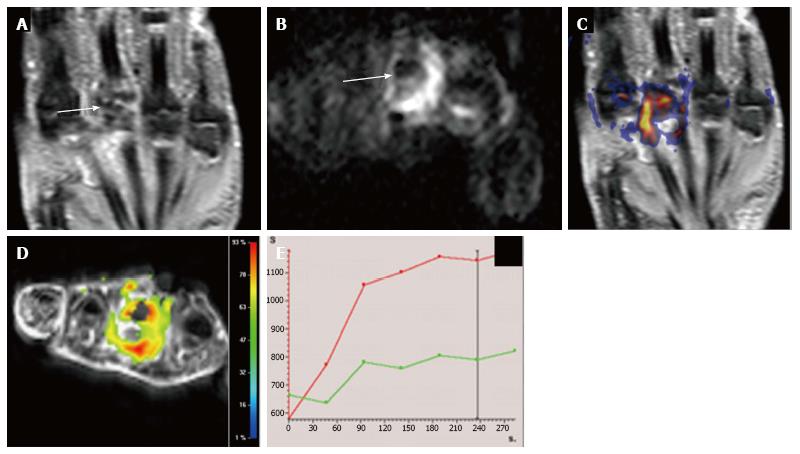
Figure 9 Multiparametric evaluation of rheumatoid arthritis in a 40-year-old woman with hand involvement.
A: Coronal STIR shows severe articular surface erosions with subchondral edema and synovial hypertrophy at the 3rd metatarsal-phalangeal joint (arrow); B: Axial DWI b800 demonstrates markedly restricted diffusion within this joint (arrow, B) with good correlation on (C) STIR and DWI b 800 fused image; D, E: (D) DCE-MRI relative enhancement map shows increased enhancement and (E) TIC of the involved joint (red curve) shows an initial fast enhancement which becomes more progressive and slow in late phases in comparison to the adjacent normal joint (green curve). STIR: Short inversion time recovery; DWI: Diffusion-weighted imaging; MRI: Magnetic resonance imaging; DCE: Dynamic contrast enhancement.
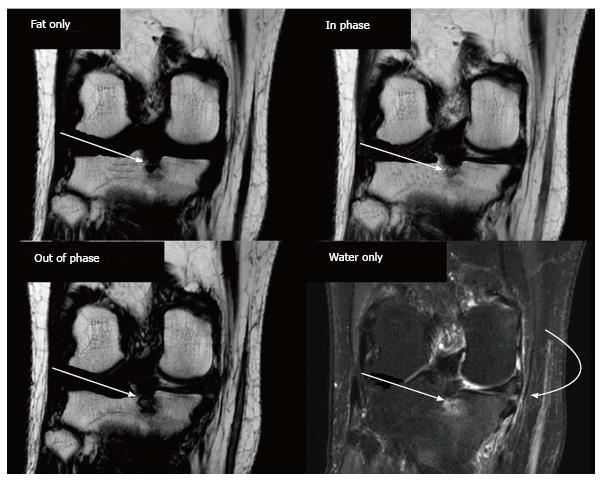
Figure 10 DIXON for evaluation of osteoarthritis in a 56-year-old woman with chronic knee pain.
A subchondral geode is identified at the medial aspect of the medial tibial plateau (arrow), which is more conspicuous in the opposed-phase image than in the in-phase image suggesting edematous changes, as confirmed in the water-only acquisition. The water only image also shows soft tissue edema at the body of the medial meniscus and medial collateral ligament (curved arrow).
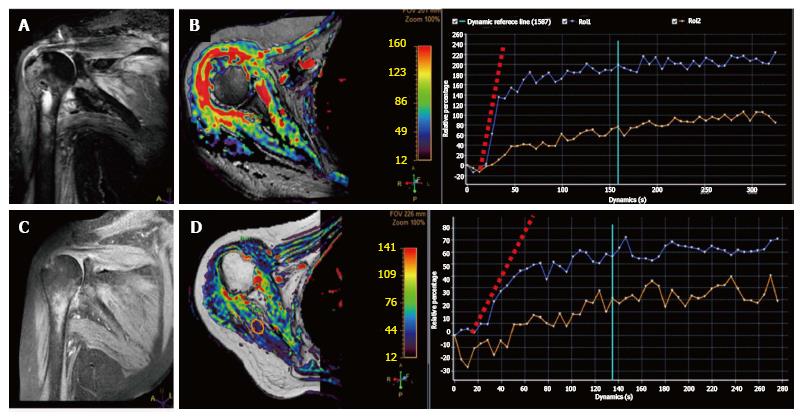
Figure 11 Magnetic resonance follow-up of septic arthritis in a 58-year-old woman with shoulder pain, fever, and swelling.
A: Coronal STIR shows severe edema within the proximal humerus as well as in the surrounding soft tissues with minimal intraarticular fluid; B: DCE-MRI relative enhancement map demonstrates extensive enhancement in the synovium and the humeral head; C, D: Follow-up MRI study 3 wk after intravenous antibiotic therapy demonstrates adequate response to treatment with reduction of edema on STIR and enhancement on DCE-MRI. Note also the change in the initial slope of the blue TIC (synovial enhancement) between pre and post-treatment studies. The orange TIC shows healthy muscle contrast enhancement as an internal reference. STIR: Short inversion time recovery; DWI: Diffusion-weighted imaging; MRI: Magnetic resonance imaging; DCE: Dynamic contrast enhancement.
Figure 12 Treatment monitoring with magnetic resonance imaging in a 26-year-old gymnast with knee pain.
Initial MRI (A) shows mild cartilage thinning at the medial femoral condyle with subchondral damage PD image. A moderate increase in T2 relaxation values (arrow) confirms the loss of collagen fibers in this area. Patient underwent MTX therapy and a follow-up MRI performed 3 mo later (B) demonstrates moderate chondral irregularity with focal areas of increased signal intensity on PD. T2 mapping demonstrates normalization of T2 relaxation time values compared with the pre-treatment study due to the generation of new fibrous cartilage. MRI: Magnetic resonance imaging; MTX: Microfracturing therapy; PD: Proton-density images.
- Citation: Martín Noguerol T, Luna A, Gómez Cabrera M, Riofrio AD. Clinical applications of advanced magnetic resonance imaging techniques for arthritis evaluation. World J Orthop 2017; 8(9): 660-673
- URL: https://www.wjgnet.com/2218-5836/full/v8/i9/660.htm
- DOI: https://dx.doi.org/10.5312/wjo.v8.i9.660


