Copyright
©The Author(s) 2015.
World J Orthop. Dec 18, 2015; 6(11): 961-969
Published online Dec 18, 2015. doi: 10.5312/wjo.v6.i11.961
Published online Dec 18, 2015. doi: 10.5312/wjo.v6.i11.961
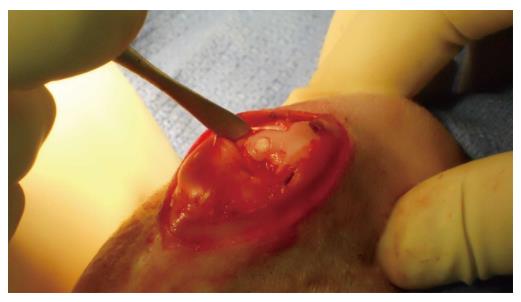
Figure 1 Intraoperative photograph of autologous osteochondral transplantation following graft placement.
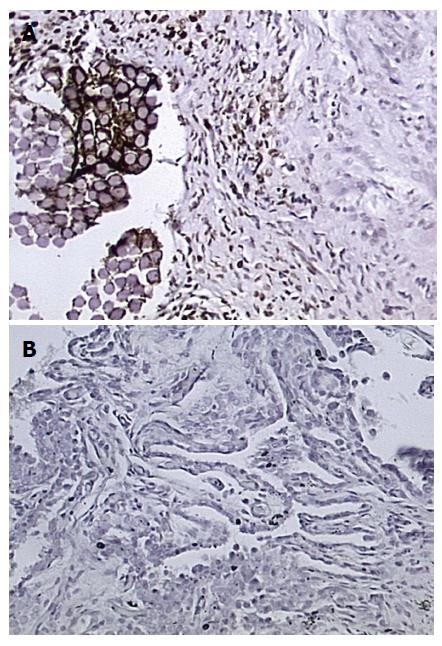
Figure 2 Synovial sections harvested six weeks following surgery (400 ×).
Transforming growth factor-beta1 antibody staining is positive in cells that appear brown. A: Treated with platelet-rich plasma; B: Treated with saline.
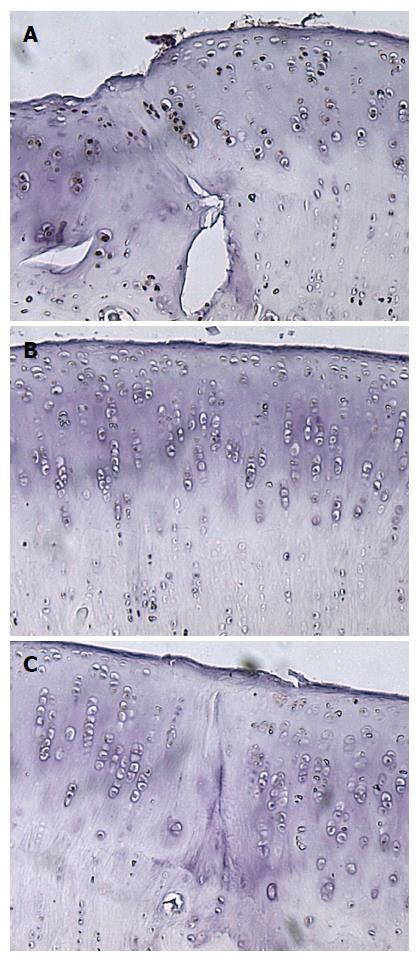
Figure 3 Sagittal sections of an osteochondral graft treated with platelet-rich plasma 12 wk following surgery (400 ×).
Transforming growth factor-beta1 antibody staining is positive in cells that appear brown. A: Left interface between the graft and host cartilage; B: Central aspect of the graft; C: Right interface between the graft and host cartilage.
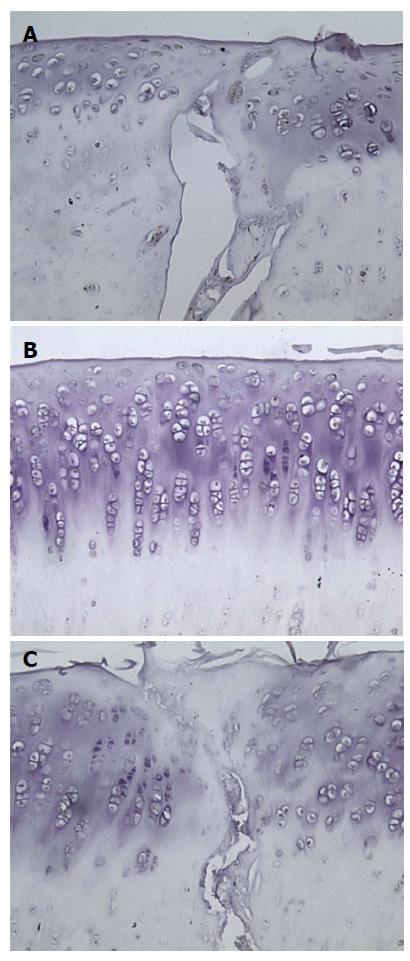
Figure 4 Sagittal sections of an osteochondral graft treated with saline 12 wk following surgery (400 ×).
Transforming growth factor-beta1 antibody staining is positive in cells that appear brown. A: Left interface between the graft and host cartilage; B: Central aspect of the graft; C: Right interface between the graft and host cartilage.
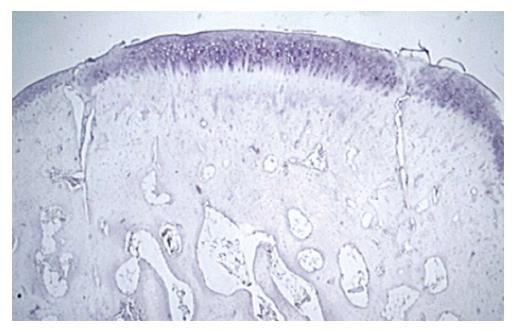
Figure 5 Sagittal section of the same osteochondral graft (20 ×).
The graft was treated with saline and the knee was harvested 12 wk following surgery. The interface between host and graft tissue is integrated at points but considerable gapping remains.
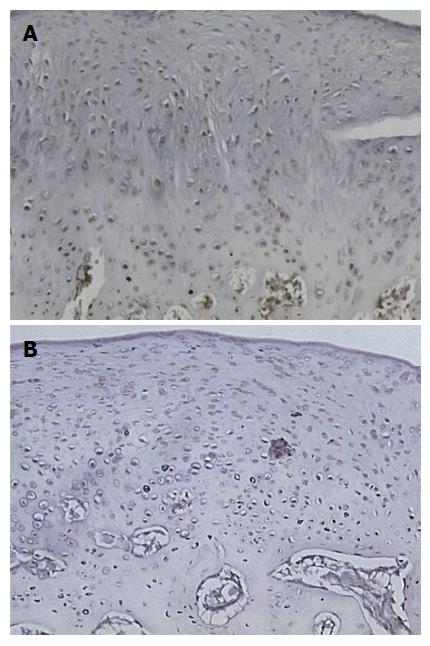
Figure 6 Sagittal sections femoral condyle articular cartilage remote for the autologous osteochondral transplantation graft site (400 ×).
Transforming growth factor-beta1 antibody staining is positive in cells that are stained brown. The top section was in the left knee which was treated with platelet-rich plasma and had the second highest ICRS score (20) and the bottom section is taken from the right knee which received saline with the lowest ICRS score (7). ICRS: International Cartilage Repair Society.
- Citation: Boakye LA, Ross KA, Pinski JM, Smyth NA, Haleem AM, Hannon CP, Fortier LA, Kennedy JG. Platelet-rich plasma increases transforming growth factor-beta1 expression at graft-host interface following autologous osteochondral transplantation in a rabbit model. World J Orthop 2015; 6(11): 961-969
- URL: https://www.wjgnet.com/2218-5836/full/v6/i11/961.htm
- DOI: https://dx.doi.org/10.5312/wjo.v6.i11.961


