Copyright
©The Author(s) 2025.
World J Orthop. Aug 18, 2025; 16(8): 106982
Published online Aug 18, 2025. doi: 10.5312/wjo.v16.i8.106982
Published online Aug 18, 2025. doi: 10.5312/wjo.v16.i8.106982
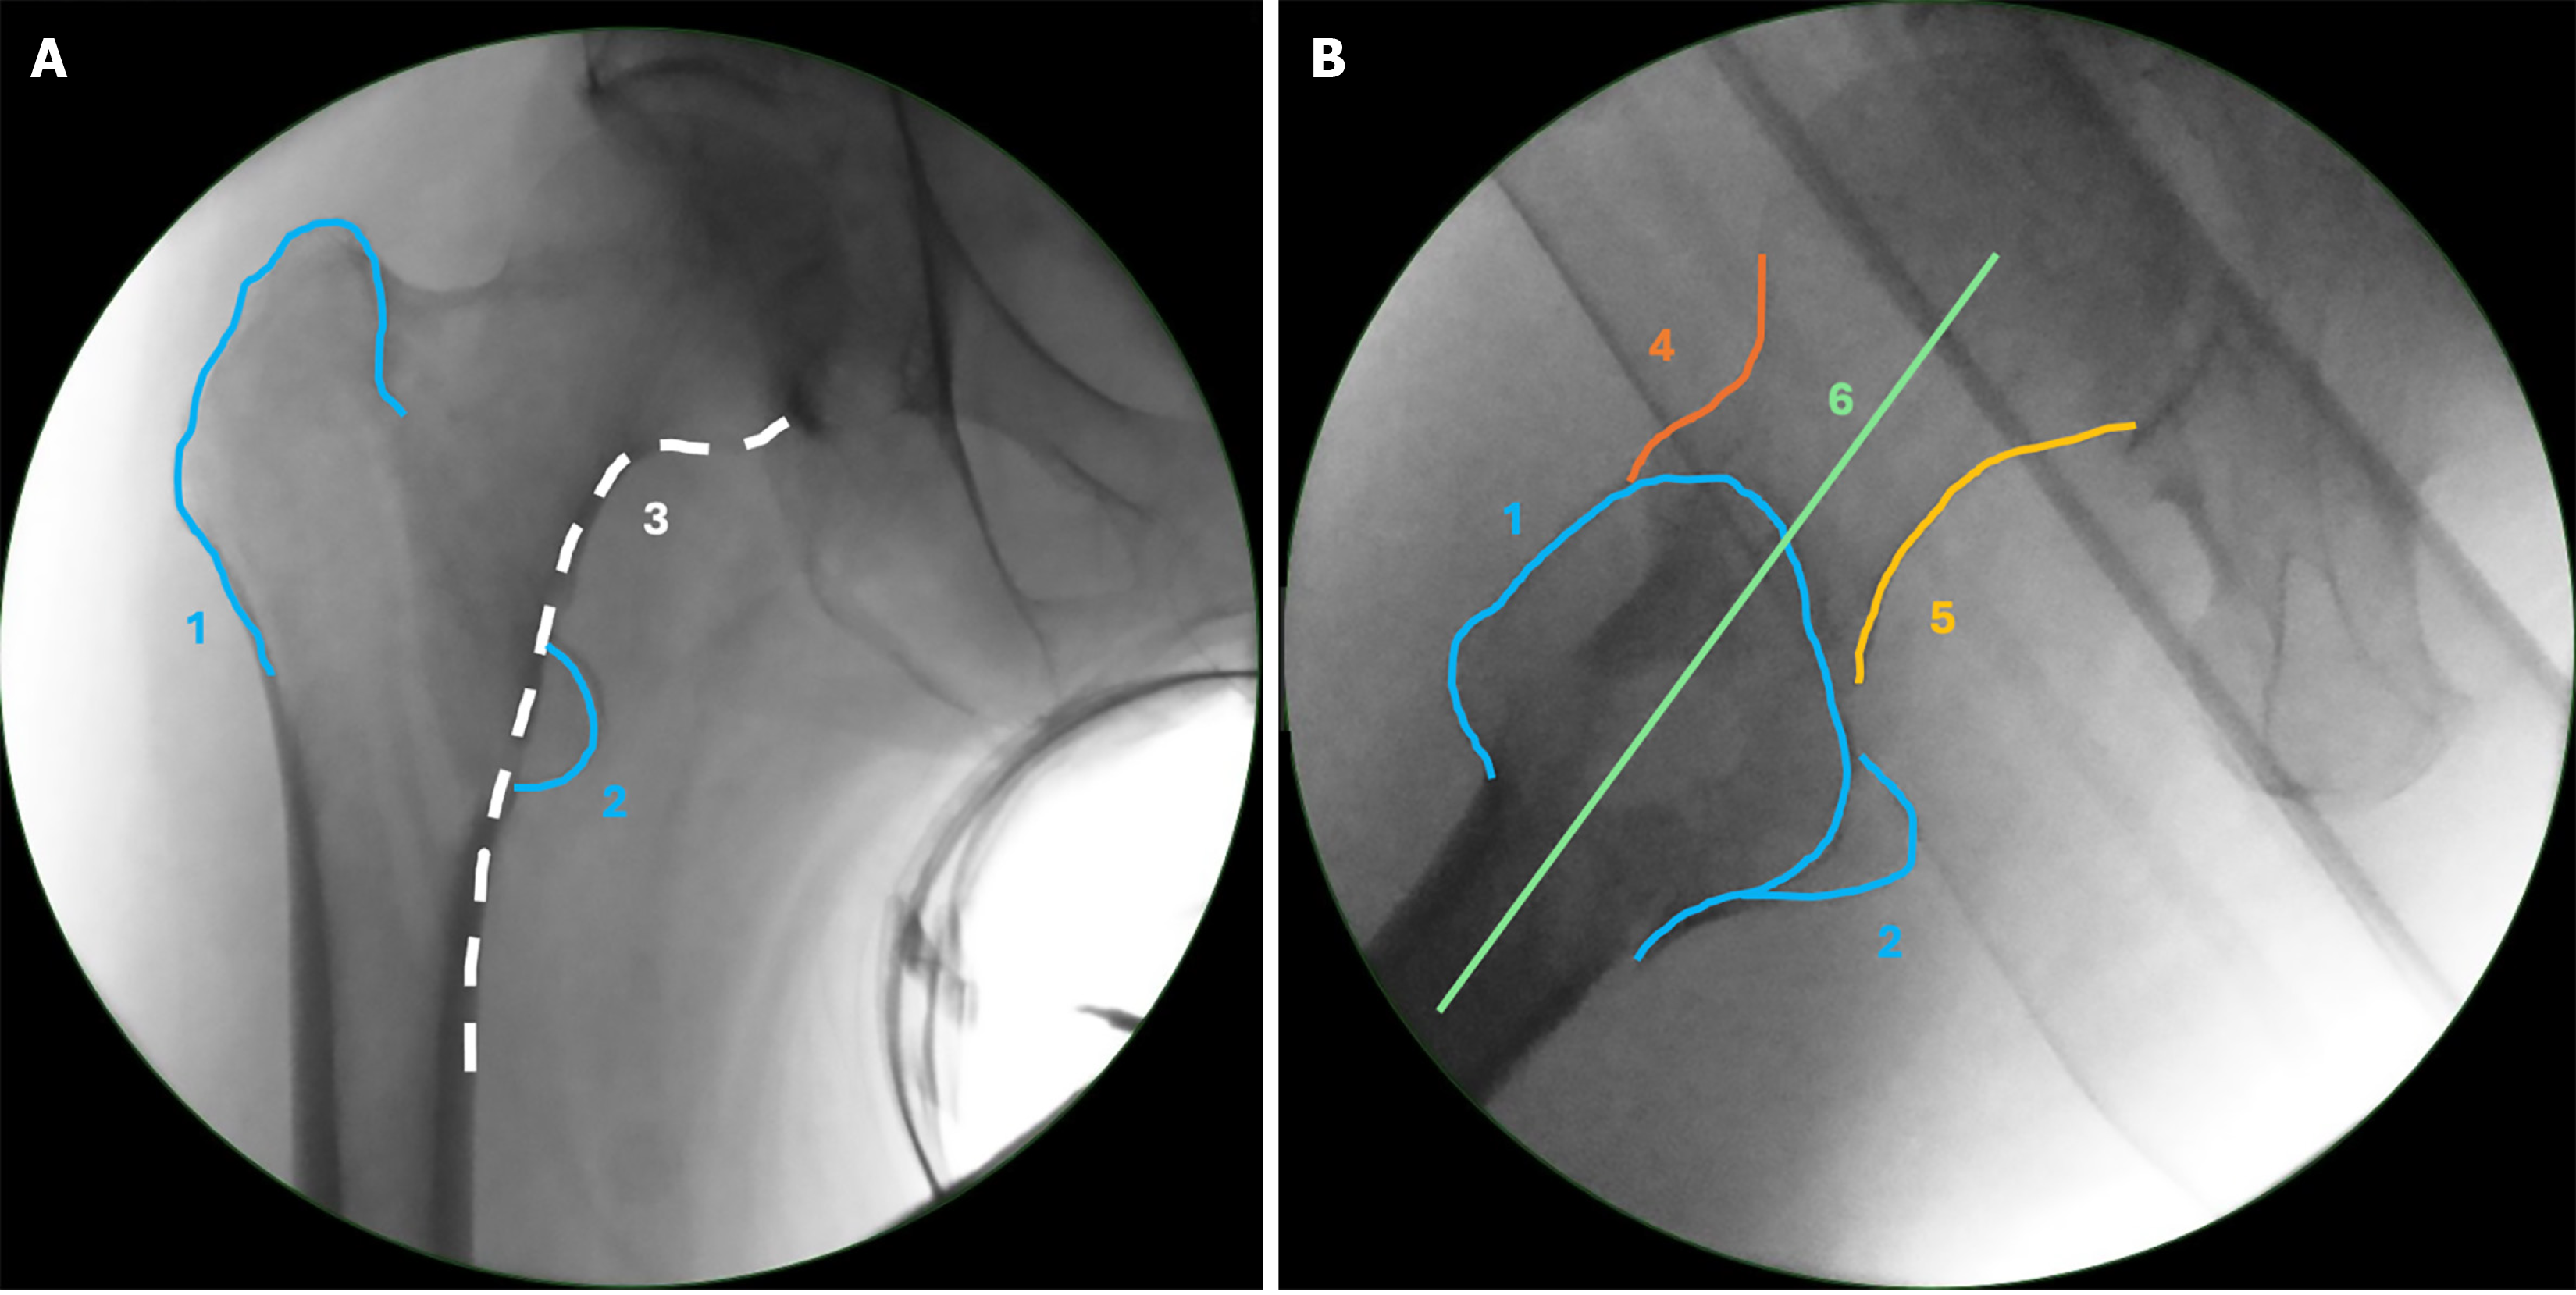
Figure 1 Anatomical landmarks and lines of the proximal femur in anteroposterior and lateral view.
A: Anteroposterior view; B: Lateral view. Greater trochanter (1), lesser trochanter (2), Calcar line (3), anterior line (4), posterior line (5), head-neck-shaft line (6).
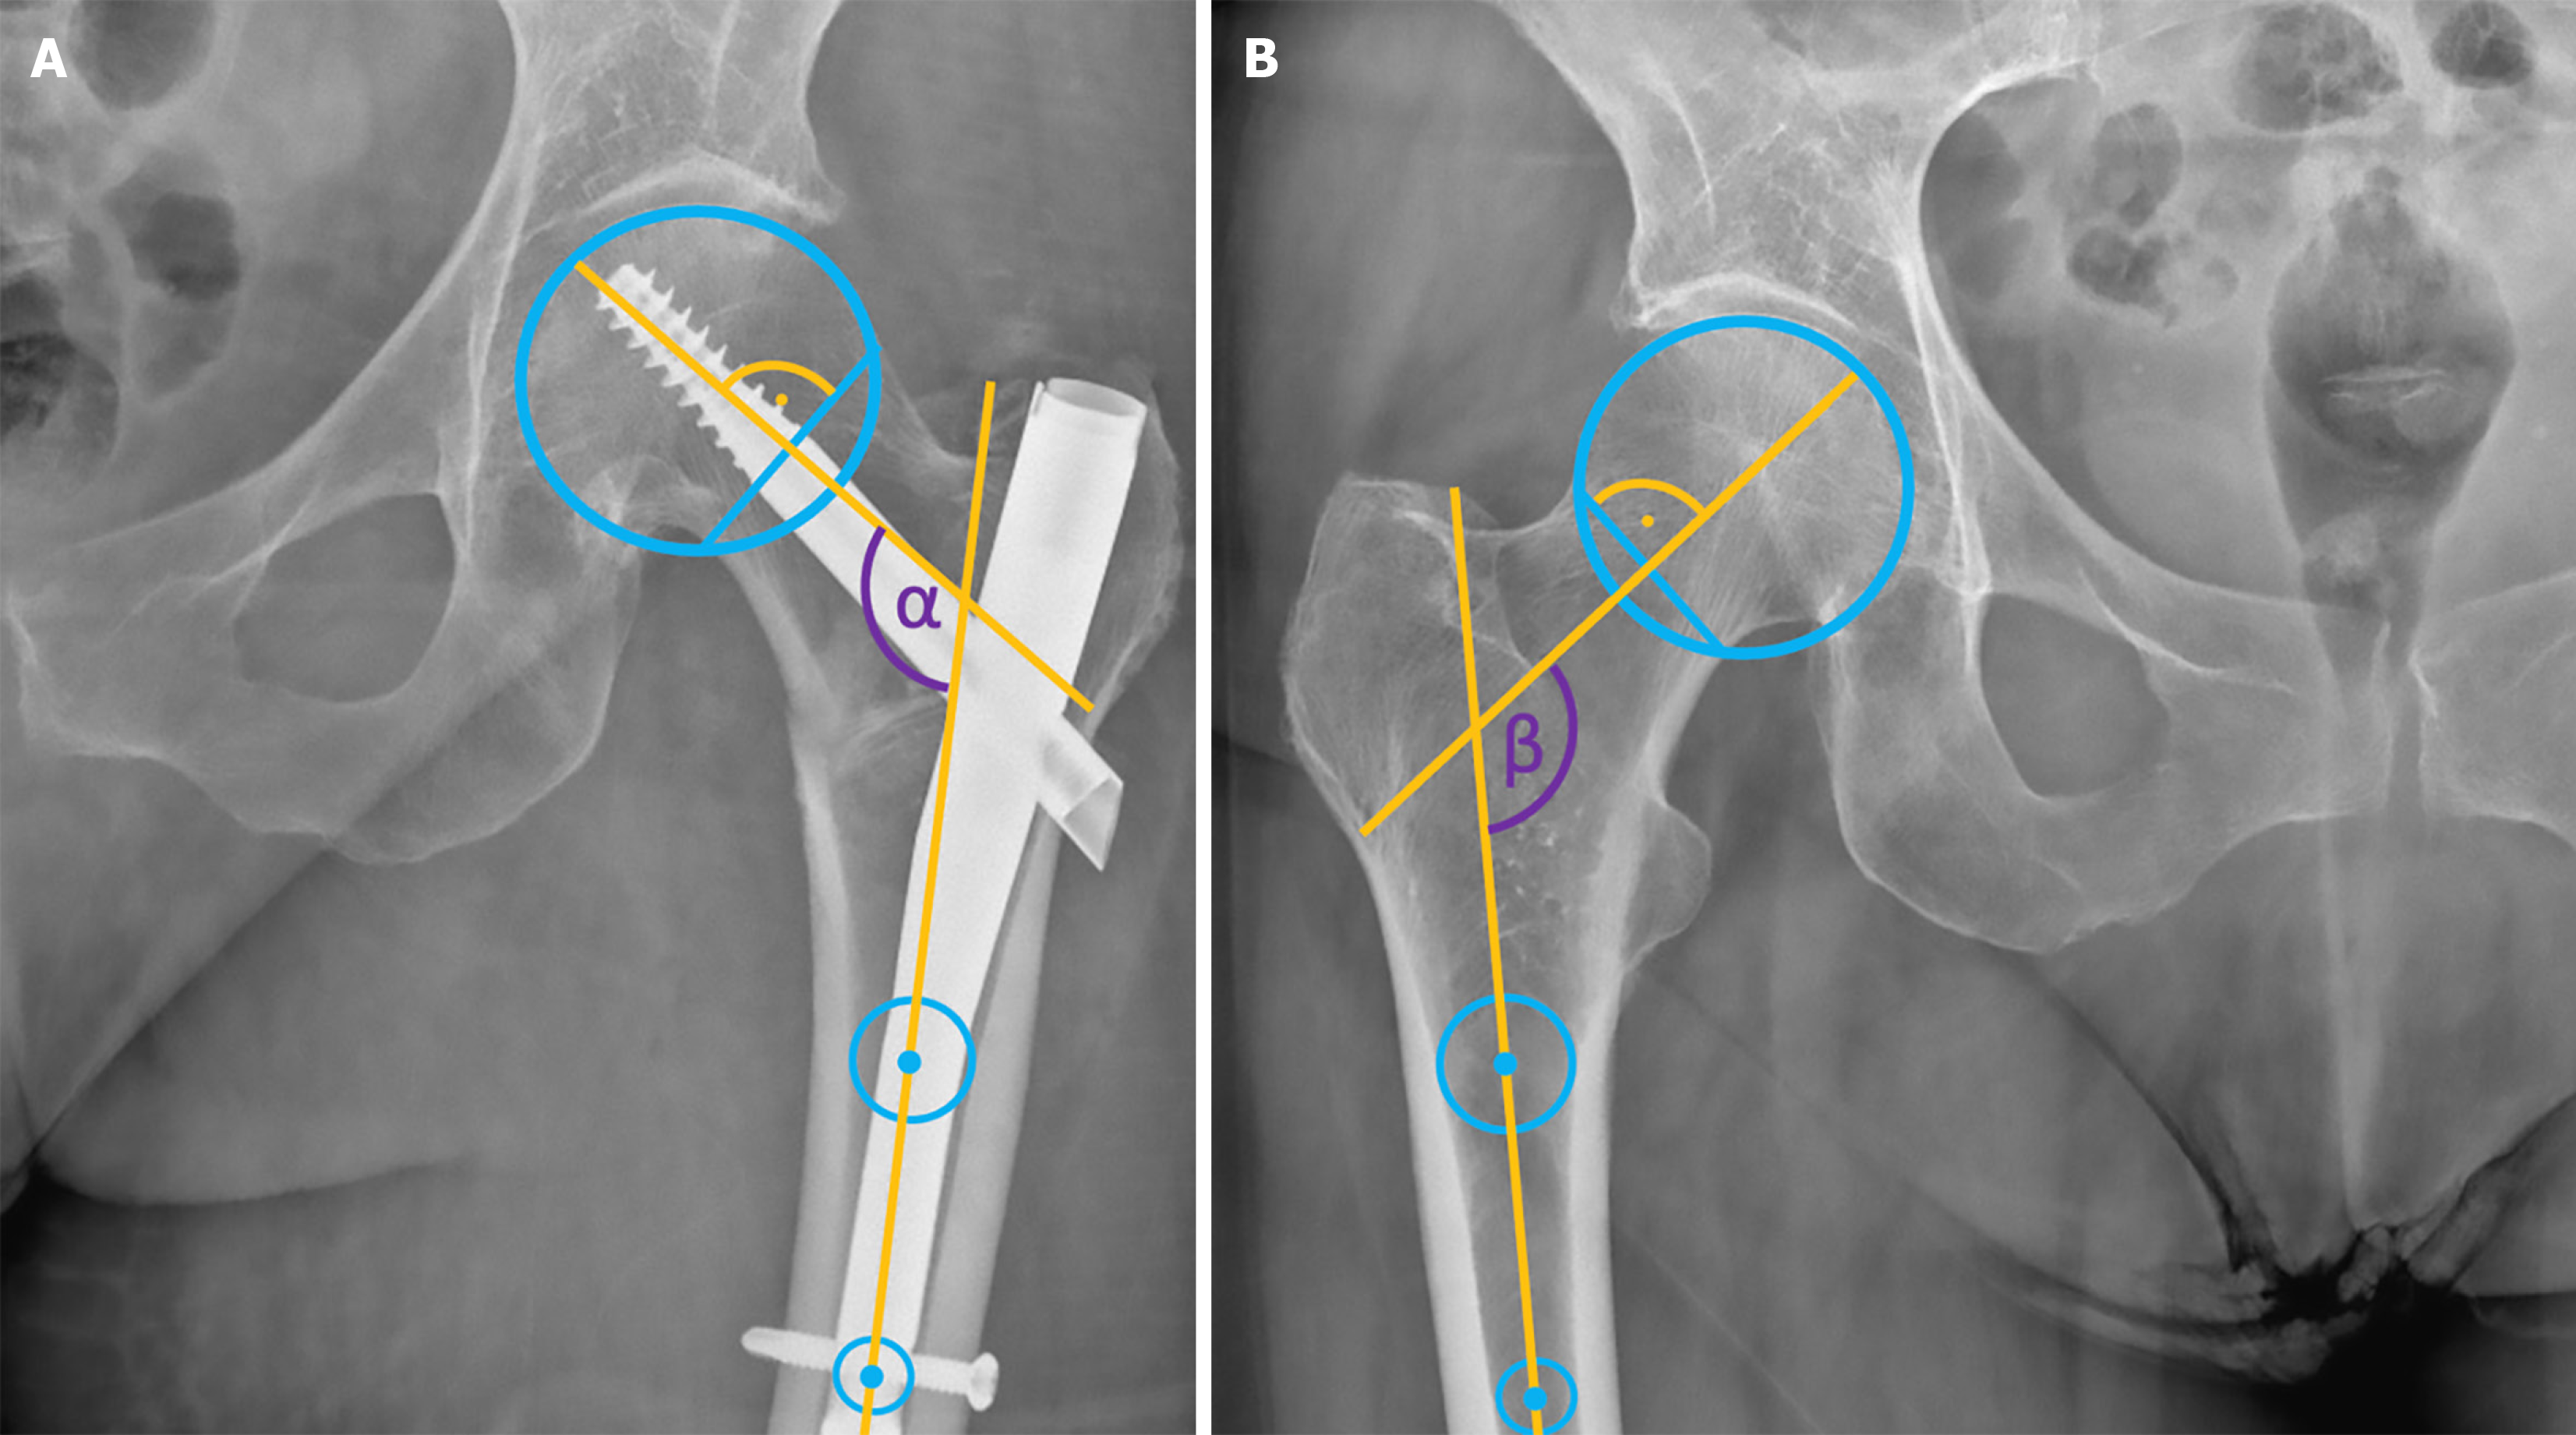
Figure 2 Neck shaft angle assessment in the anteroposterior view.
A: Neck shaft angle (NSA) of the operated hip (violet α); B: NSA of the contralateral healthy hip (violet β).
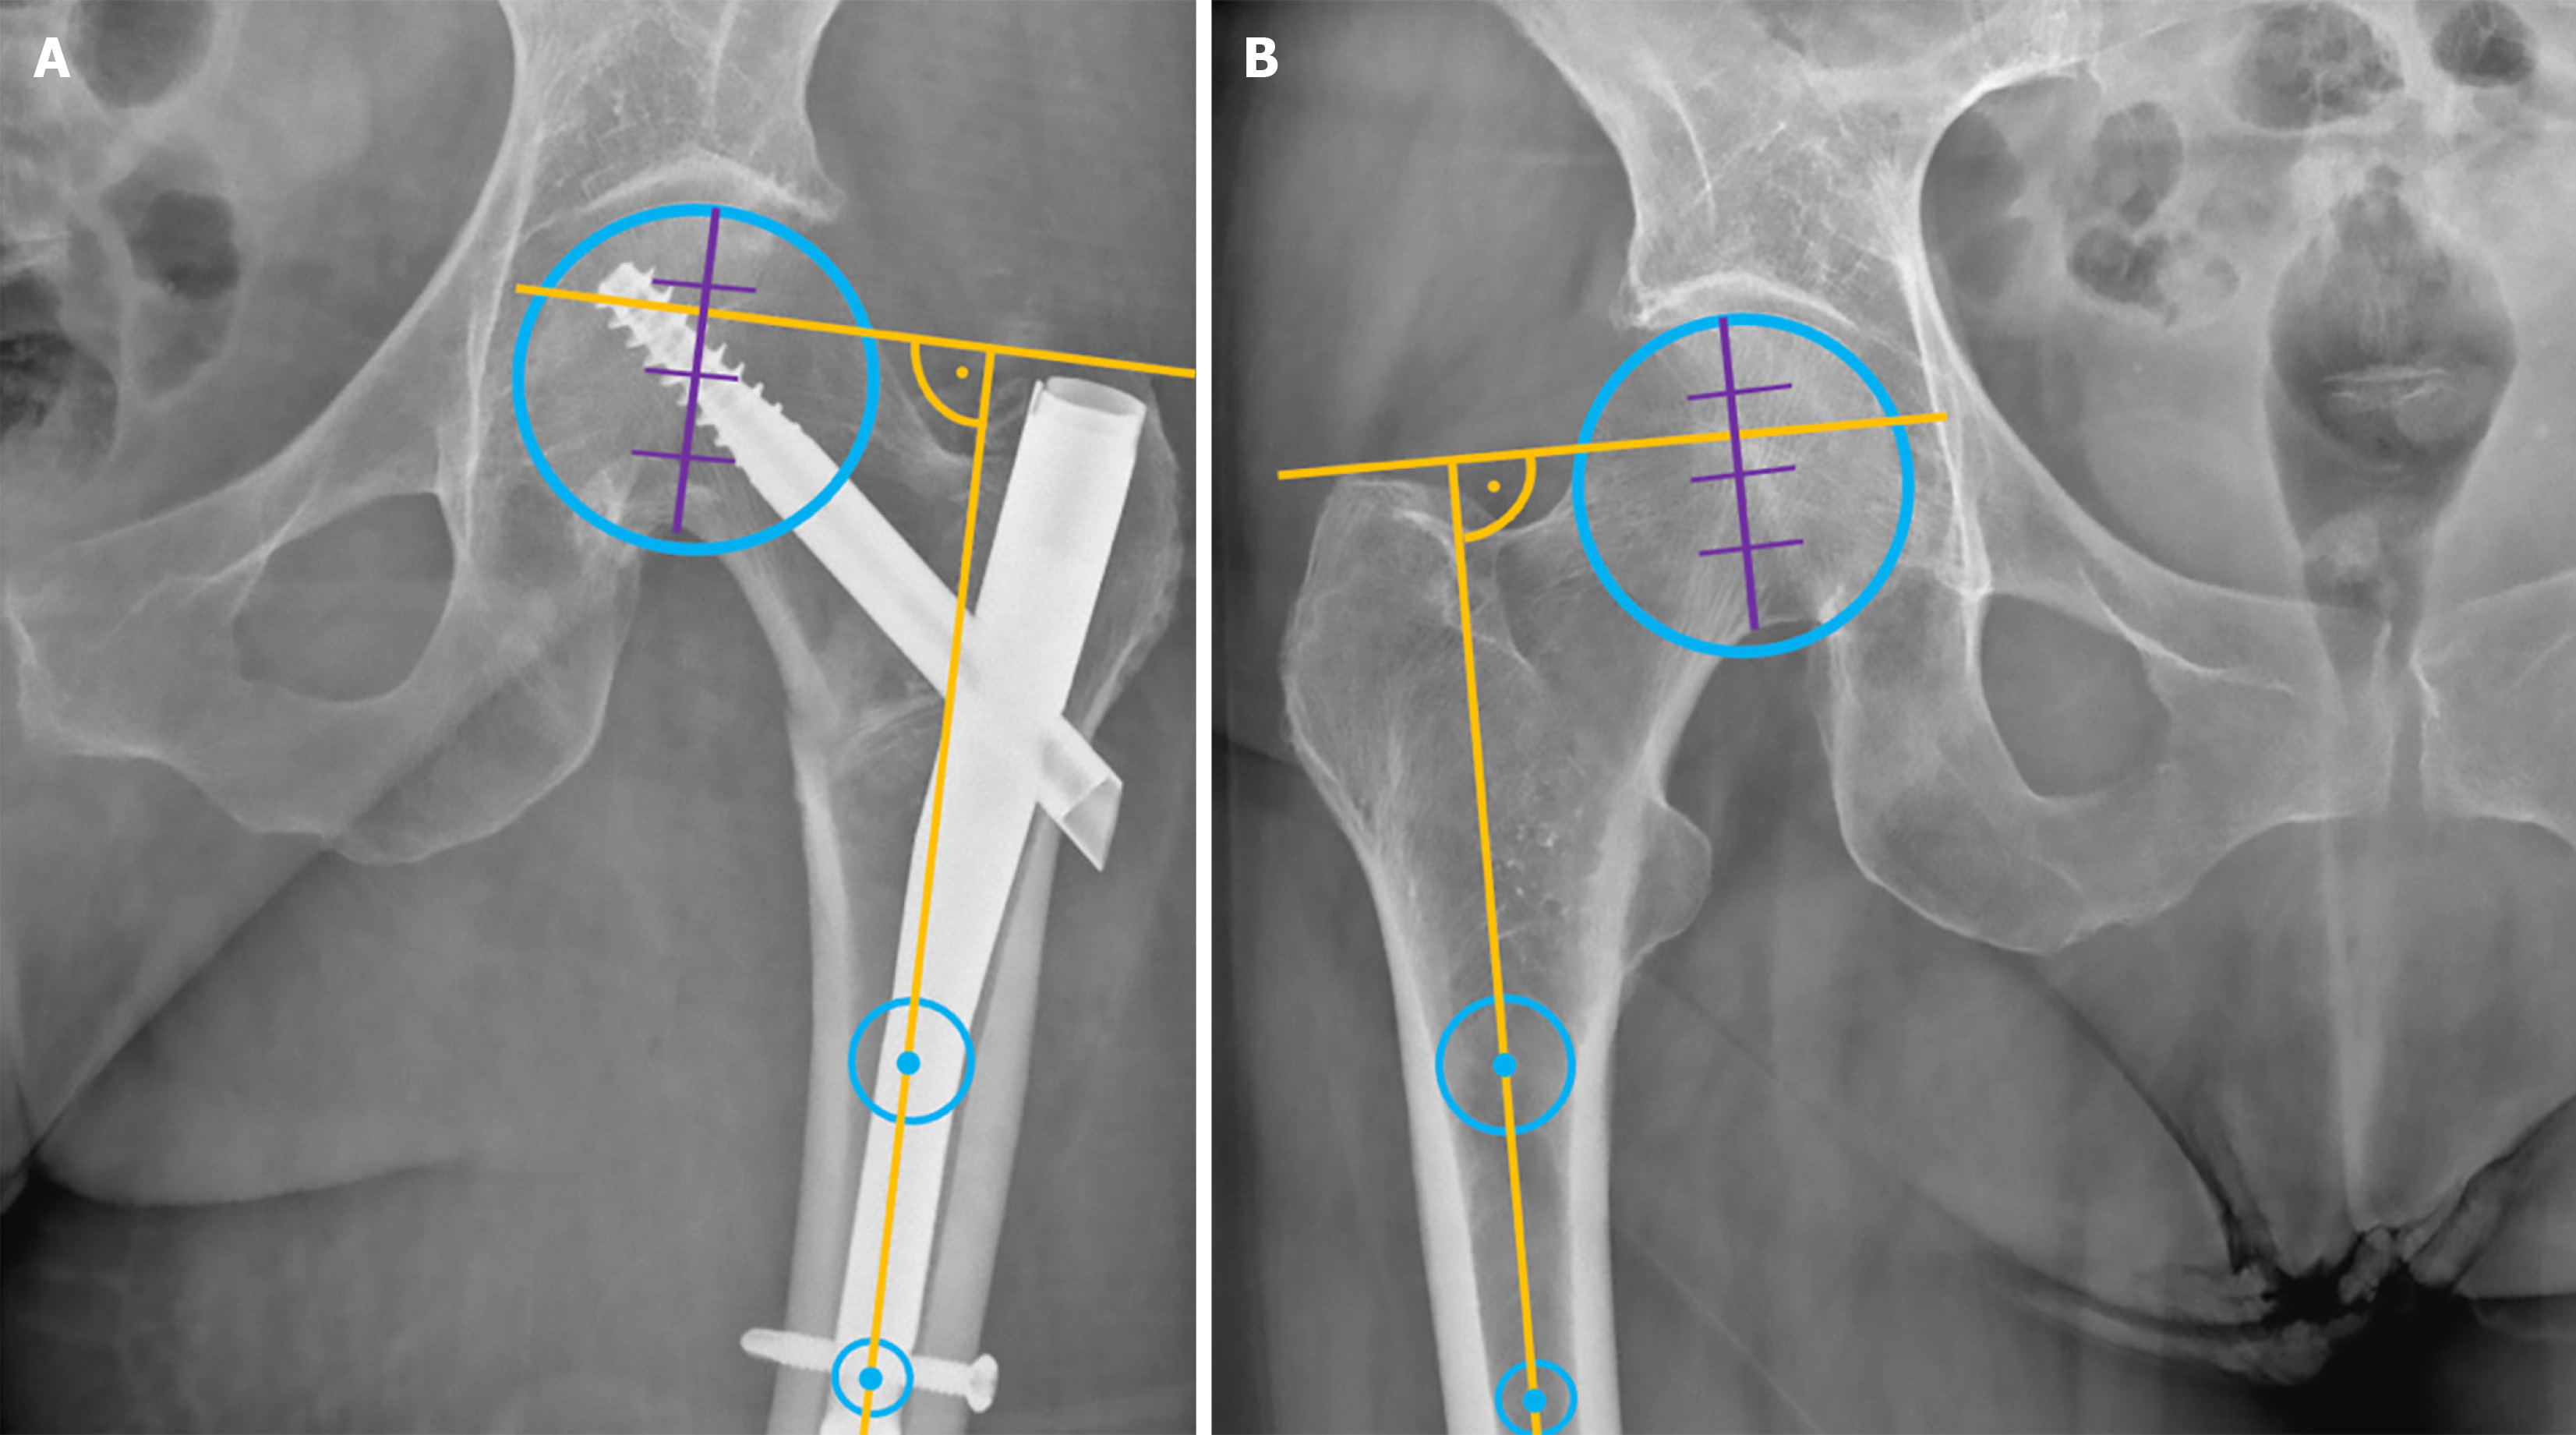
Figure 3 Application of the Greater Trochanter Orthogonal Line: An orthogonal line perpendicular to the anatomical axis of the femur and passing through the level of the tip of the greater trochanter indicates its relative height to the femoral head, which is divided into four zones.
A: The relative height postoperatively; B: Comparison with the contralateral healthy side.
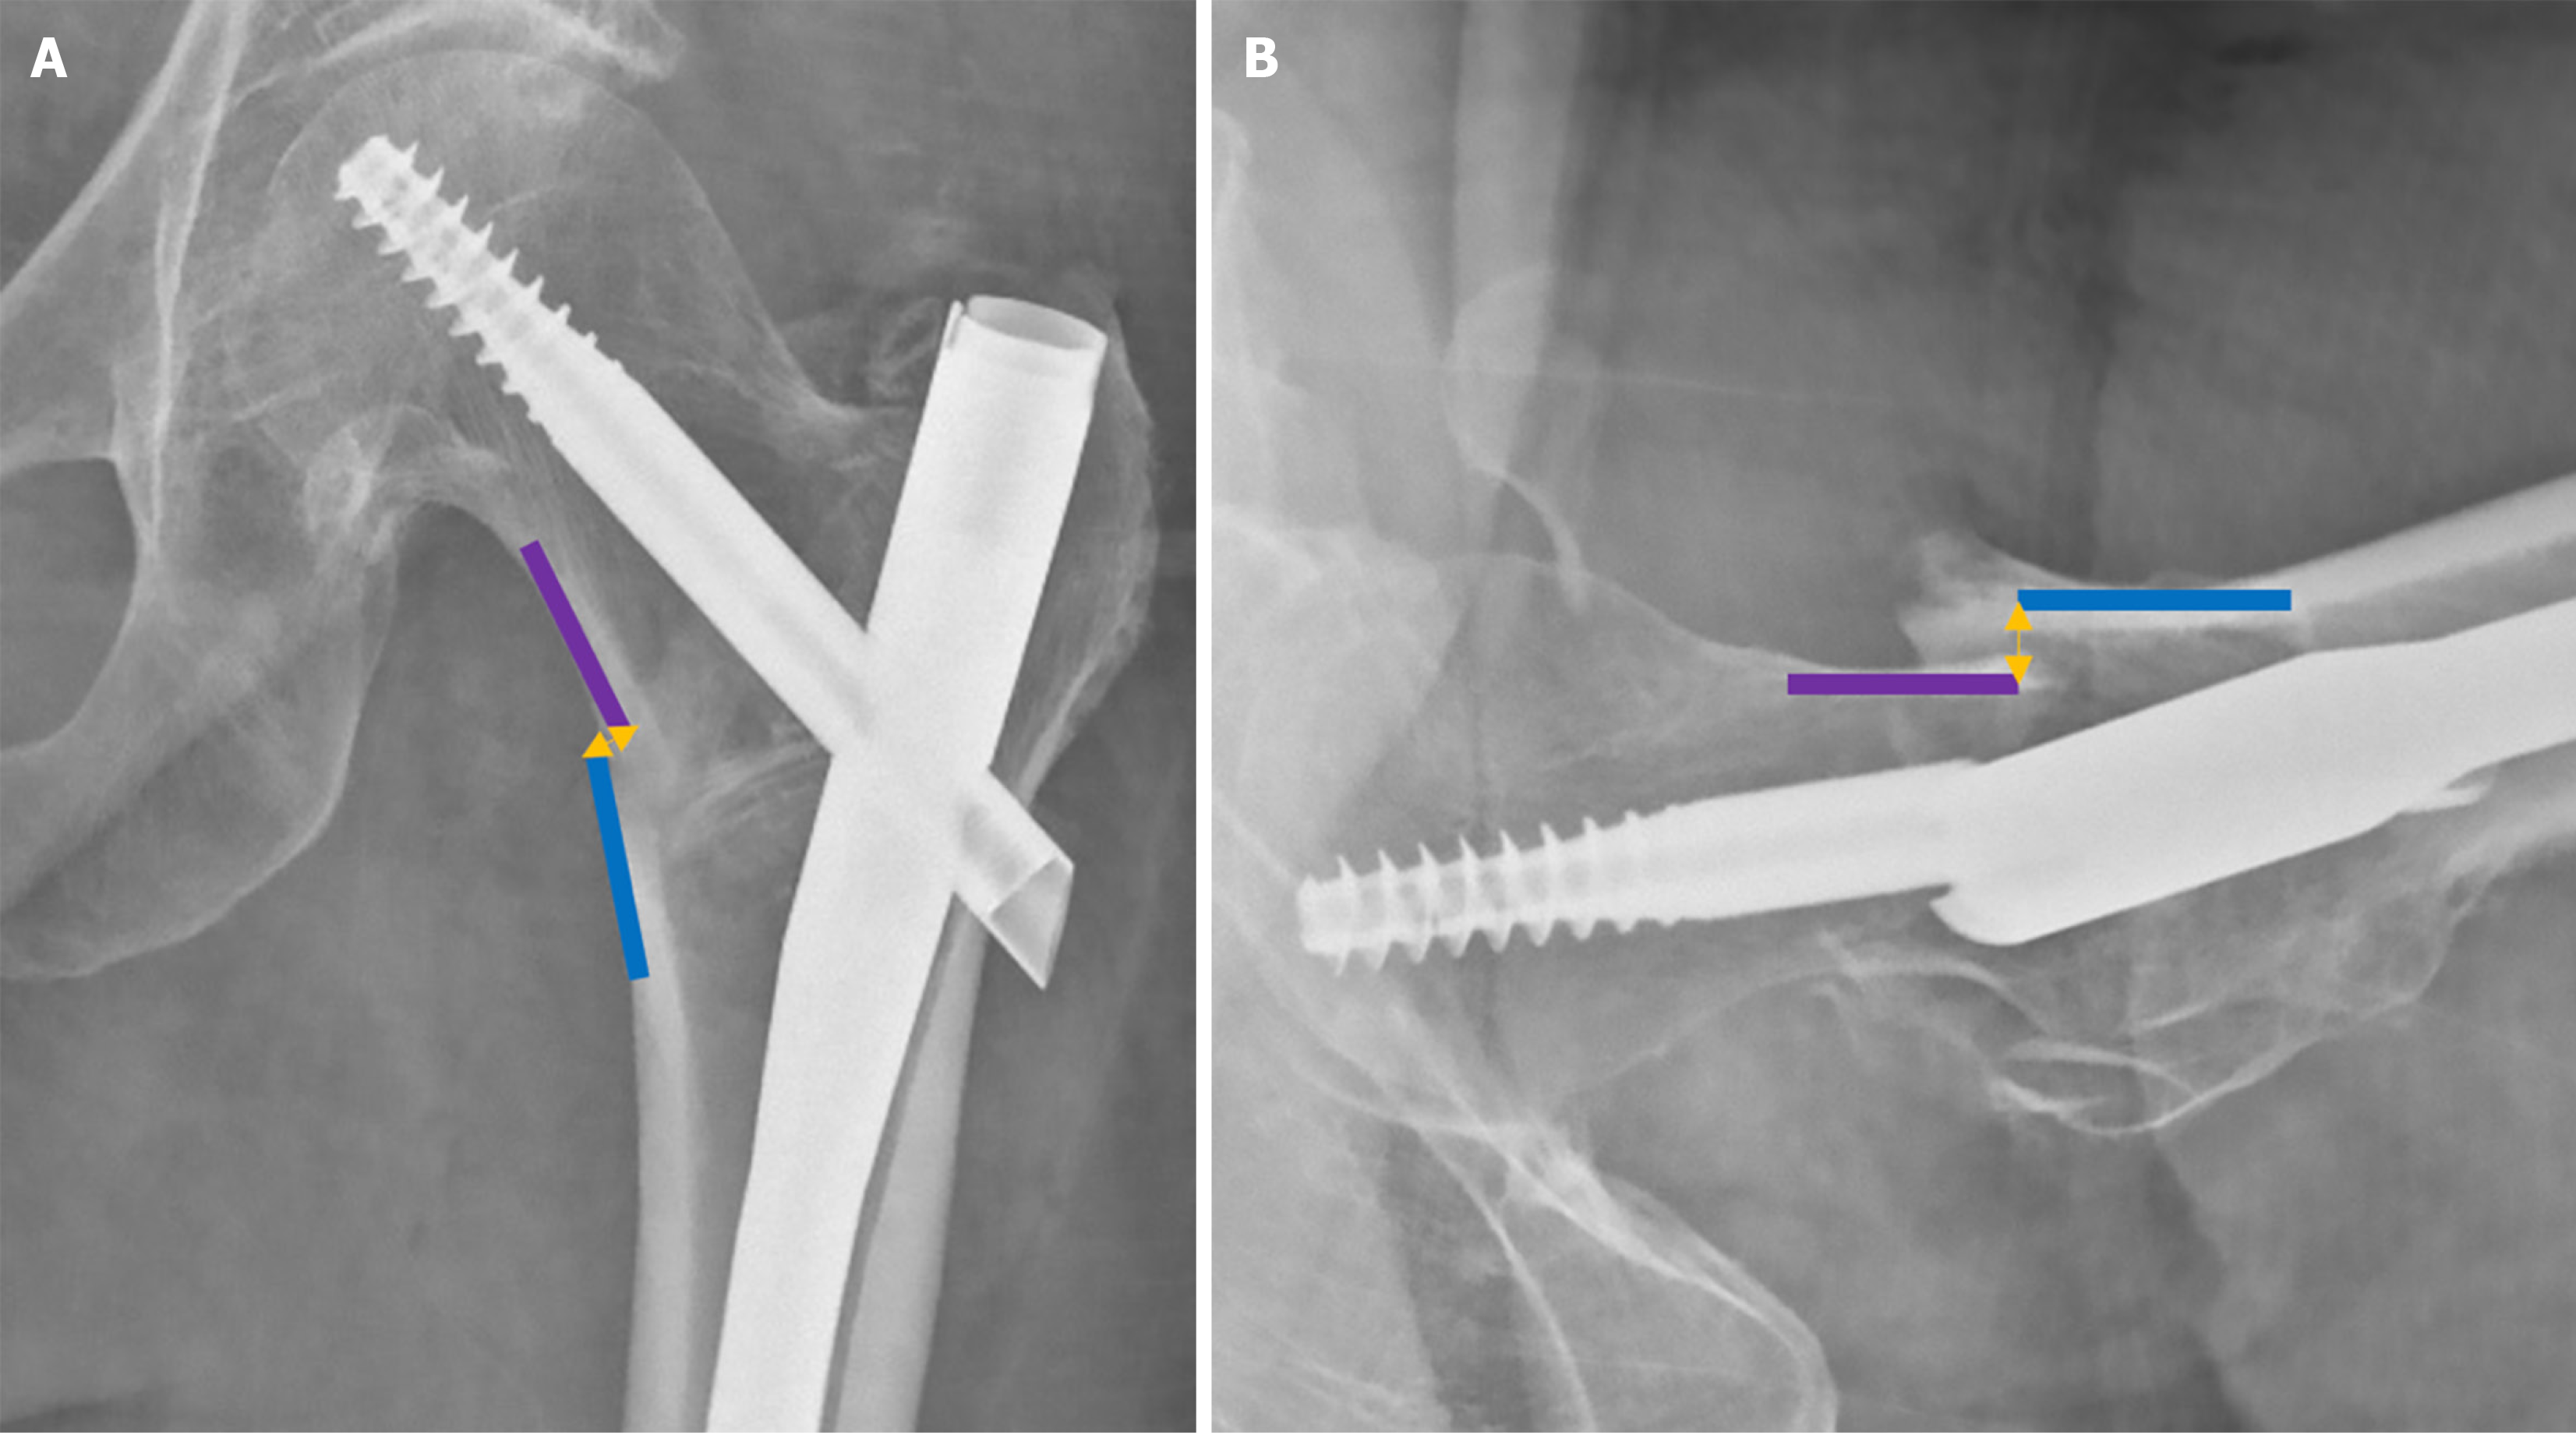
Figure 4 Assessment of calcar displacement relative to the femoral shaft.
A: Negative displacement of the head–neck fragment in the anteroposterior view; B: Posteriorly displaced head–neck fragment in the lateral view.
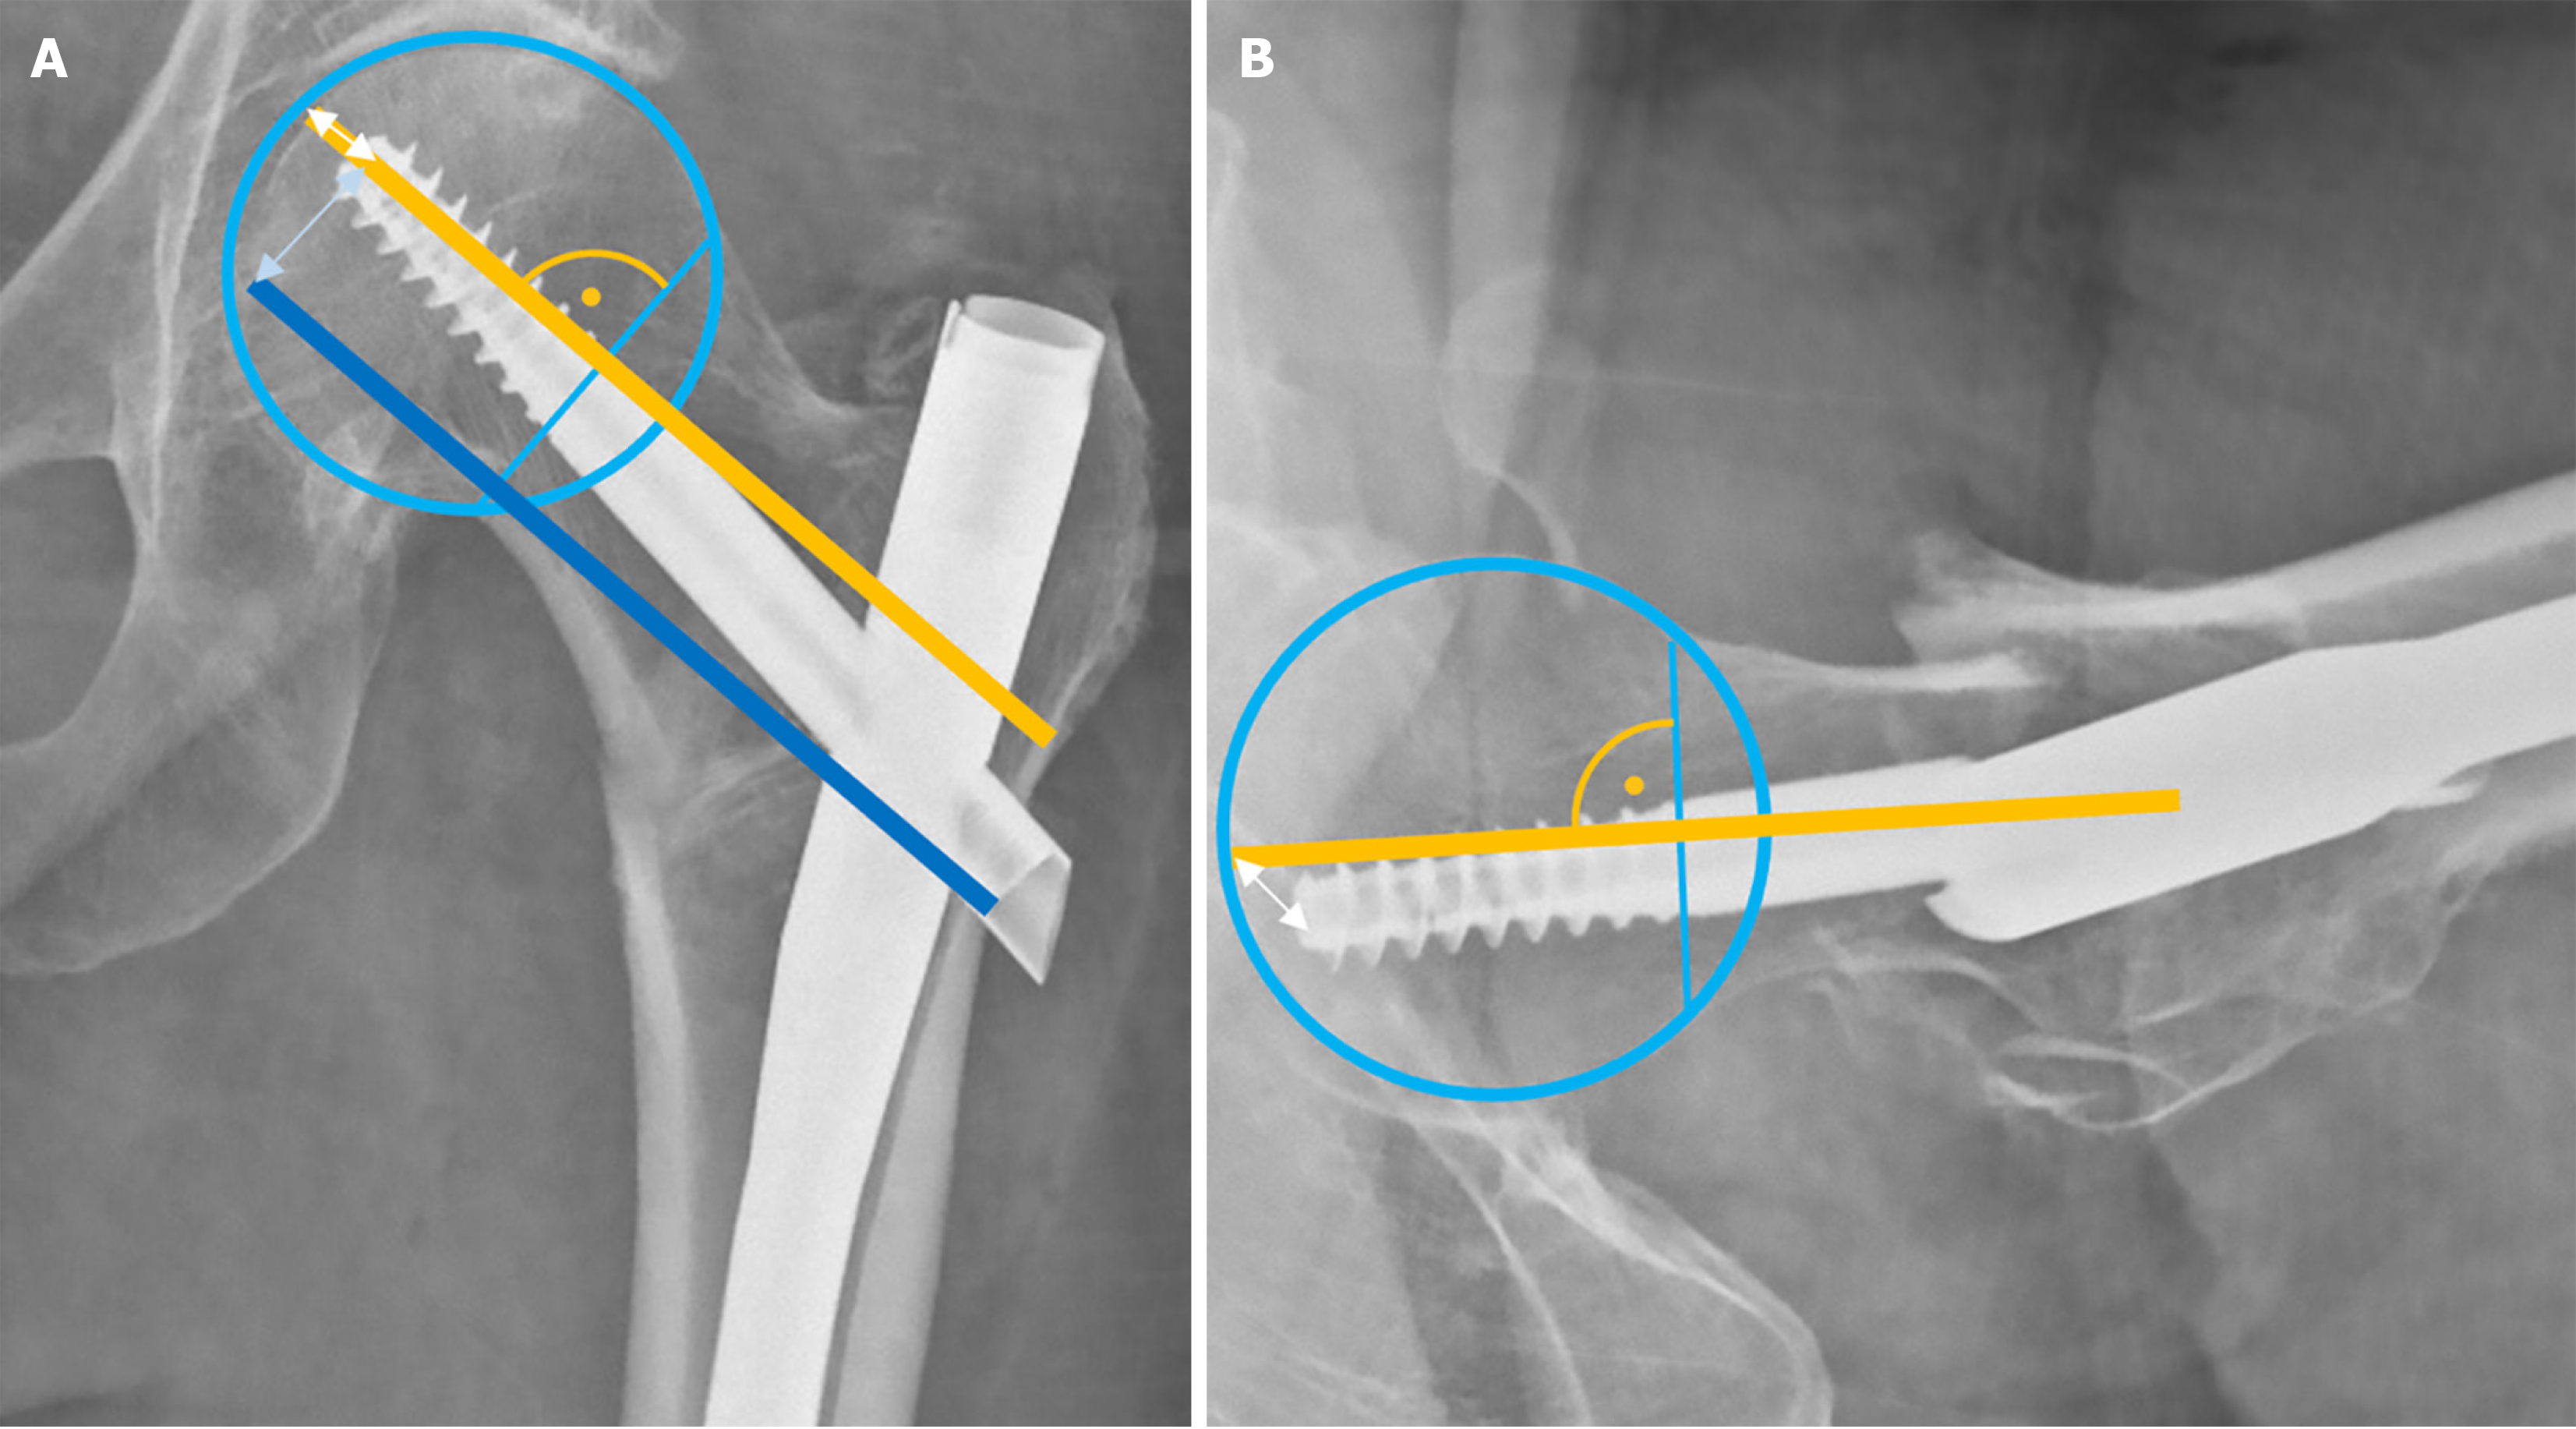
Figure 5 Assessment of tip-apex distance and calcar-referenced tip-apex distance: Both measurements are calculated by summing two distances.
A: On the anteroposterior view, tip-apex distance (TAD) is measured as the distance from the tip of the screw or blade to the apex of the femoral head (white double-headed arrow), while calcar-referenced tip-apex distance (CalTAD) is the distance to the intersection of the calcar reference line (dark blue) with the femoral head (light blue double-headed arrow). B: On the lateral view, the same distance from the tip to the apex of the femoral head (white double-headed arrow) is added to both TAD and CalTAD measurements.
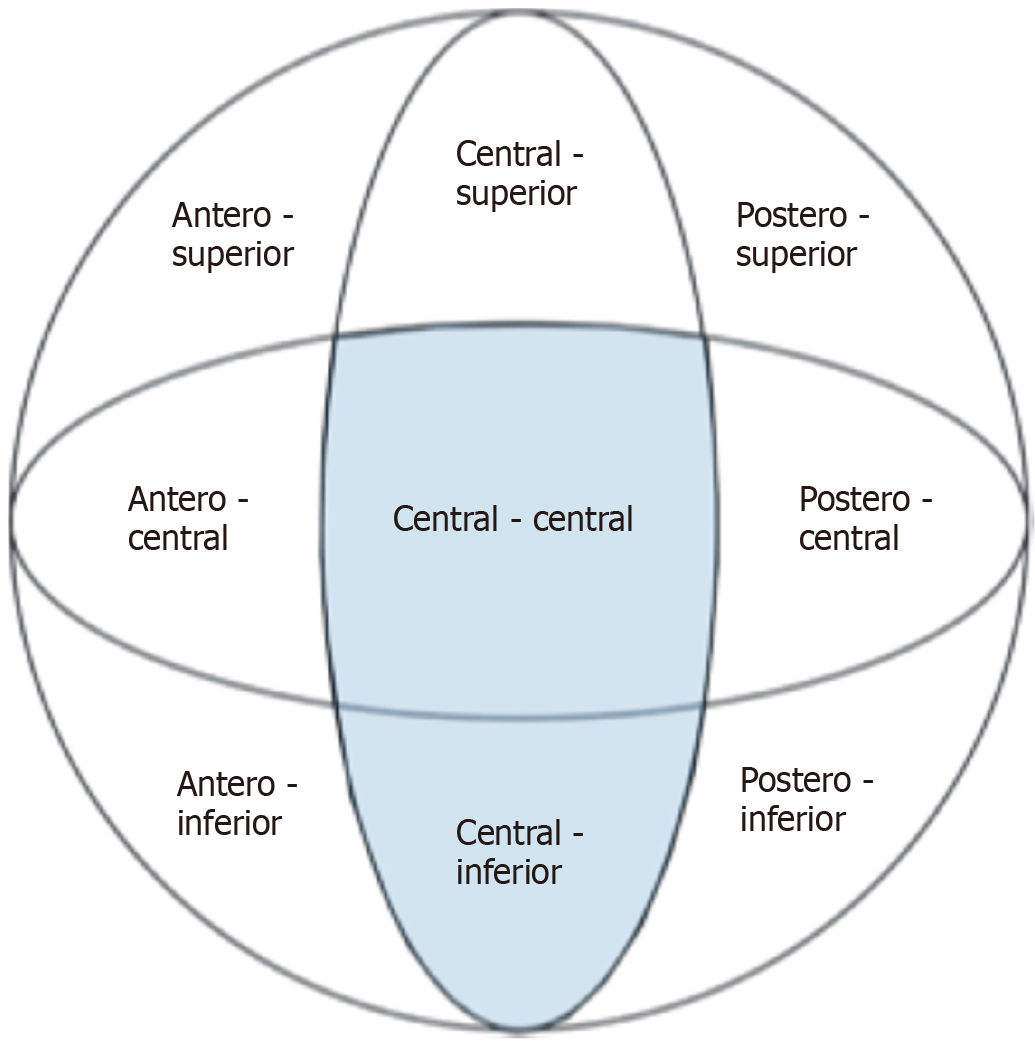
Figure 6 Cleveland zones: The favourable femoral neck component positions—centre-centre and central-inferior—are highlighted in blue.
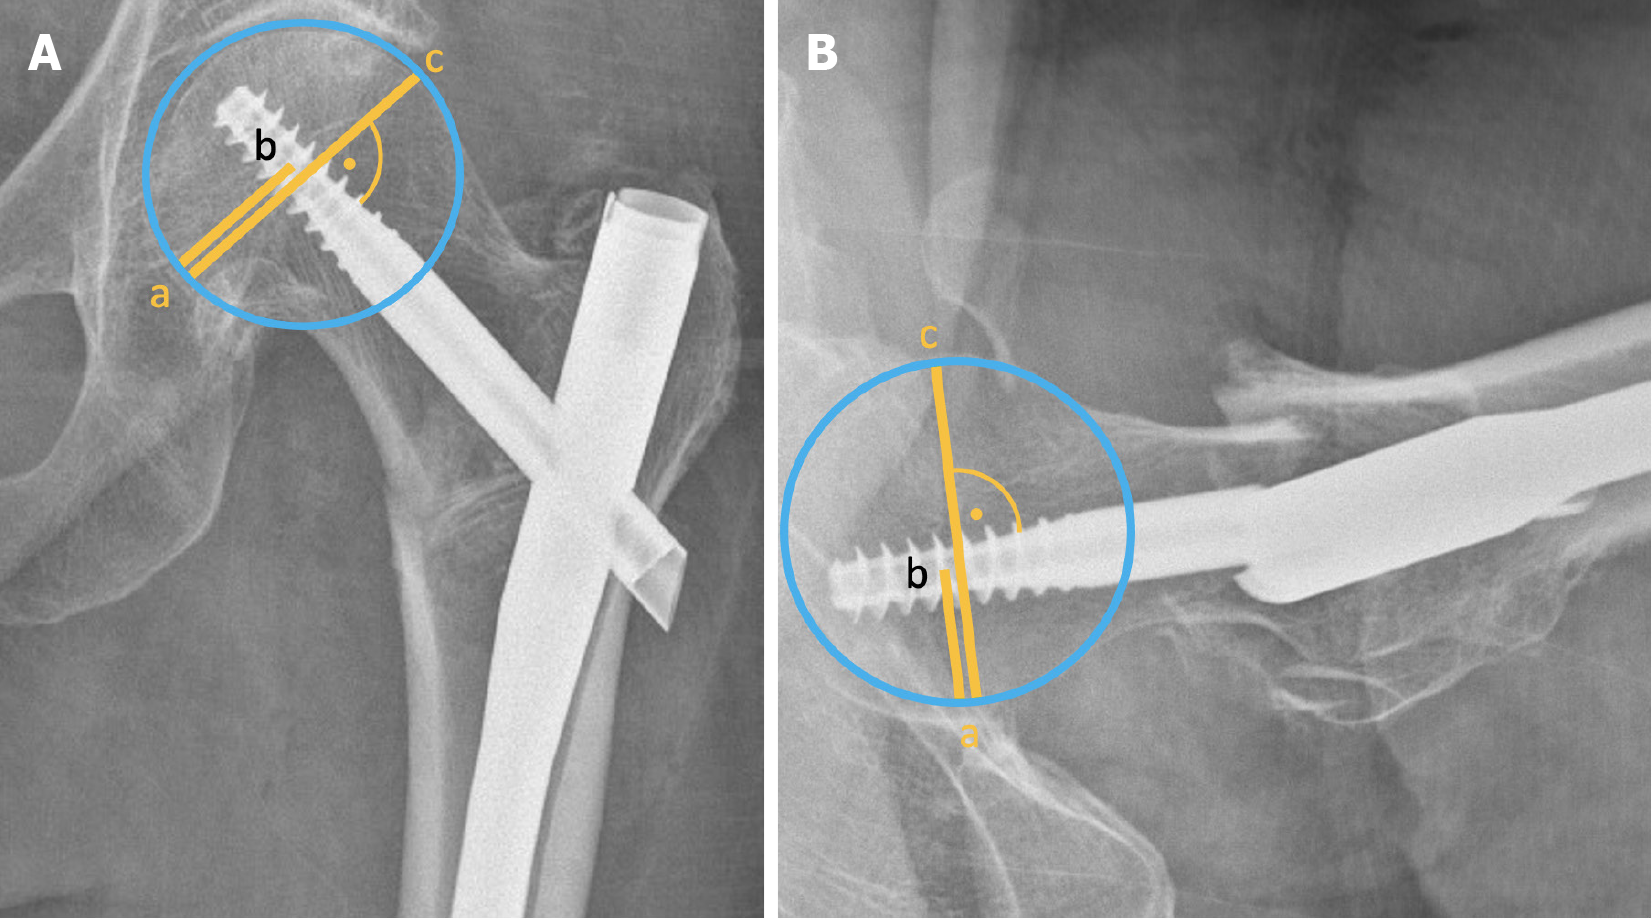
Figure 7 Assessment of Parker’s ratio index = ab/ac × 100.
A: In the anteroposterior; B: In the lateral view.
- Citation: Wittauer M, Henry J, Sánchez-Rosenberg G, Lambers AP, Jones CW, Yates PJ. Evaluation of reduction quality and implant positioning in intertrochanteric fracture fixation: A review of key radiographic parameters. World J Orthop 2025; 16(8): 106982
- URL: https://www.wjgnet.com/2218-5836/full/v16/i8/106982.htm
- DOI: https://dx.doi.org/10.5312/wjo.v16.i8.106982


