Copyright
©The Author(s) 2019.
World J Orthop. Dec 18, 2019; 10(12): 424-433
Published online Dec 18, 2019. doi: 10.5312/wjo.v10.i12.424
Published online Dec 18, 2019. doi: 10.5312/wjo.v10.i12.424
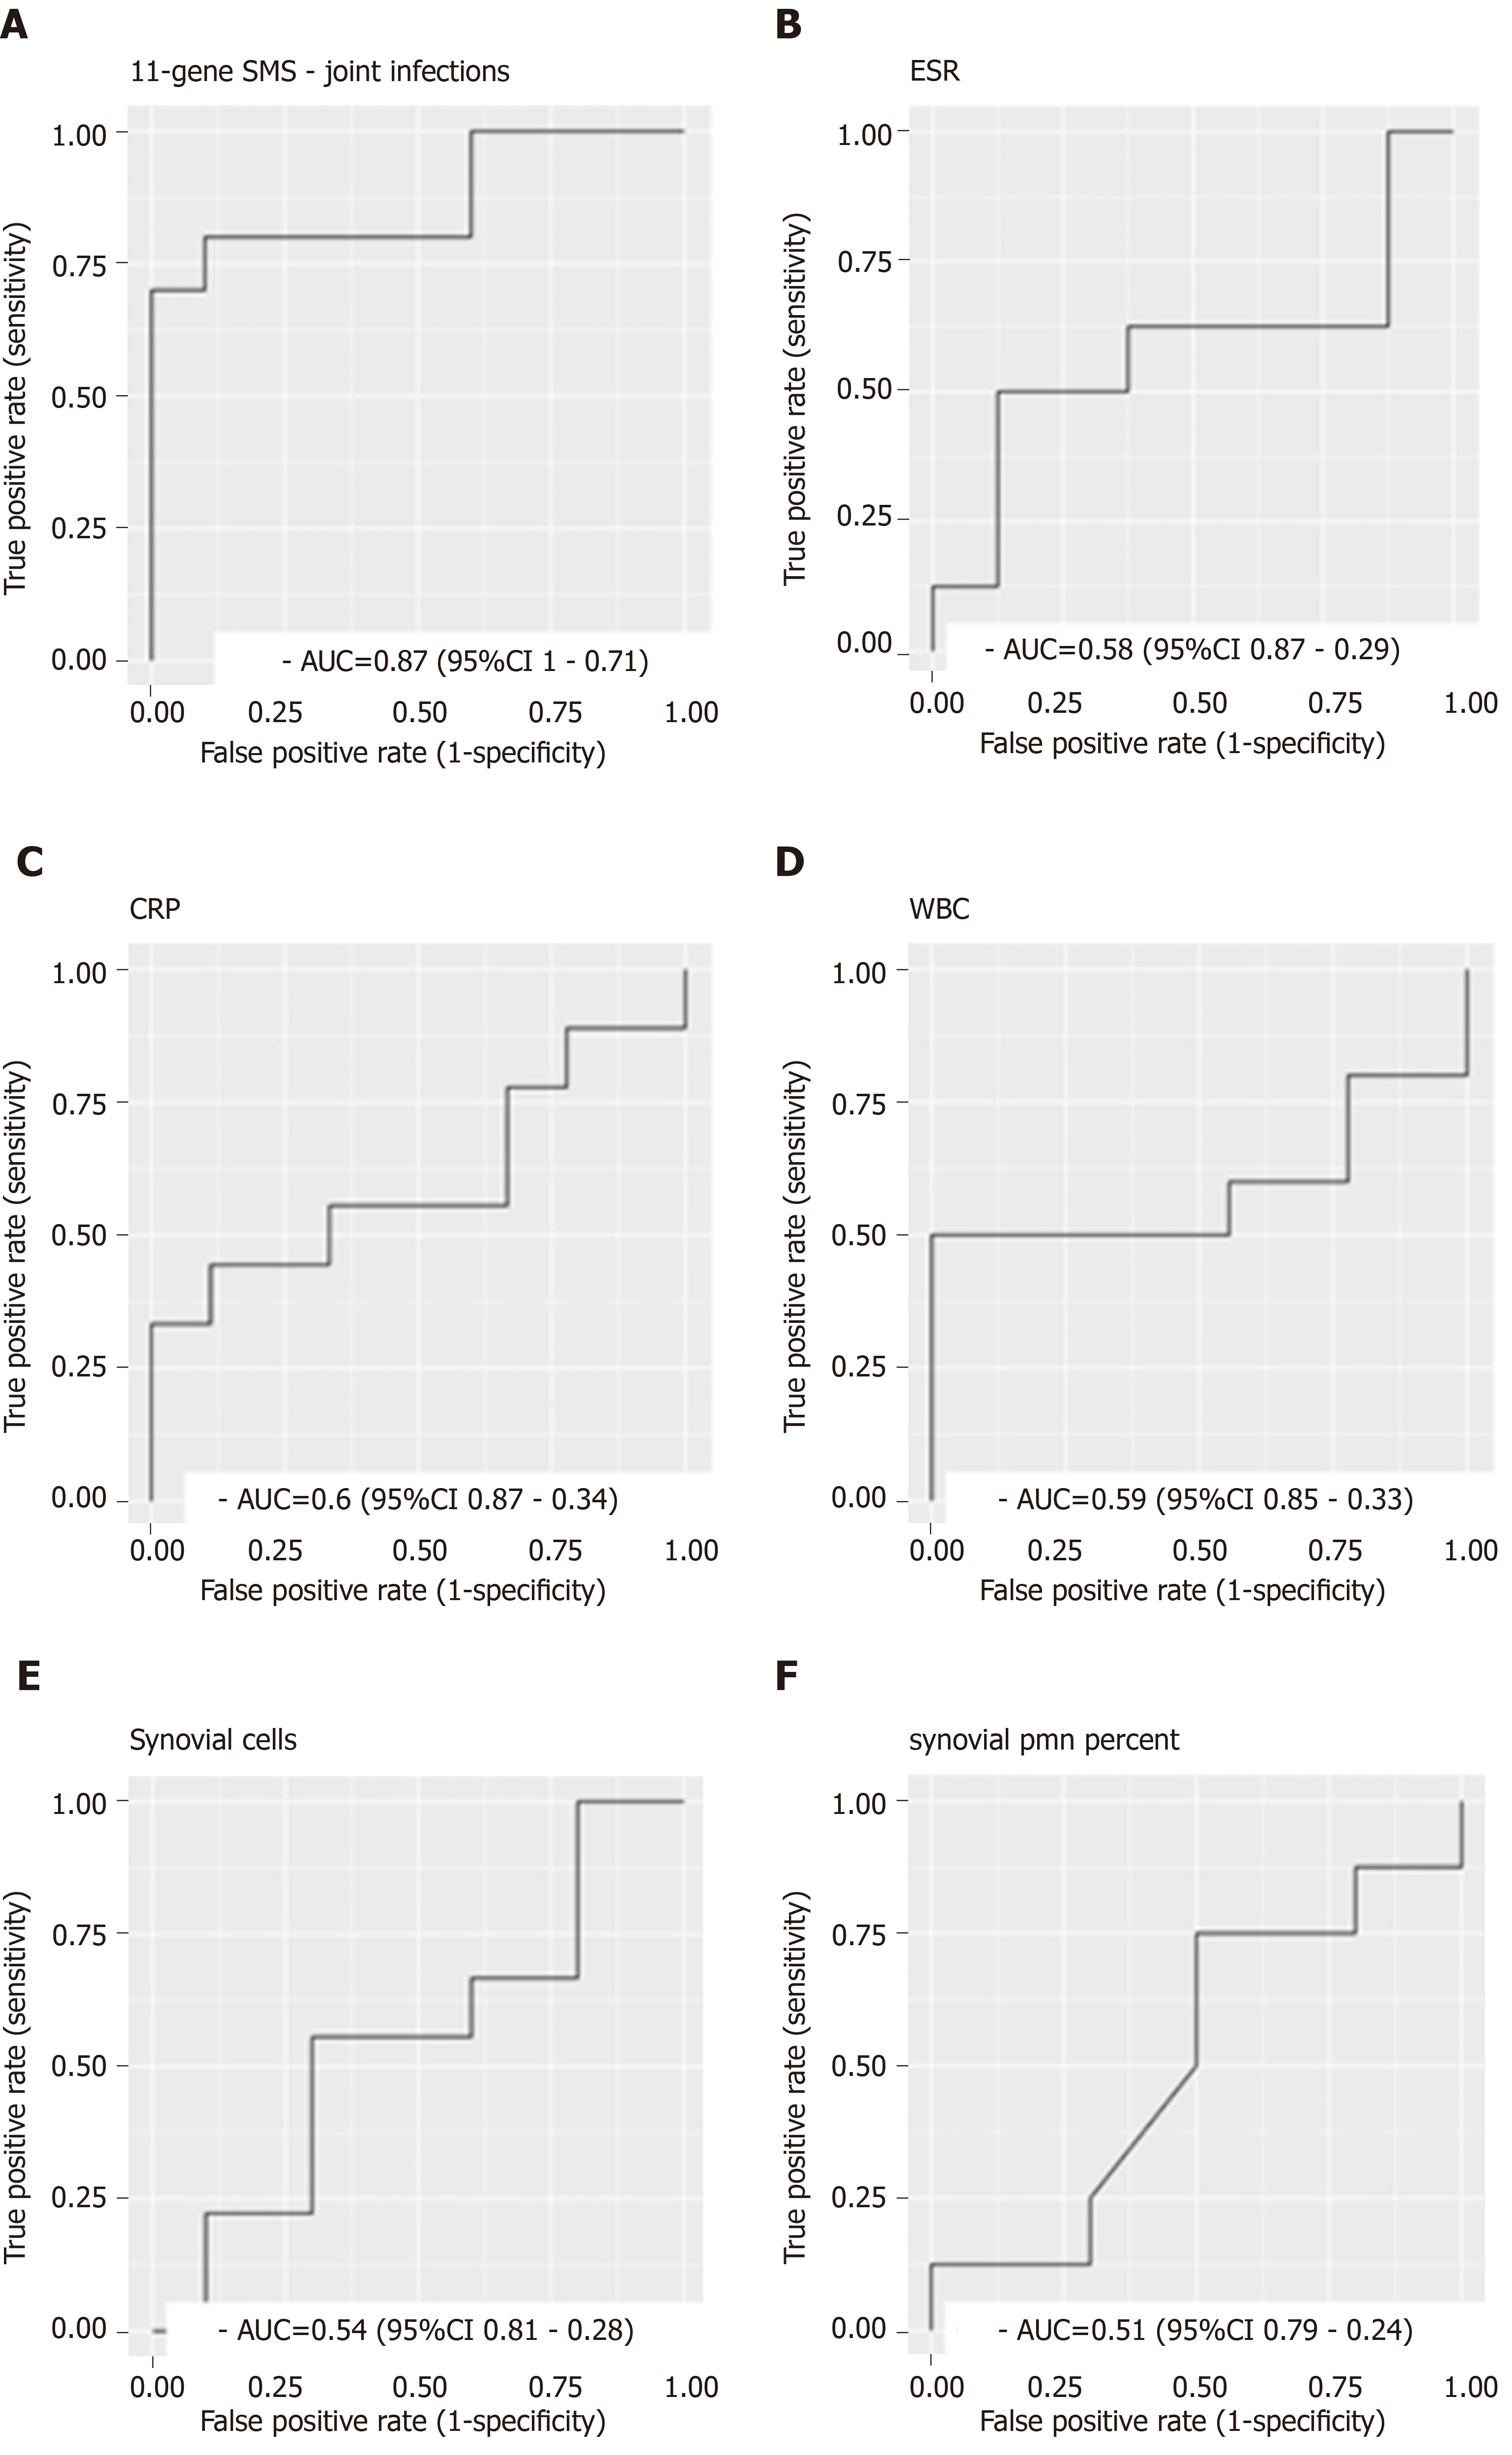
Figure 1 ROC curves for separating infectious from non-infectious joint infections.
A: Sepsis Metascore area under the ROC = 0.87; B: Erythrocyte sedimentation rate area under the ROC = 0.58; C: C-reactive protein area under the ROC = 0.6; D: White blood cell area under the ROC = 0.59; E. Synovial cell area under the ROC = 0.54; F: Synovial polymorphonuclear cells % area under the ROC = 0.51. WBC: White blood cell; ESR: Erythrocyte sedimentation rate; CRP: C-reactive protein; SMS: Sepsis MetaScore.
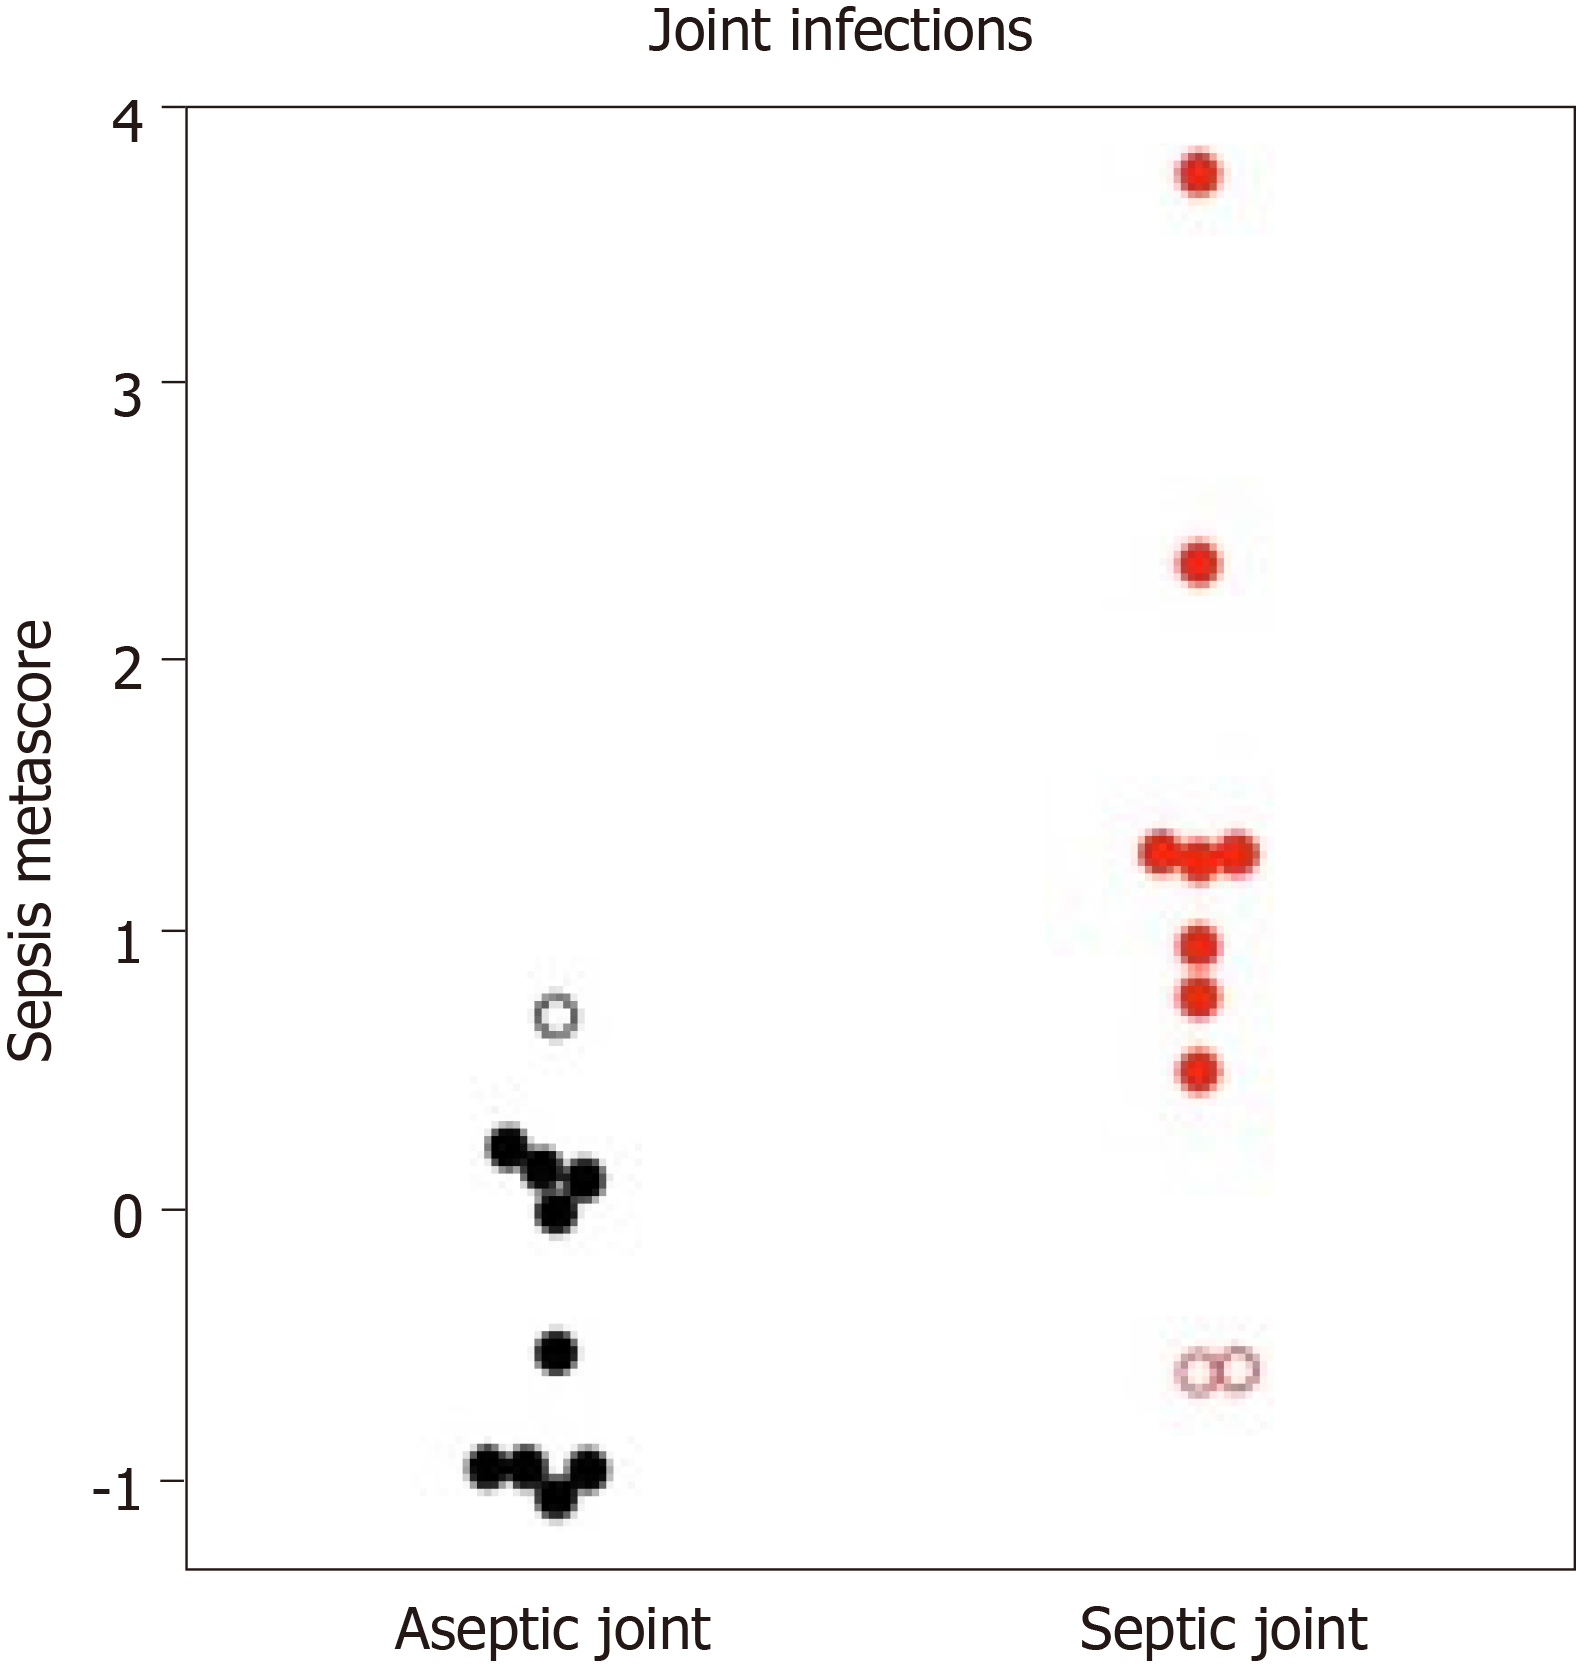
Figure 2 Scatter plot with Sepsis MetaScore on the Y-axis grouped by aseptic (black dots) and septic joints (red dots).
Note the open circle in the aseptic group is the patient who had a concurrent systemic bacterial infection with a negative joint aspiration. The two open circles in the septic group, were given antibiotics at least 12 h prior to Sepsis MetaScore blood draw.
- Citation: Schultz BJ, Sweeney T, DeBaun MR, Remmel M, Midic U, Khatri P, Gardner MJ. Pilot study of a novel serum mRNA gene panel for diagnosis of acute septic arthritis. World J Orthop 2019; 10(12): 424-433
- URL: https://www.wjgnet.com/2218-5836/full/v10/i12/424.htm
- DOI: https://dx.doi.org/10.5312/wjo.v10.i12.424


