
















Copyright: ©Author(s) 2026.
World J Clin Oncol. Nov 24, 2026; 17(11): 124935
Published online Nov 24, 2026. doi: 10.5306/wjco.124935
Published online Nov 24, 2026. doi: 10.5306/wjco.124935
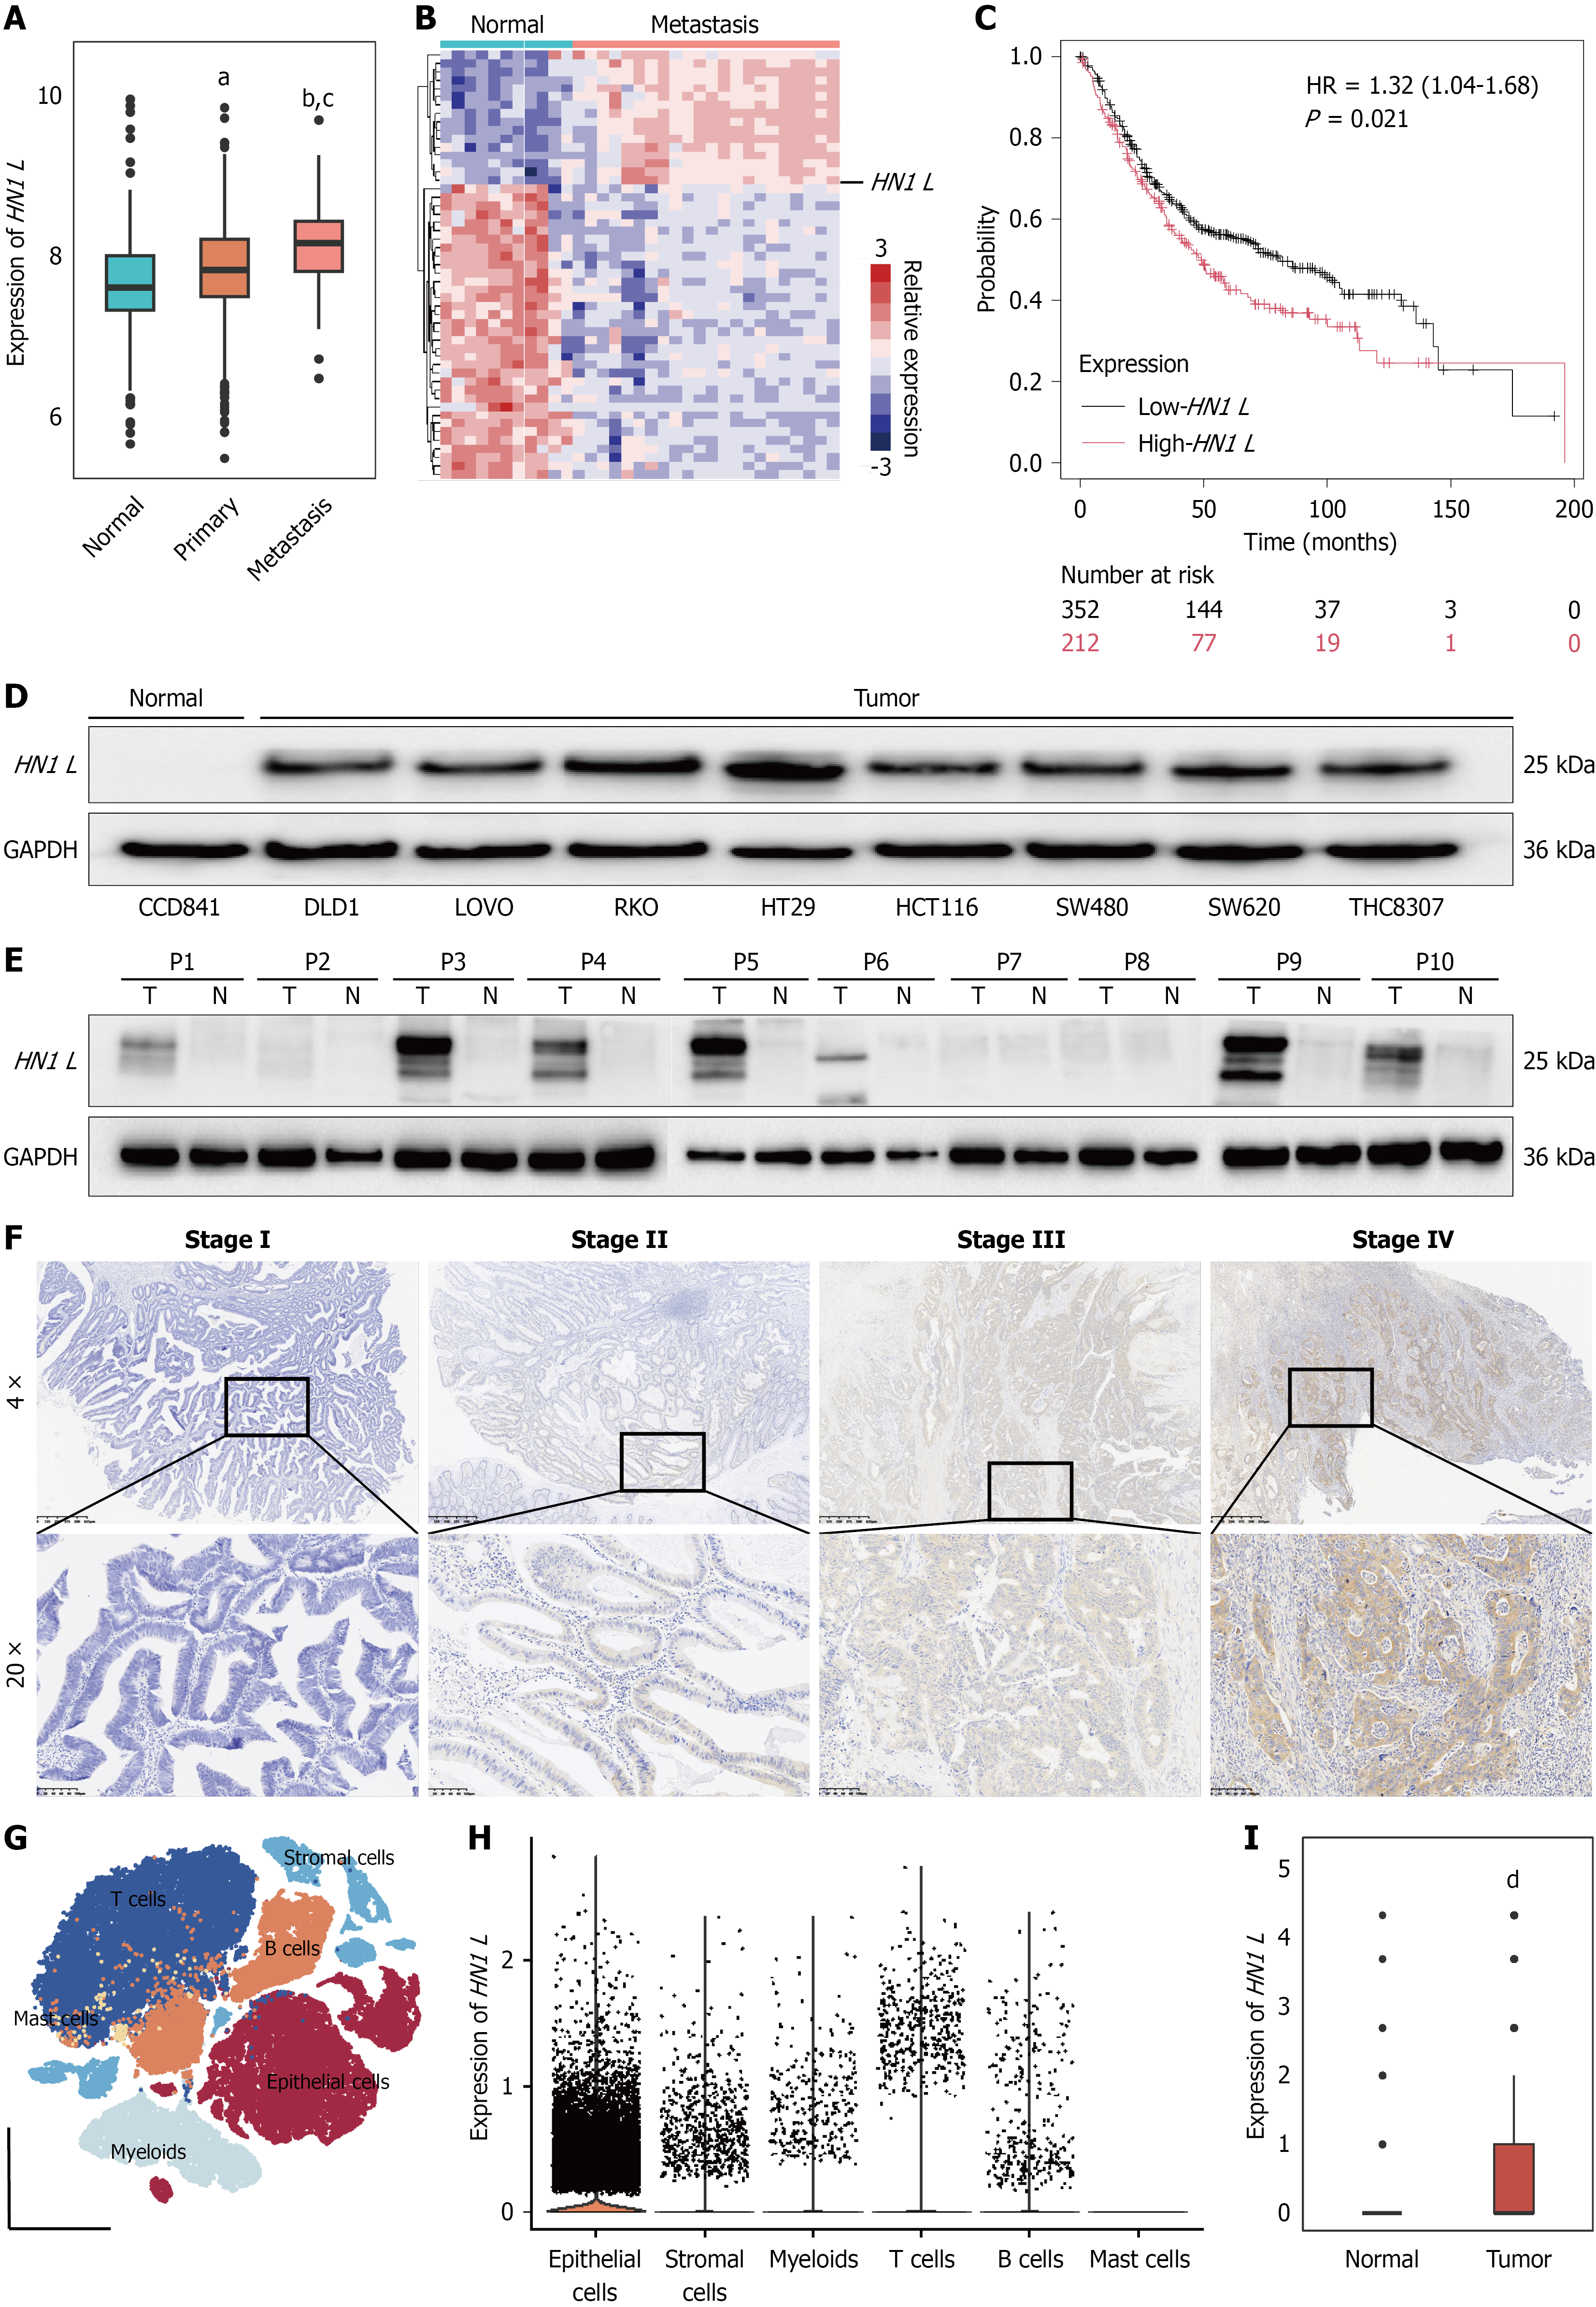
Figure 1 Increased expression of HN1 L in colorectal cancer.
A: HN1 L expression in normal colorectal tissues, primary colorectal cancer (CRC) tissues, and metastatic tumors from The Cancer Genome Atlas-CRC dataset; B: Heatmap showing HN1 L and representative differentially expressed genes in normal tissues and metastatic CRC tissues; C: Kaplan-Meier analysis of overall survival according to HN1 L expression in CRC; D: Western blot analysis of basal HN1 L expression in the normal colonic epithelial cell line CCD841 and eight CRC cell lines; E: Western blot analysis of HN1 L expression in an independent set of 10 paired frozen CRC and adjacent normal tissues; F: Representative immunohistochemical staining of HN1 L in CRC specimens from patients with different tumor stages; G: T-SNE visualization of the major cell populations identified in the GSE132465 scRNA-seq dataset; H and I: Distribution of HN1 L expression across major cell populations and tissues. ᵃP < 0.05, ᵇP < 0.01 vs normal tissues; ᶜP < 0.05 vs primary colorectal cancer tissues; dP < 0.01 vs normal tissues. HR: Hazard ratio.
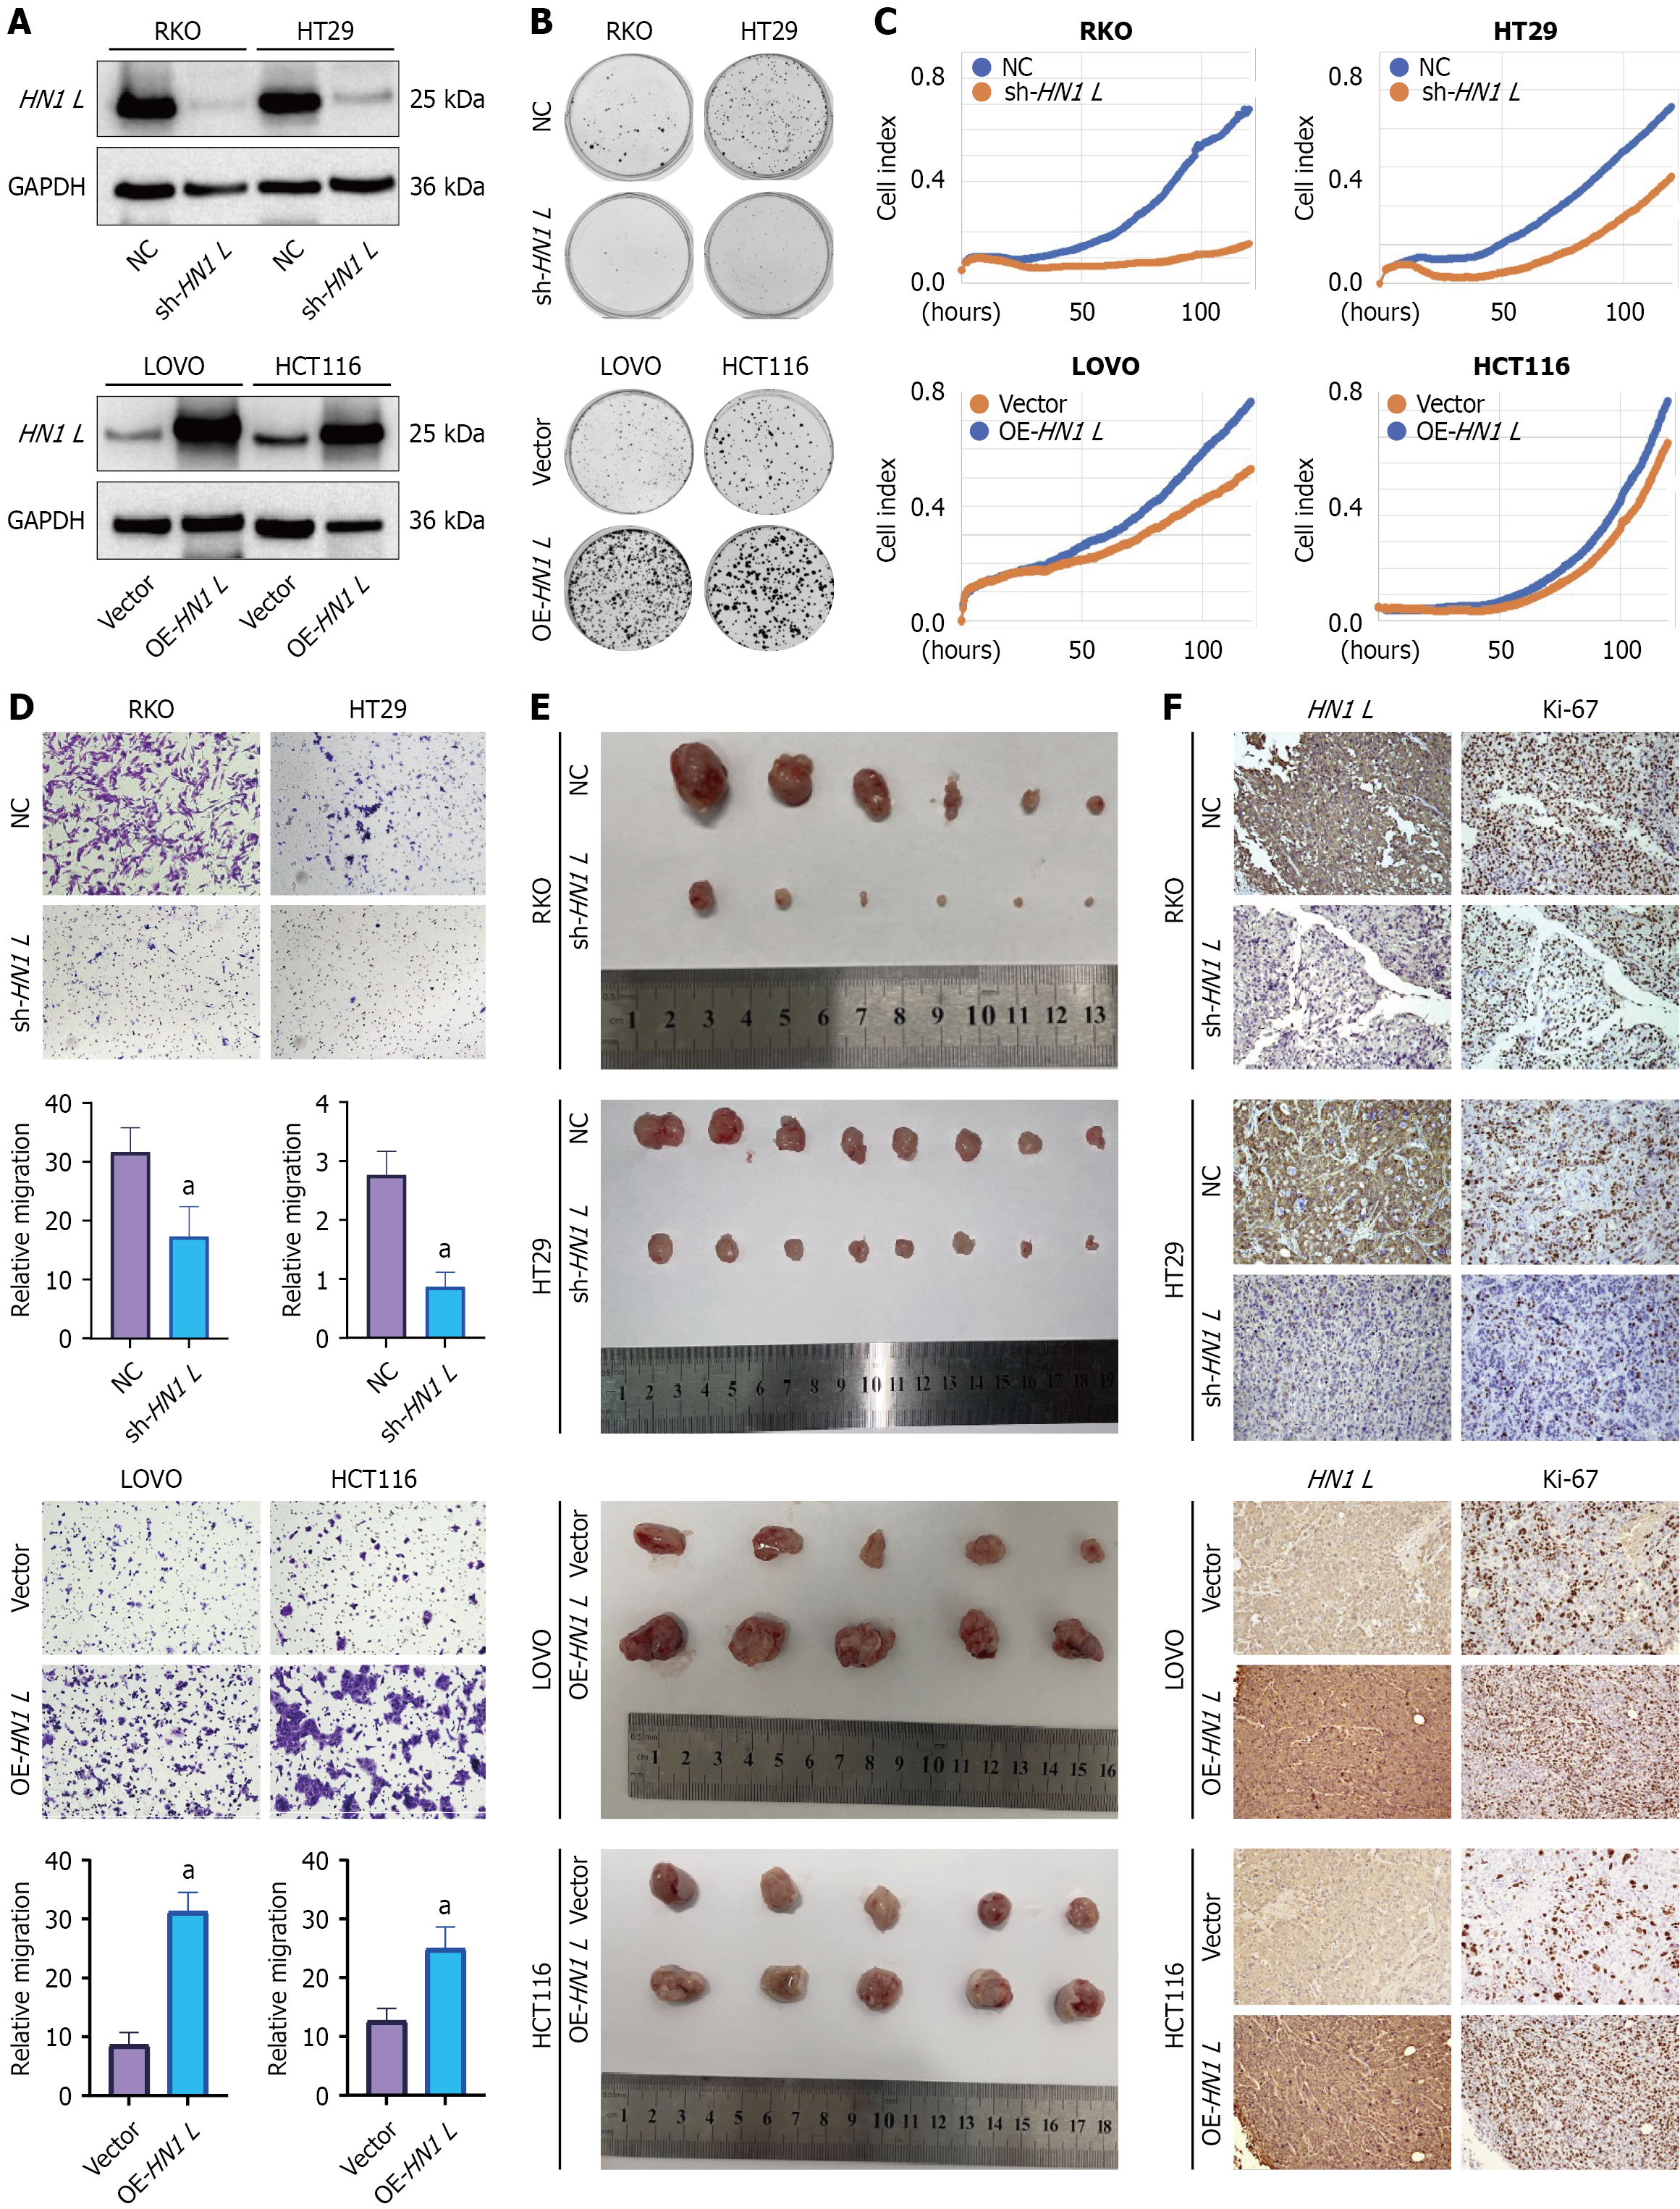
Figure 2 HN1 L promotes colorectal cancer tumorigenic potential in vitro and in vivo.
A: Western blot confirming HN1 L overexpression and sh-HN1 L#2-mediated knockdown in colorectal cancer (CRC) cells; B: Representative images and quantification of colony formation assays in HN1 L-modified CRC cells; C: Real-time proliferation curves measured using the IncuCyte system. The cell index represents the proportion of the image area occupied by cells; D: Representative images and quantification of Transwell migration assays; E: Representative endpoint images of subcutaneous xenograft tumors generated from CRC cells with HN1 L overexpression or knockdown; F: Representative immunohistochemical staining of HN1 L and Ki-67 in xenograft tissues. Quantitative data are presented as mean ± SD from at least three independent experiments. aP < 0.01 vs the corresponding control. OE: Overexpression; NC: Negative control.
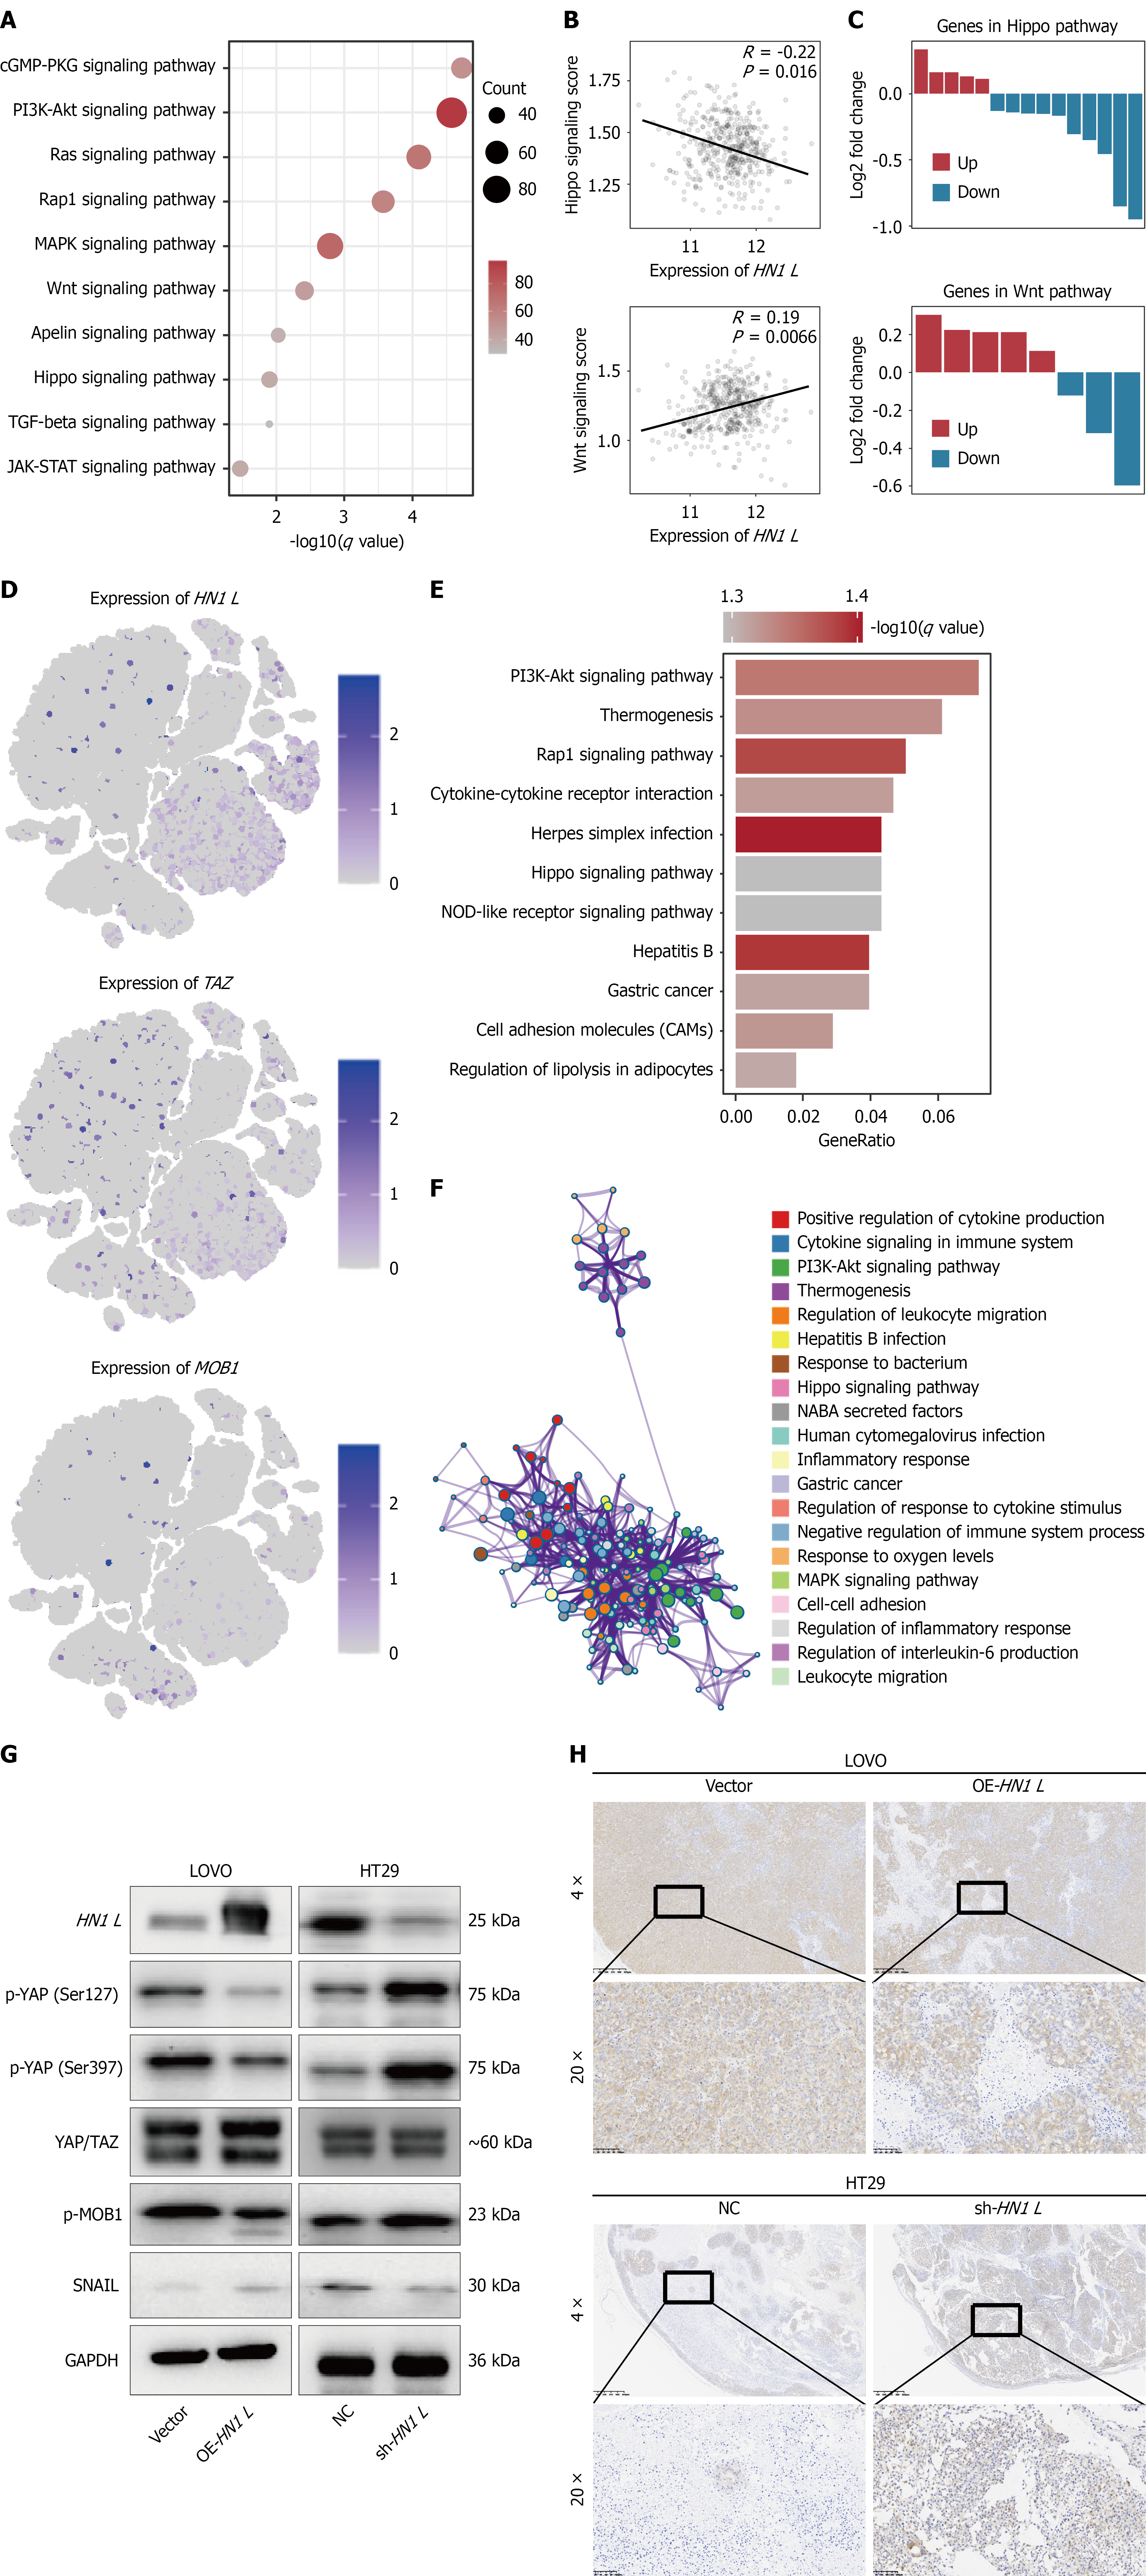
Figure 3 HN1 L promotes colorectal cancer tumorigenesis by inhibiting the Hippo pathway.
A: Enrichment analysis of differentially expressed genes between the HN1 L-high and HN1 L-low groups in The Cancer Genome Atlas-colorectal cancer (CRC) cohort; B: Association between HN1 L expression and ssGSEA scores for the WNT and Hippo signaling pathways; C: Differential expression of genes involved in the WNT and Hippo signaling pathways. Red indicates upregulated genes, whereas blue indicates downregulated genes; D: Single-cell expression patterns of HN1 L, TAZ, and MOB1 in the GSE132465 dataset; E: Pathway enrichment analysis of differentially expressed genes in HN1 L-overexpressing CRC cells and corresponding controls; F: Protein-protein interaction network of differentially expressed genes associated with HN1 L overexpression; G: Western blot analysis of HN1 L and Hippo pathway-related proteins, including p-MOB1, total YAP, p-YAP at Ser127 and Ser397, and SNAIL, in HN1 L-modified CRC cells; H: Representative immunohistochemical staining of HN1 L and p-YAP in xenograft tissues. OE: Overexpression; NC: Negative control.
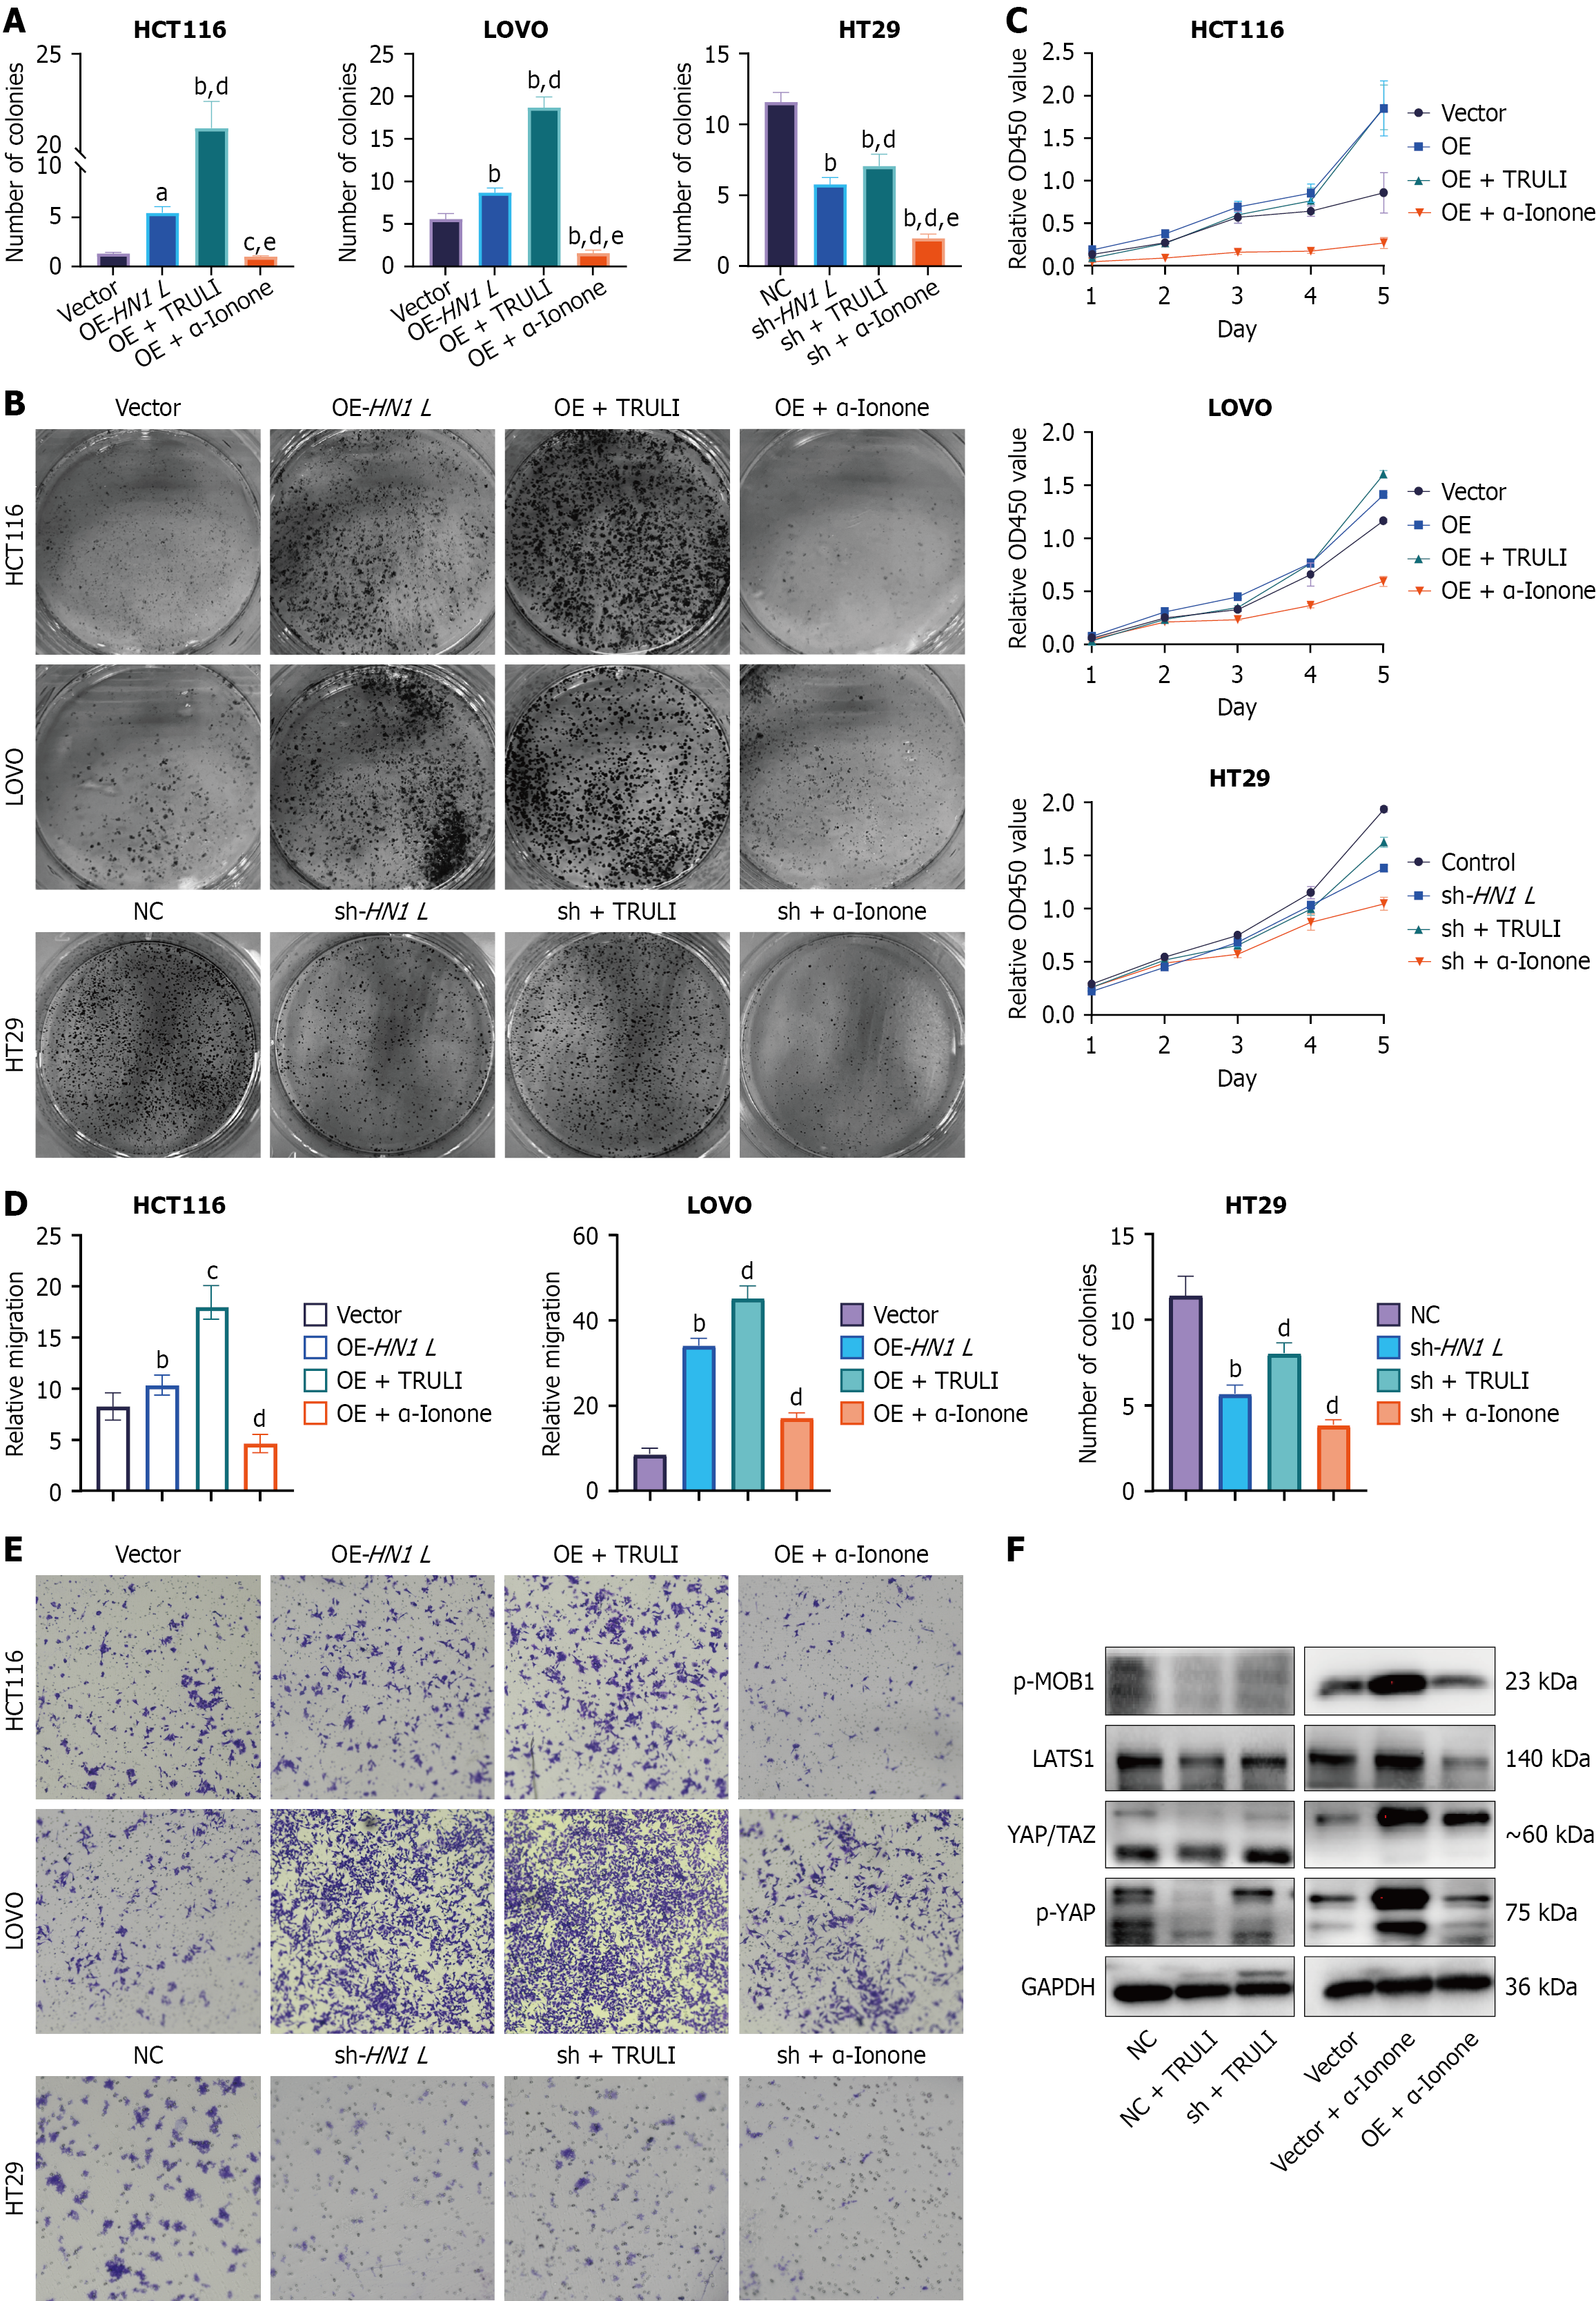
Figure 4 HN1 L is a potential target for modulating the Hippo pathway.
A and B: Quantification (A) and representative images (B) of colony formation assays in HN1 L-modified colorectal cancer (CRC) cells treated with the Hippo pathway activator α-Ionone or the LATS kinase inhibitor TRULI; C: CCK-8 proliferation curves under the indicated HN1 L-modulation and pharmacological-treatment conditions; D and E: Quantification (D) and representative images (E) of Transwell migration assays under the indicated conditions; F: Western blot analysis of p-MOB1, LATS1, YAP/TAZ, and p-YAP in HN1 L-modified CRC cells following treatment with α-Ionone or TRULI. Quantitative data are presented as mean ± SD from at least three independent experiments. ᵃP < 0.05, ᵇP < 0.01 vs the corresponding control (Vector or NC); ᶜP < 0.05, ᵈP < 0.01 vs the corresponding HN1L-modified group (OE-HN1L or sh-HN1L); eP < 0.01 vs the corresponding TRULI-treated group. OE: Overexpression; NC: Negative control.
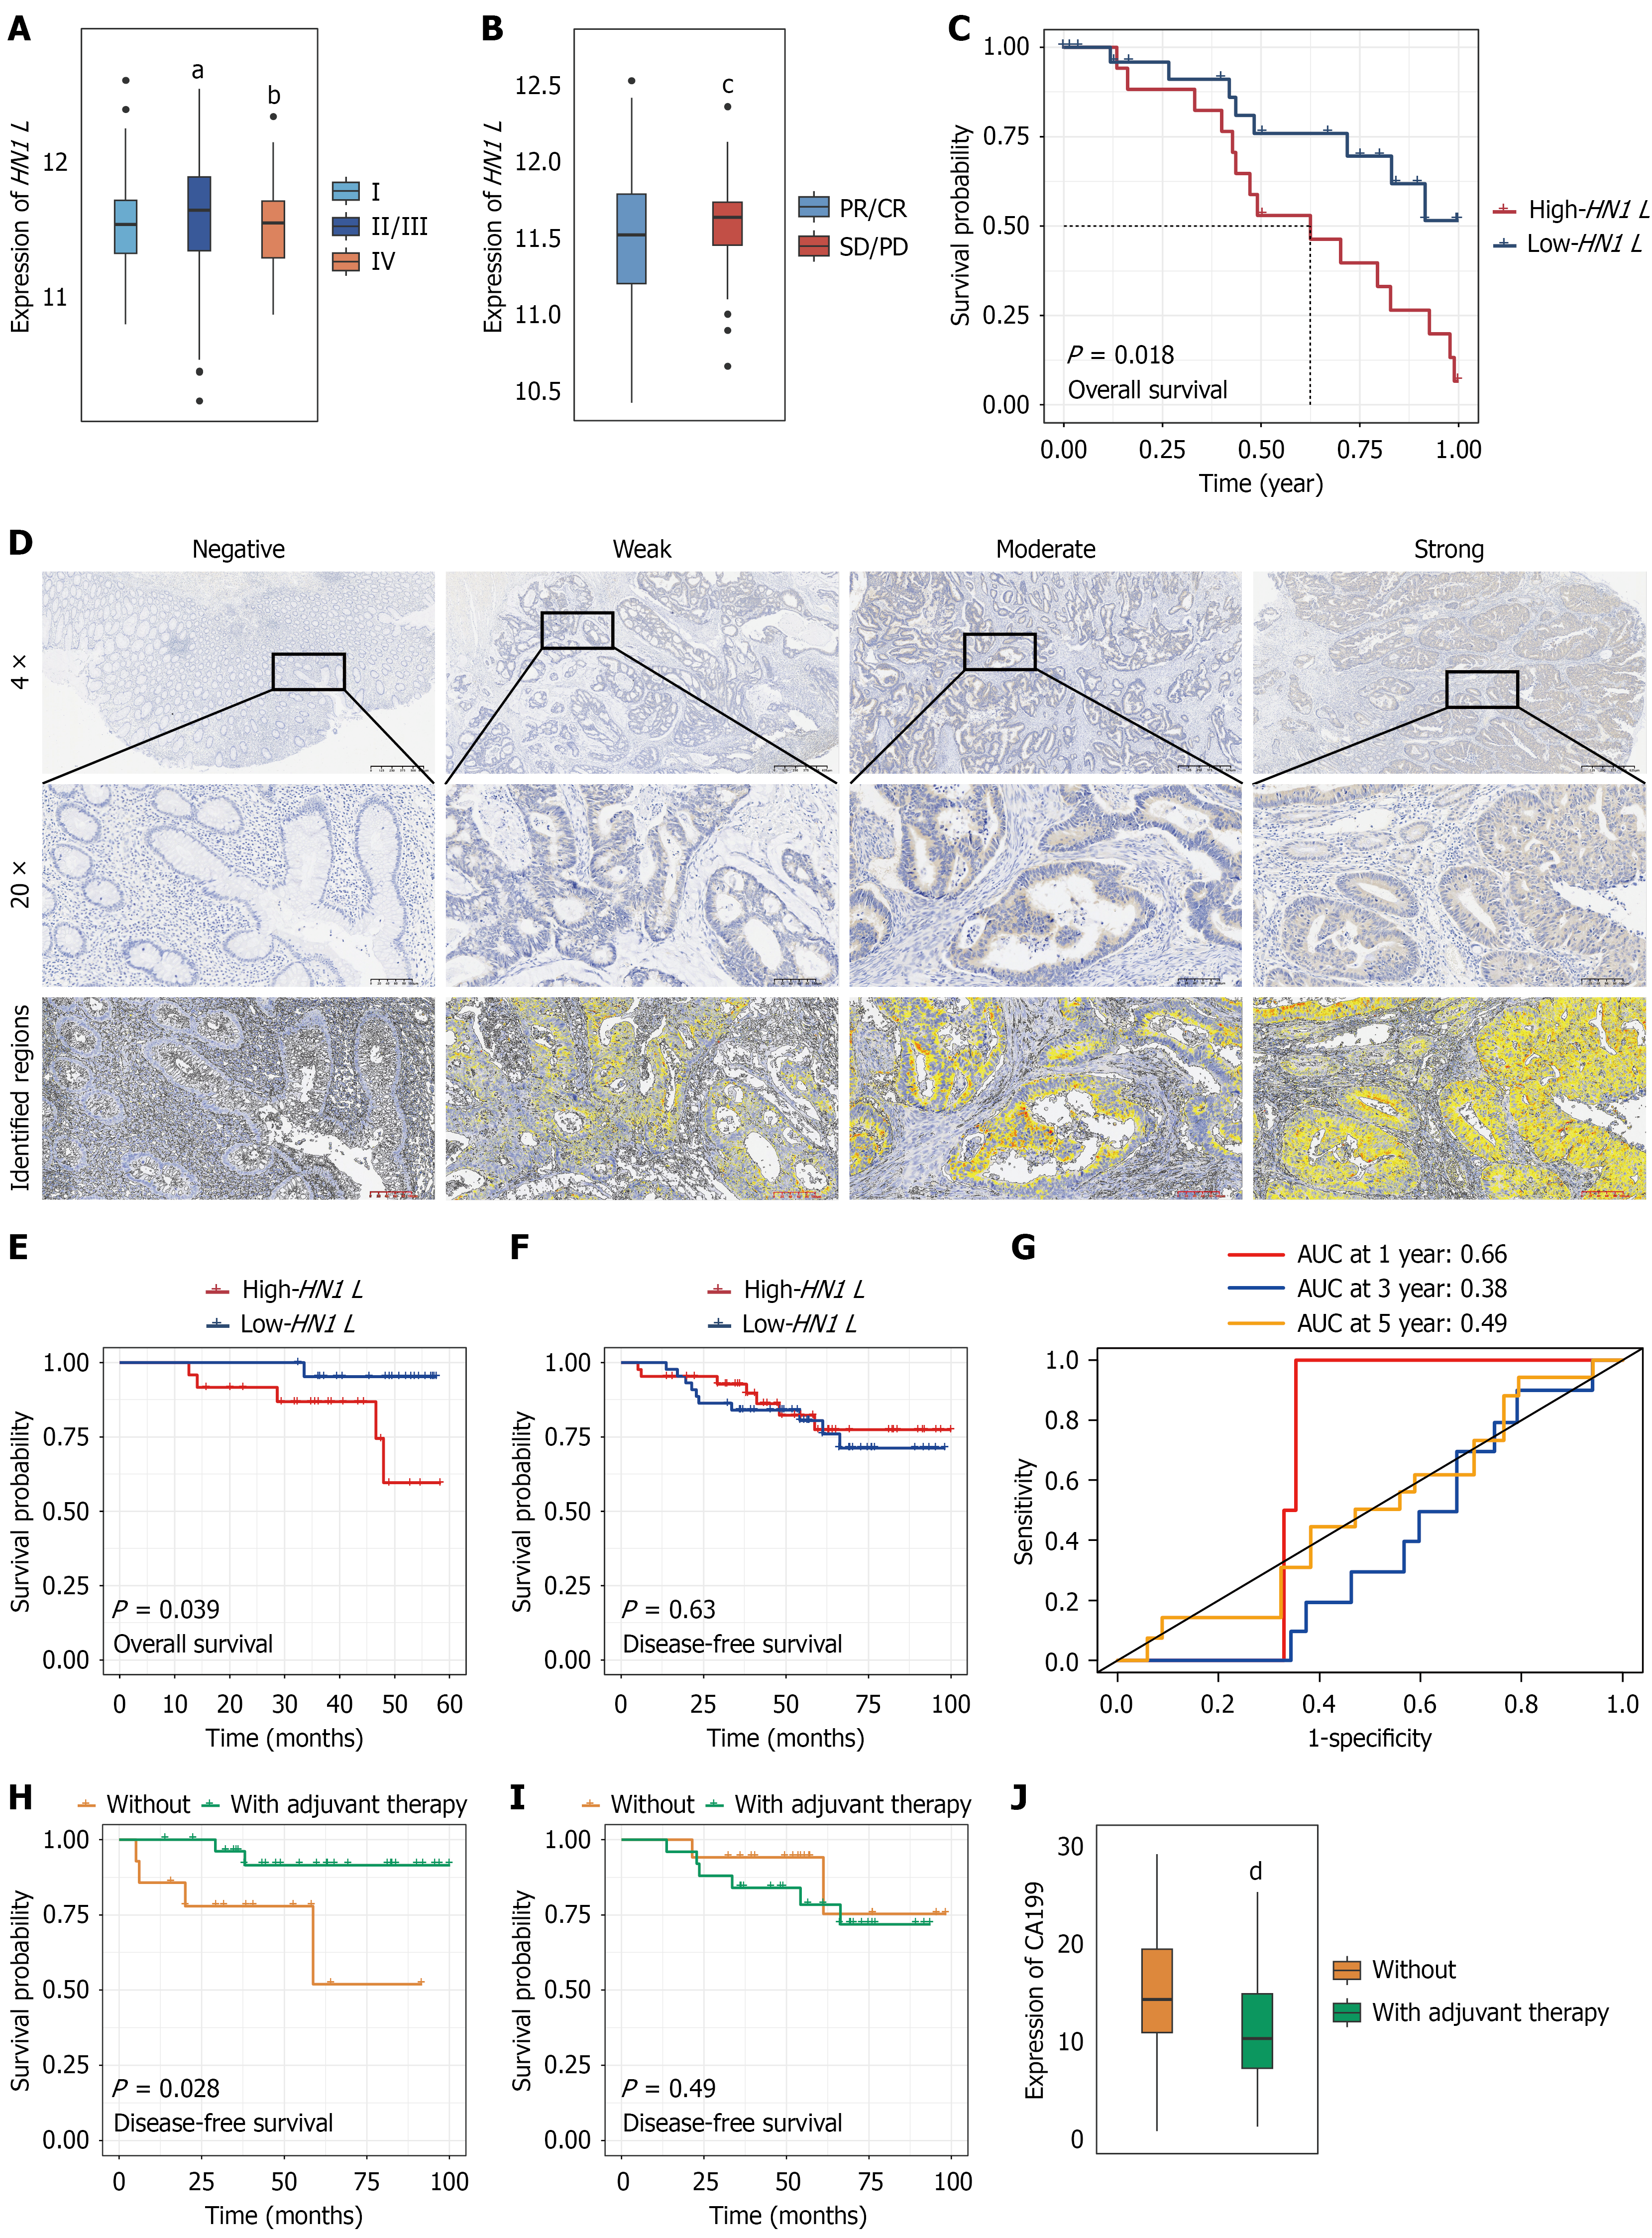
Figure 5 Association between HN1 L expression and adjuvant chemotherapy in colorectal cancer.
A and B: HN1 L expression according to tumor stage (A) and disease status (B) in The Cancer Genome Atlas (TCGA)-colorectal cancer (CRC)cohort; C: Kaplan-Meier analysis of overall survival (OS) according to HN1 L expression in the TCGA-CRC cohort; D: Representative HN1 L immunohistochemical staining categorized as negative, weak, moderate, or strong. HN1 L expression was quantified using HALO software, and patients were divided into HN1 L-high and HN1 L-low groups according to the median H-score; E-F: Kaplan-Meier analyses of OS (E) and disease-free survival (DFS) (F) in the SYSUCC cohort according to HN1 L expression; G: Time-dependent receiver operating characteristic curves evaluating the discriminatory performance of HN1 L expression for DFS at 1, 3, and 5 years; H-I: DFS according to receipt of postoperative adjuvant chemotherapy in patients with high (H) or low (I) HN1 L expression; J: Comparison of serum carbohydrate antigen 19-9 levels between patients who received postoperative adjuvant chemotherapy and those who did not. ᵃP < 0.05 vs stage I; bP < 0.05 vs stage II/III; cP < 0.05 vs partial response/complete response; dP < 0.01 vs patients without adjuvant therapy. AUC: Area under the curve; CA19-9: Carbohydrate antigen 19-9; PR: Partial response; CR: Complete response; SD: Stable disease; PD: Progressive disease.
- Citation: Kang D, Zeng LX, Zhang RX, Ma WJ, Yang R, Wang X. HN1 L promotes colorectal cancer proliferation and migration by inhibiting the Hippo pathway. World J Clin Oncol 2026; 17(11): 124935
- URL: https://www.wjgnet.com/2218-4333/full/v17/i11/124935.htm
- DOI: https://dx.doi.org/10.5306/wjco.124935