Copyright
©The Author(s) 2020.
World J Gastrointest Pharmacol Ther. Nov 8, 2020; 11(5): 93-109
Published online Nov 8, 2020. doi: 10.4292/wjgpt.v11.i5.93
Published online Nov 8, 2020. doi: 10.4292/wjgpt.v11.i5.93
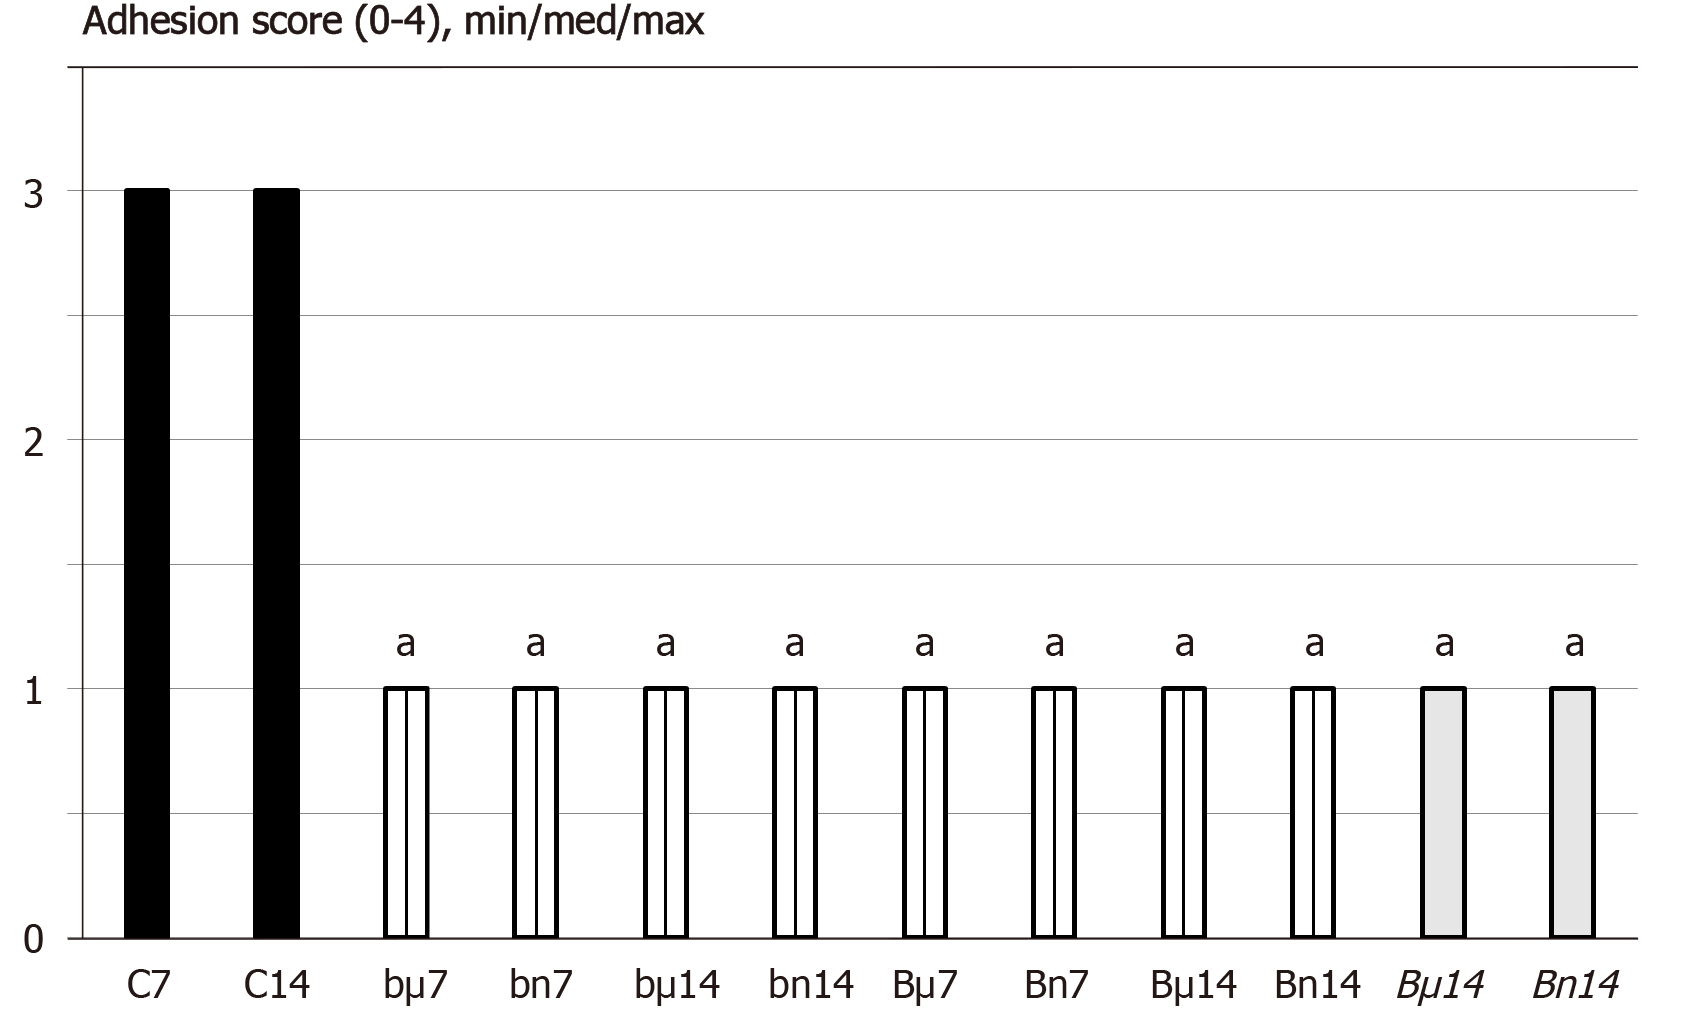
Figure 1 At 7 d (7) or 14 d (14) post-injury, we assessed the adhesion score (0-4), min/med/max.
Medication (/kg), was BPC 157 [10 µg (µ) or 10 ng (n)] (b - 1 mL bath/rat at abdominal cavity, B – once daily intraperitoneally, first application at 30 min following surgery, last 24 h before sacrifice; B once daily intraperitoneally, first application at day 7 following surgery, last 24 h before sacrifice) or saline(controls)(C) (bath equal volume, or once daily intraperitoneally (since not different results are shown together). aP < 0.05 at least vs control.
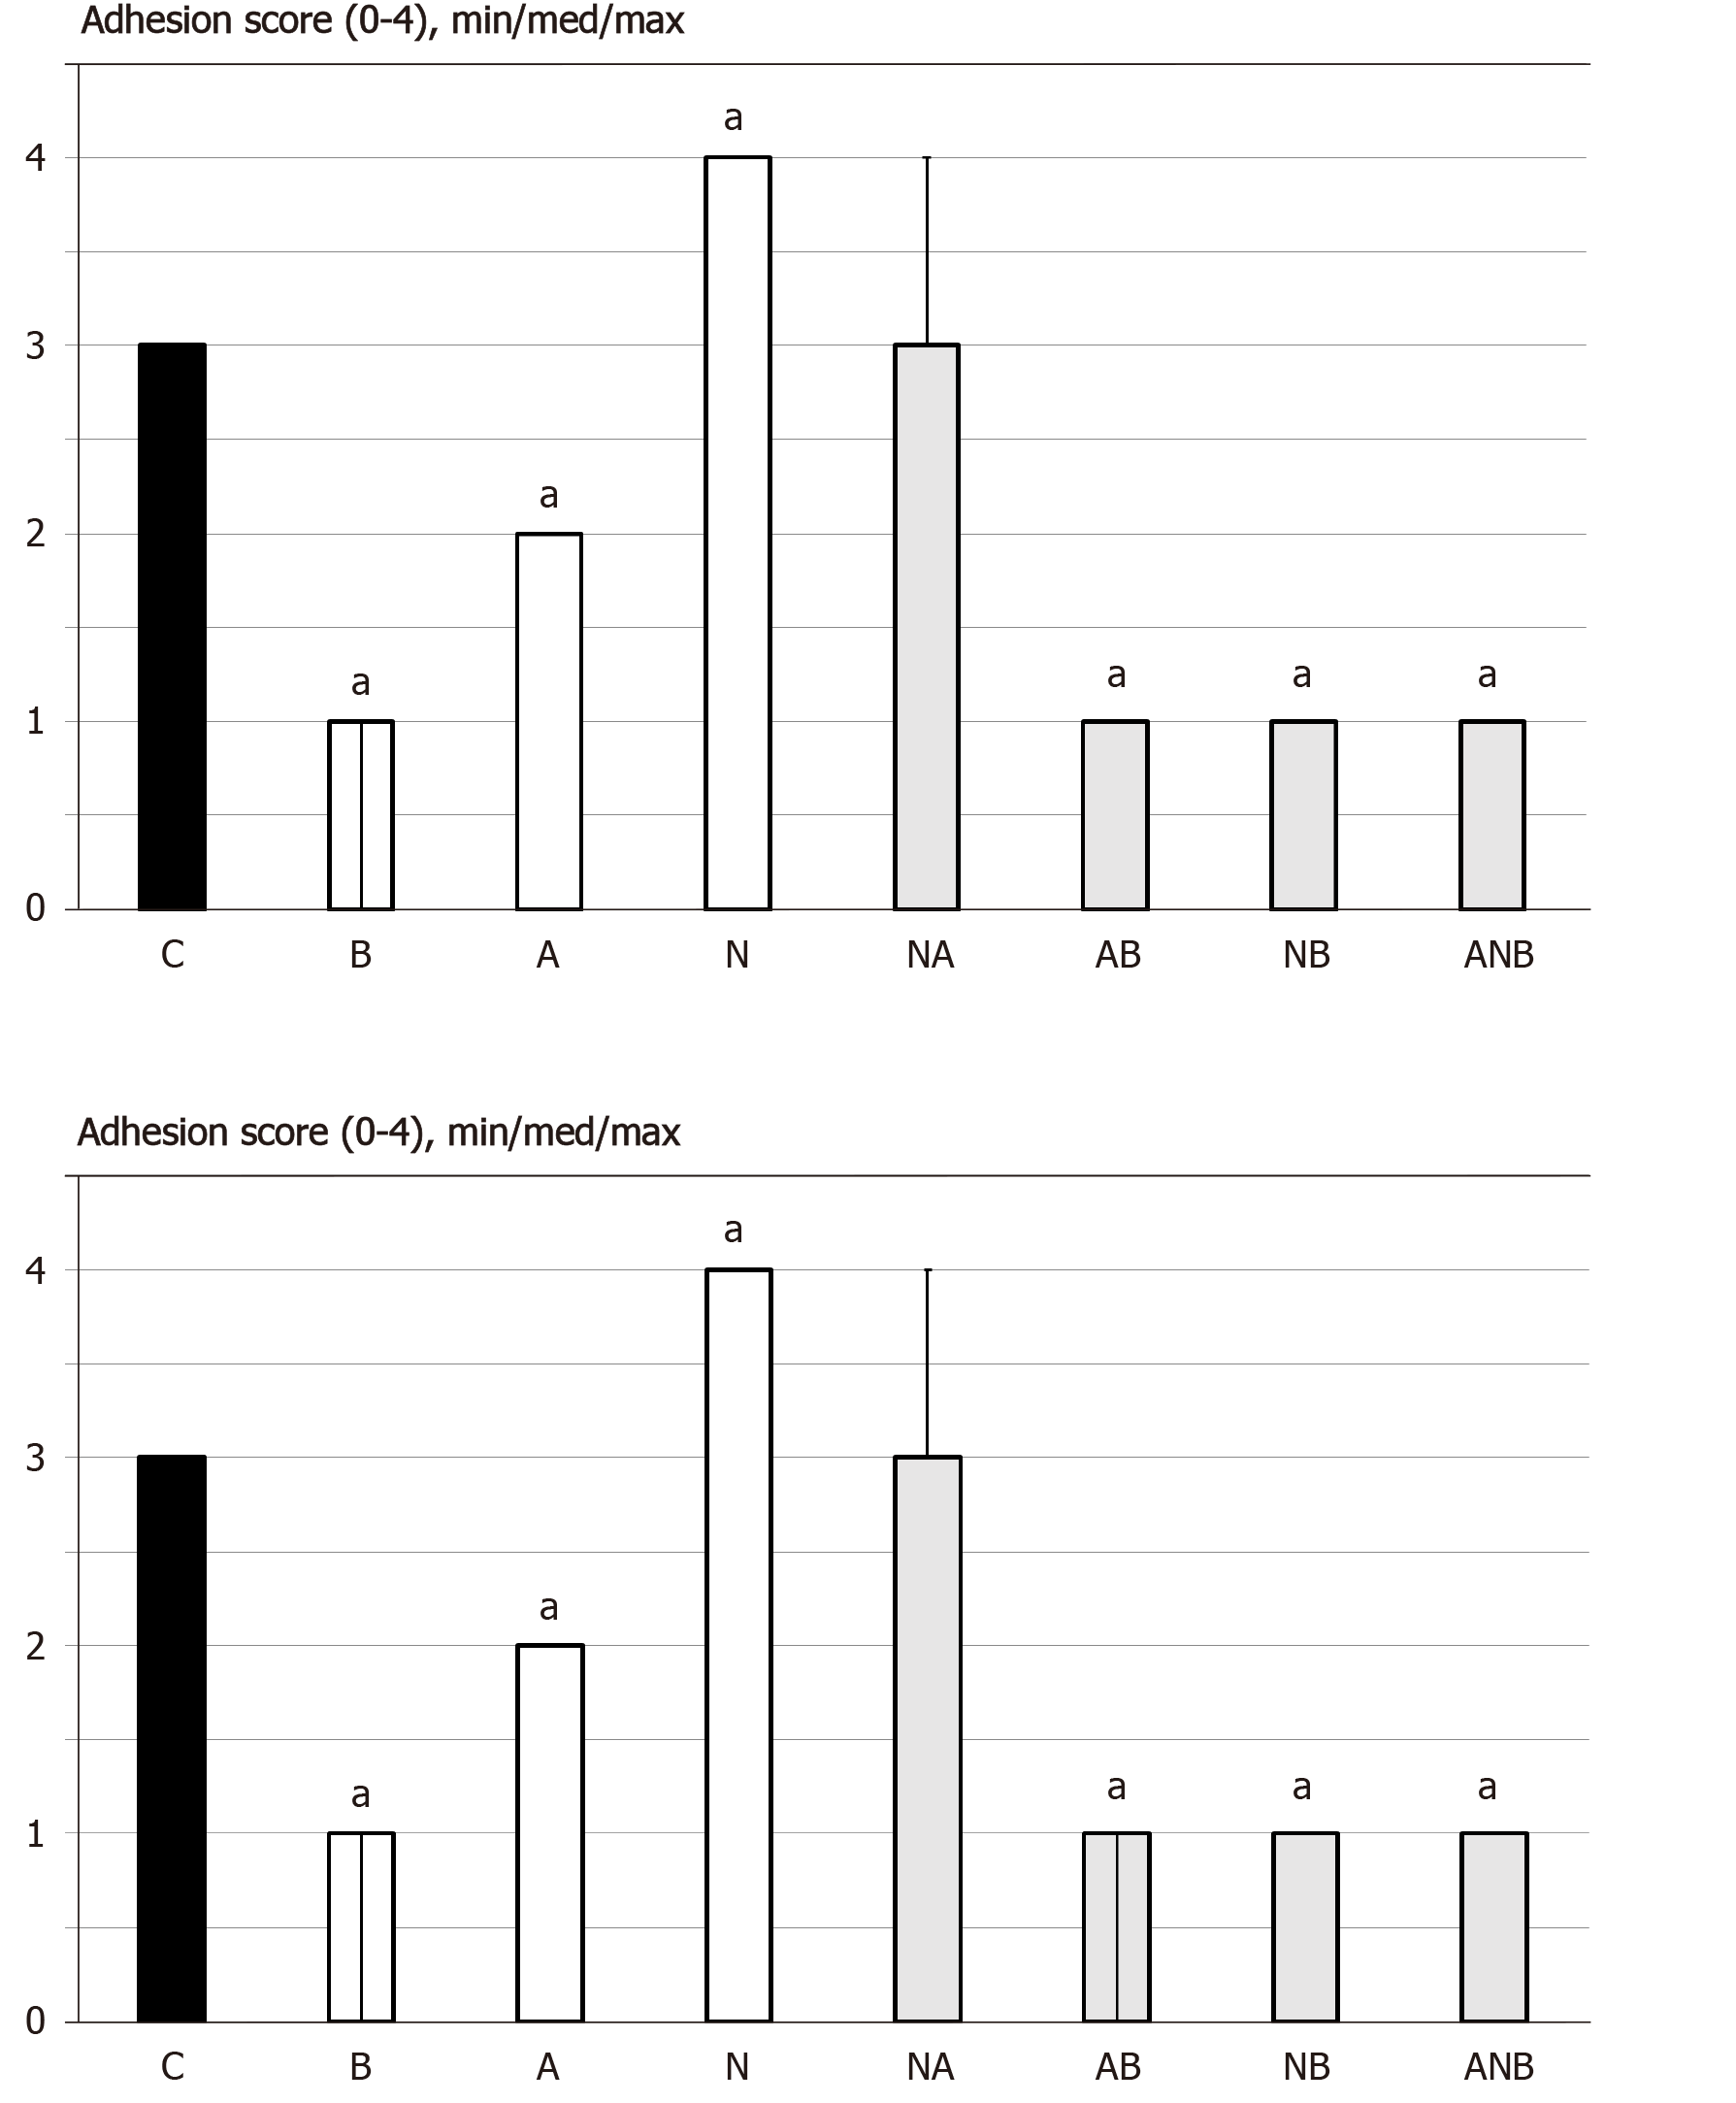
Figure 2 At 7 d or 14 d post-injury, we assessed the adhesion score (0-4), min/med/max.
Medication (/kg, 1 mL bath/rat) at abdominal cavity was BPC 157 (10 µg) (B), L-arginine (A) (100 mg), L-NAME (5 mg) alone or in combinations (L-NAME + L-arginine (NA), L-arginine + BPC 157 (AB), L-NAME + BPC 157 (NB), L-arginine + L-NAME + BPC 157 (ANB) or saline bath equal volume (controls) (C). aP < 0.05 at least vs control; BPC 10 ng presented adhesion score 1/1/1 with L-arginine (L-arginine + BPC 157); Score 1/1/1 with L-NAME (L-NAME + BPC 157); Score 1/1/1 with L-arginine and L-NAME (L-arginine + L-NAME + BPC 157), aP < 0.05 at least vs control.
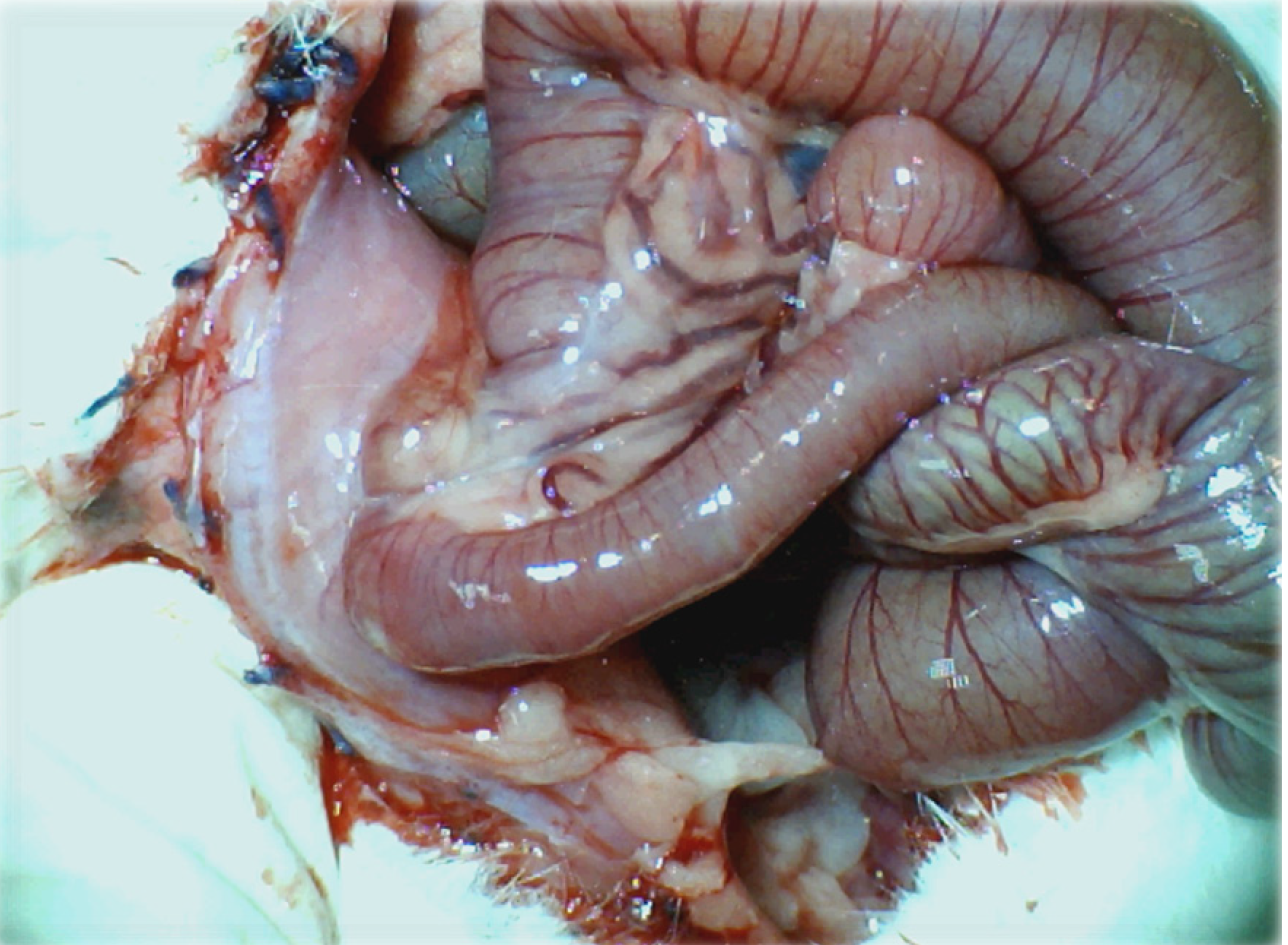
Figure 3 Adhesion formation (Control rats).
Illustrative presentation of adhesion formation leading to subileus presentation at day 14 post injury.
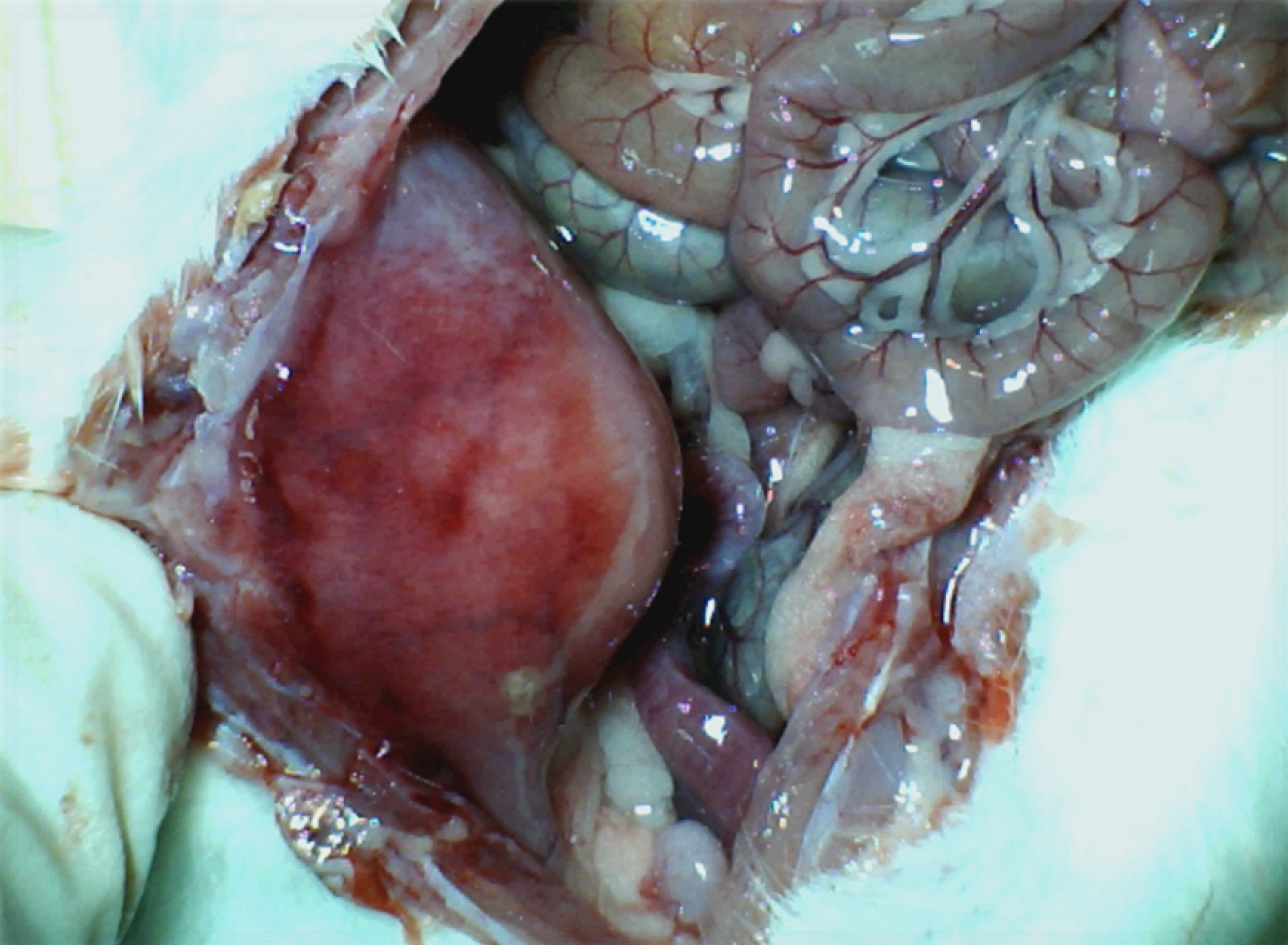
Figure 4 Adhesion formation.
BPC 157 rats. Illustrative presentation of the abdominal wall healing without adhesion formation at d 14 post injury.
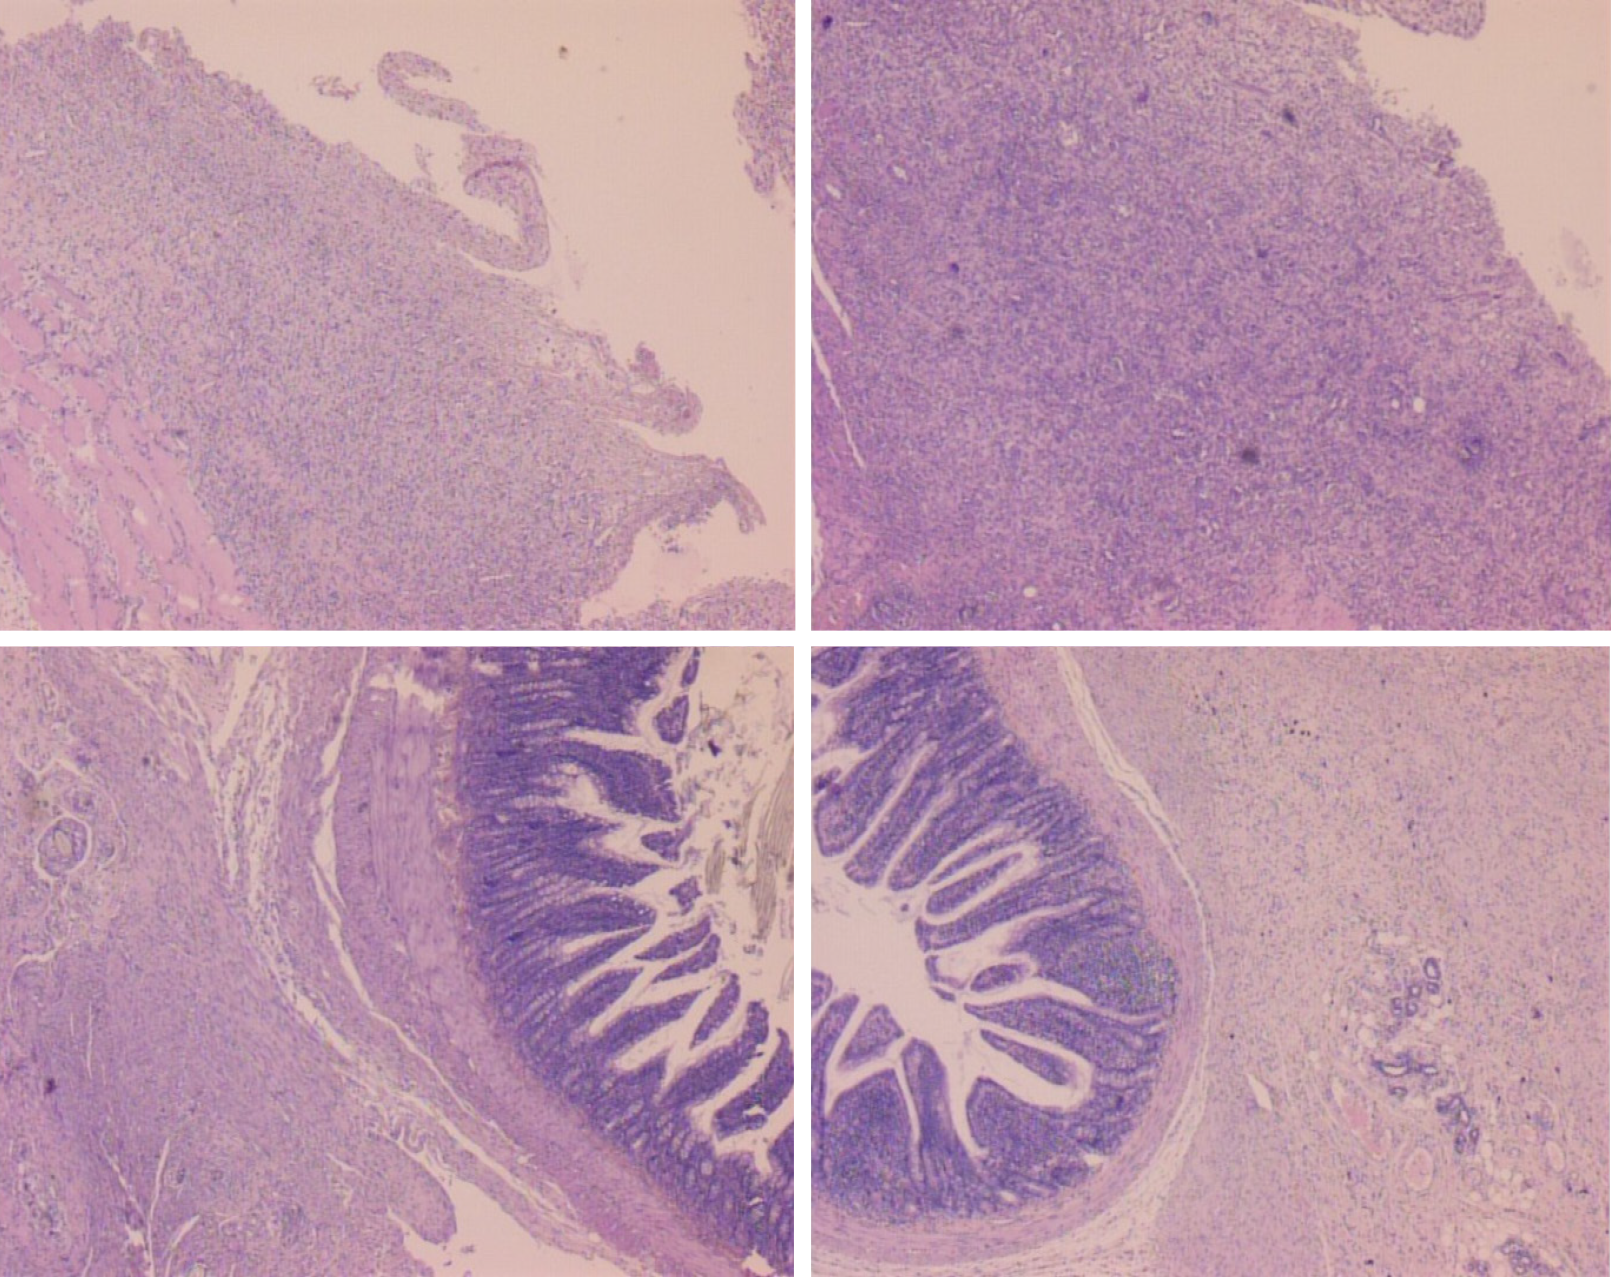
Figure 5 Histological assessment after 7 d (upper) and 14 d (low), in rats subjected to the excision of the parietal peritoneum with underlying superficial layer of muscle tissue, controls [upper left (7 d), low left (14 )] and BPC 157-treated rats [upper right (7 d), low right (14 d)].
7 d. Upper, left, controls. Edematous, relatively poorly formed granulation tissue, covering large areas of serosa. Upper, right, BPC 157. By far smaller areas covered with more dense and mature granulation tissue with vessels appearing more mature and better formed. 14 d. Low, left, controls. After two weeks large areas of still poorly organized granulation tissue invading the bowel and abdominal wall. Low, right, BPC 157. Young connective tissue scar is formed in smaller areas, with poor invasion into the bowel serosa/subserosa leading to very limited and non-strangulating adhesions. HE stain, objective × 10.
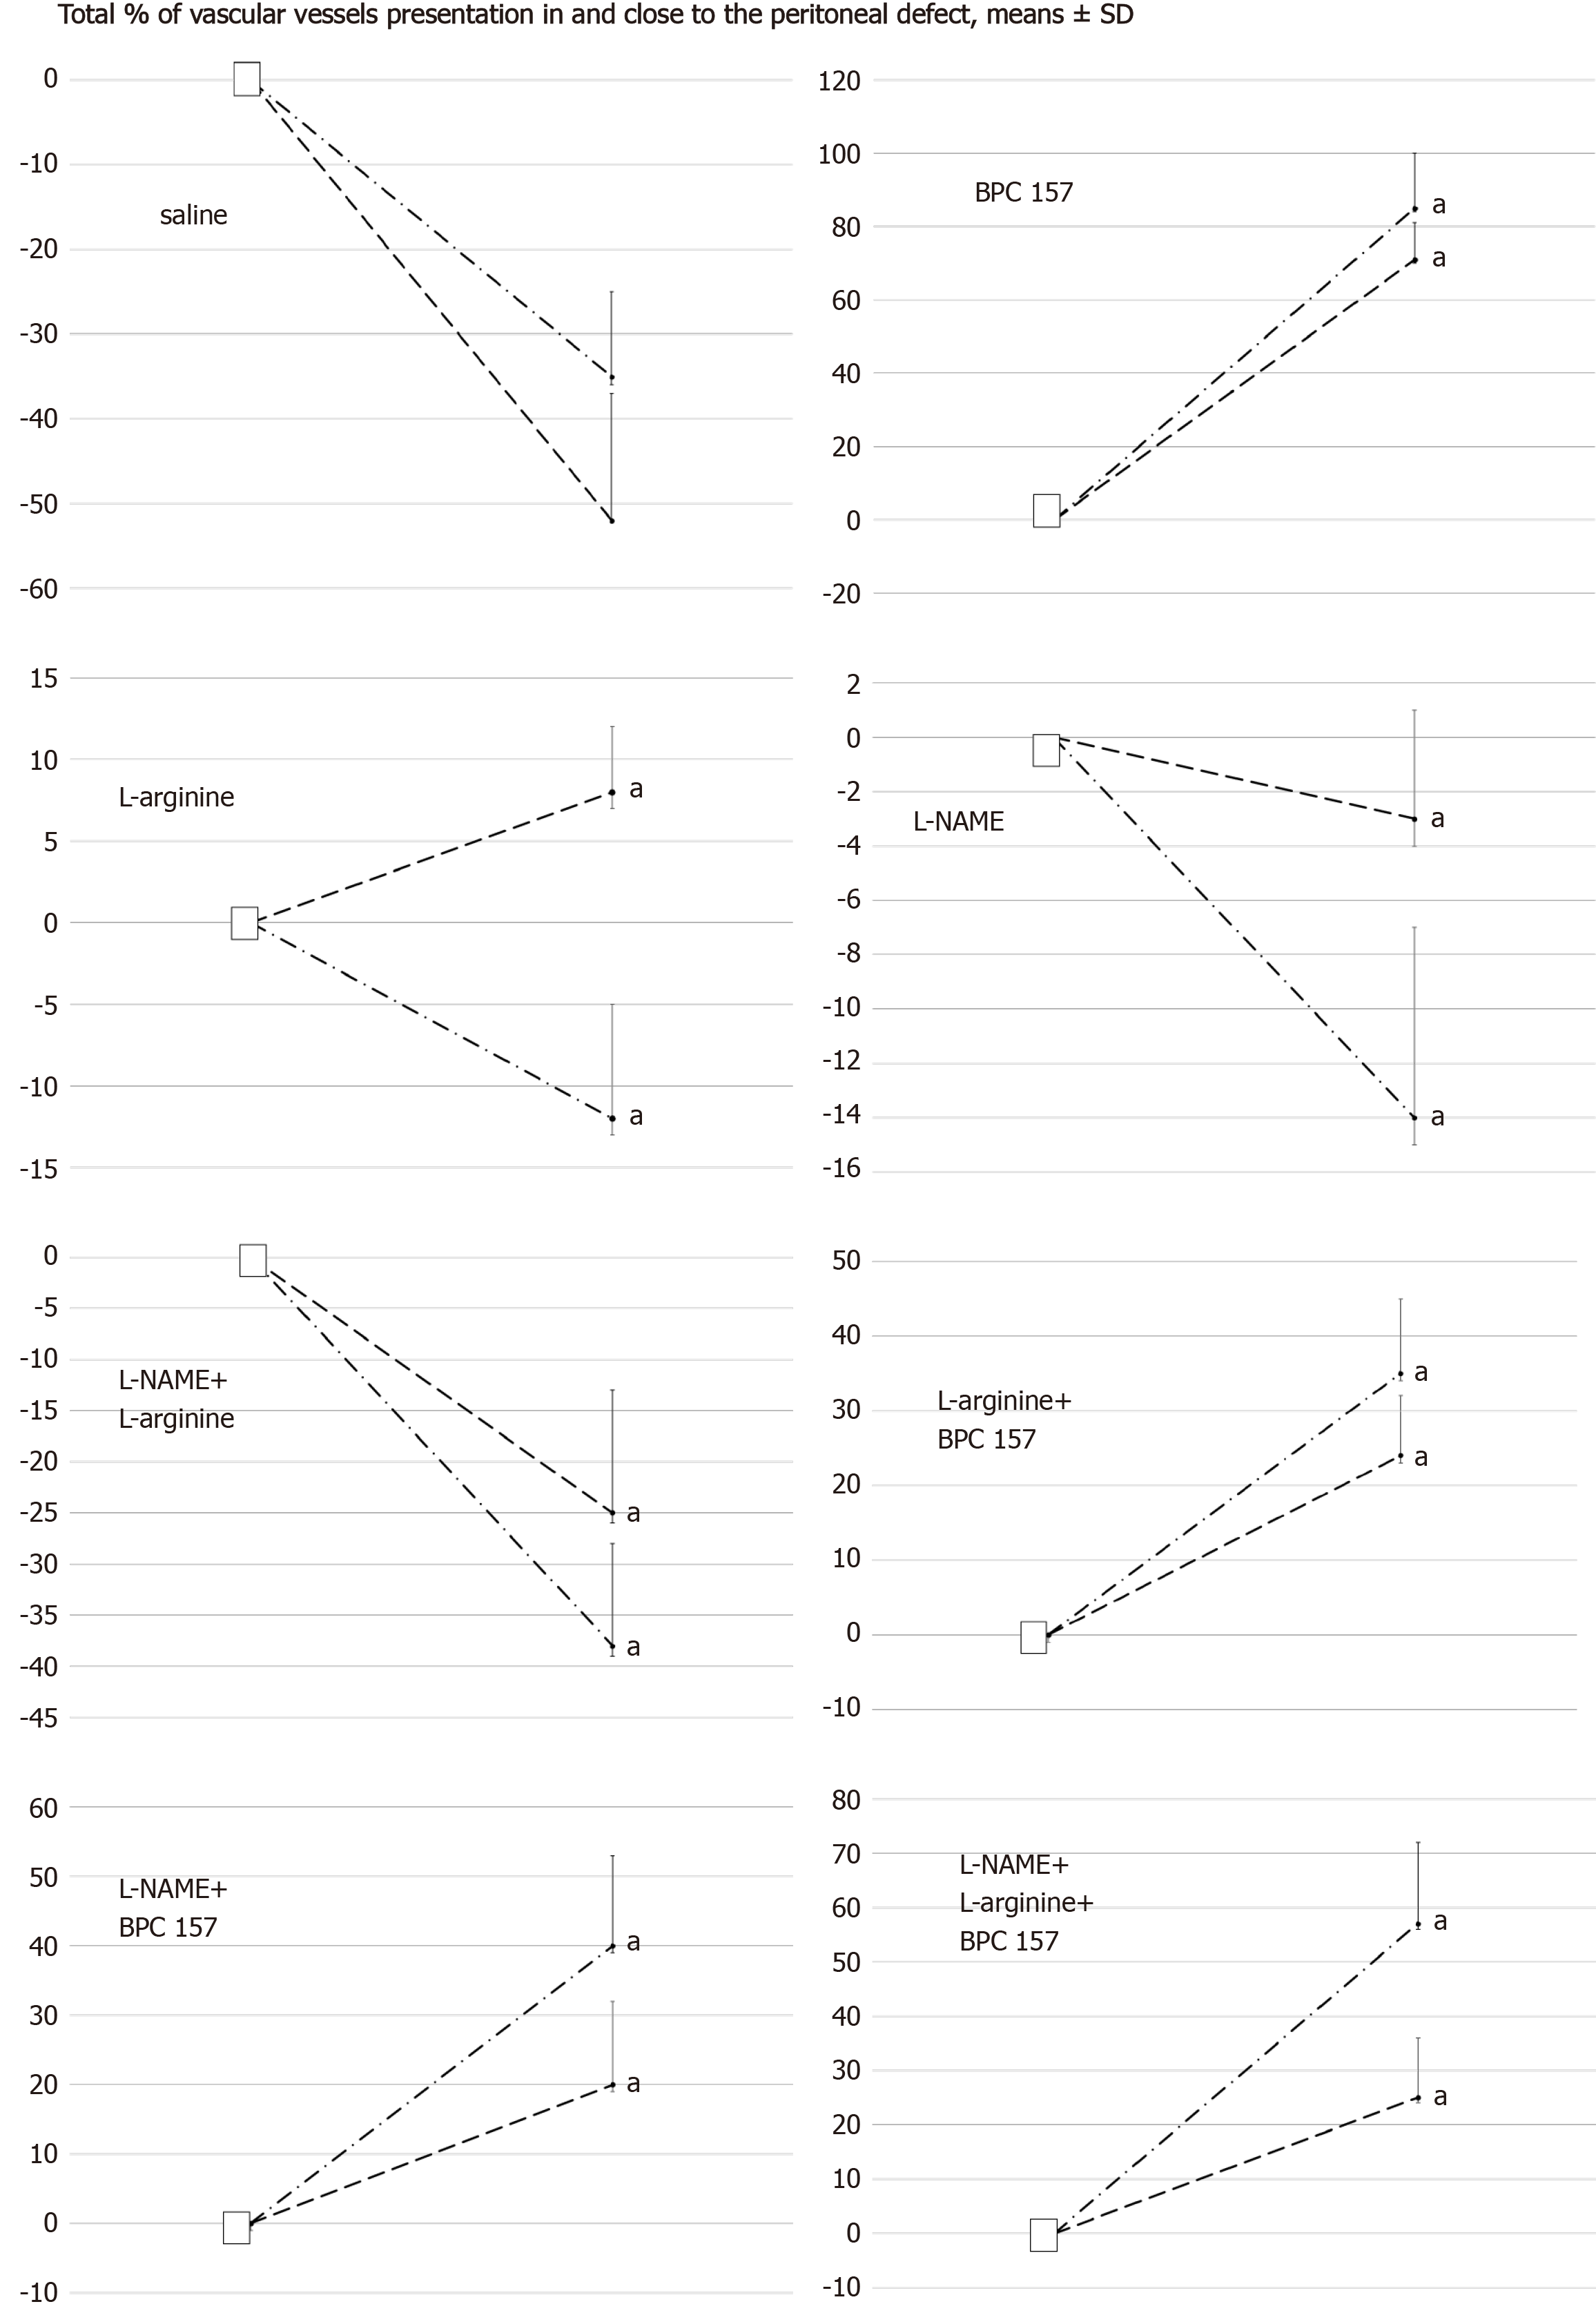
Figure 6 Total % of vascular presentation in (dash) and close to (dash dot) the defect.
White squere indicates the values immediately before therapy and full oval the values at the end of the next 10 min. Medication (/kg, 1 mL bath/rat) at abdominal cavity was BPC 157 (10 µg) (B), L-arginine (A) (100 mg), L-NAME (5 mg) alone or in combinations (L-NAME + L-arginine (NA), L-arginine + BPC 157 (AB), L-NAME + BPC 157 (NB), L-arginine + L-NAME + BPC 157 (ANB) or saline bath equal volume (controls) (C). aP < 0.05 at least vs control; BPC 10 ng presented values 20 ± 8 (in) and 35 ± 8 (close to) with L-arginine (L-arginine + BPC 157); 25 ± 9 (in) and 45 ± 8 (close to) with L-NAME (L-NAME + BPC 157); 20 ± 7 (in) and 55 ± 15 with L-arginine and L-NAME (L-arginine + L-NAME + BPC 157), aP < 0.05 at least vs control.
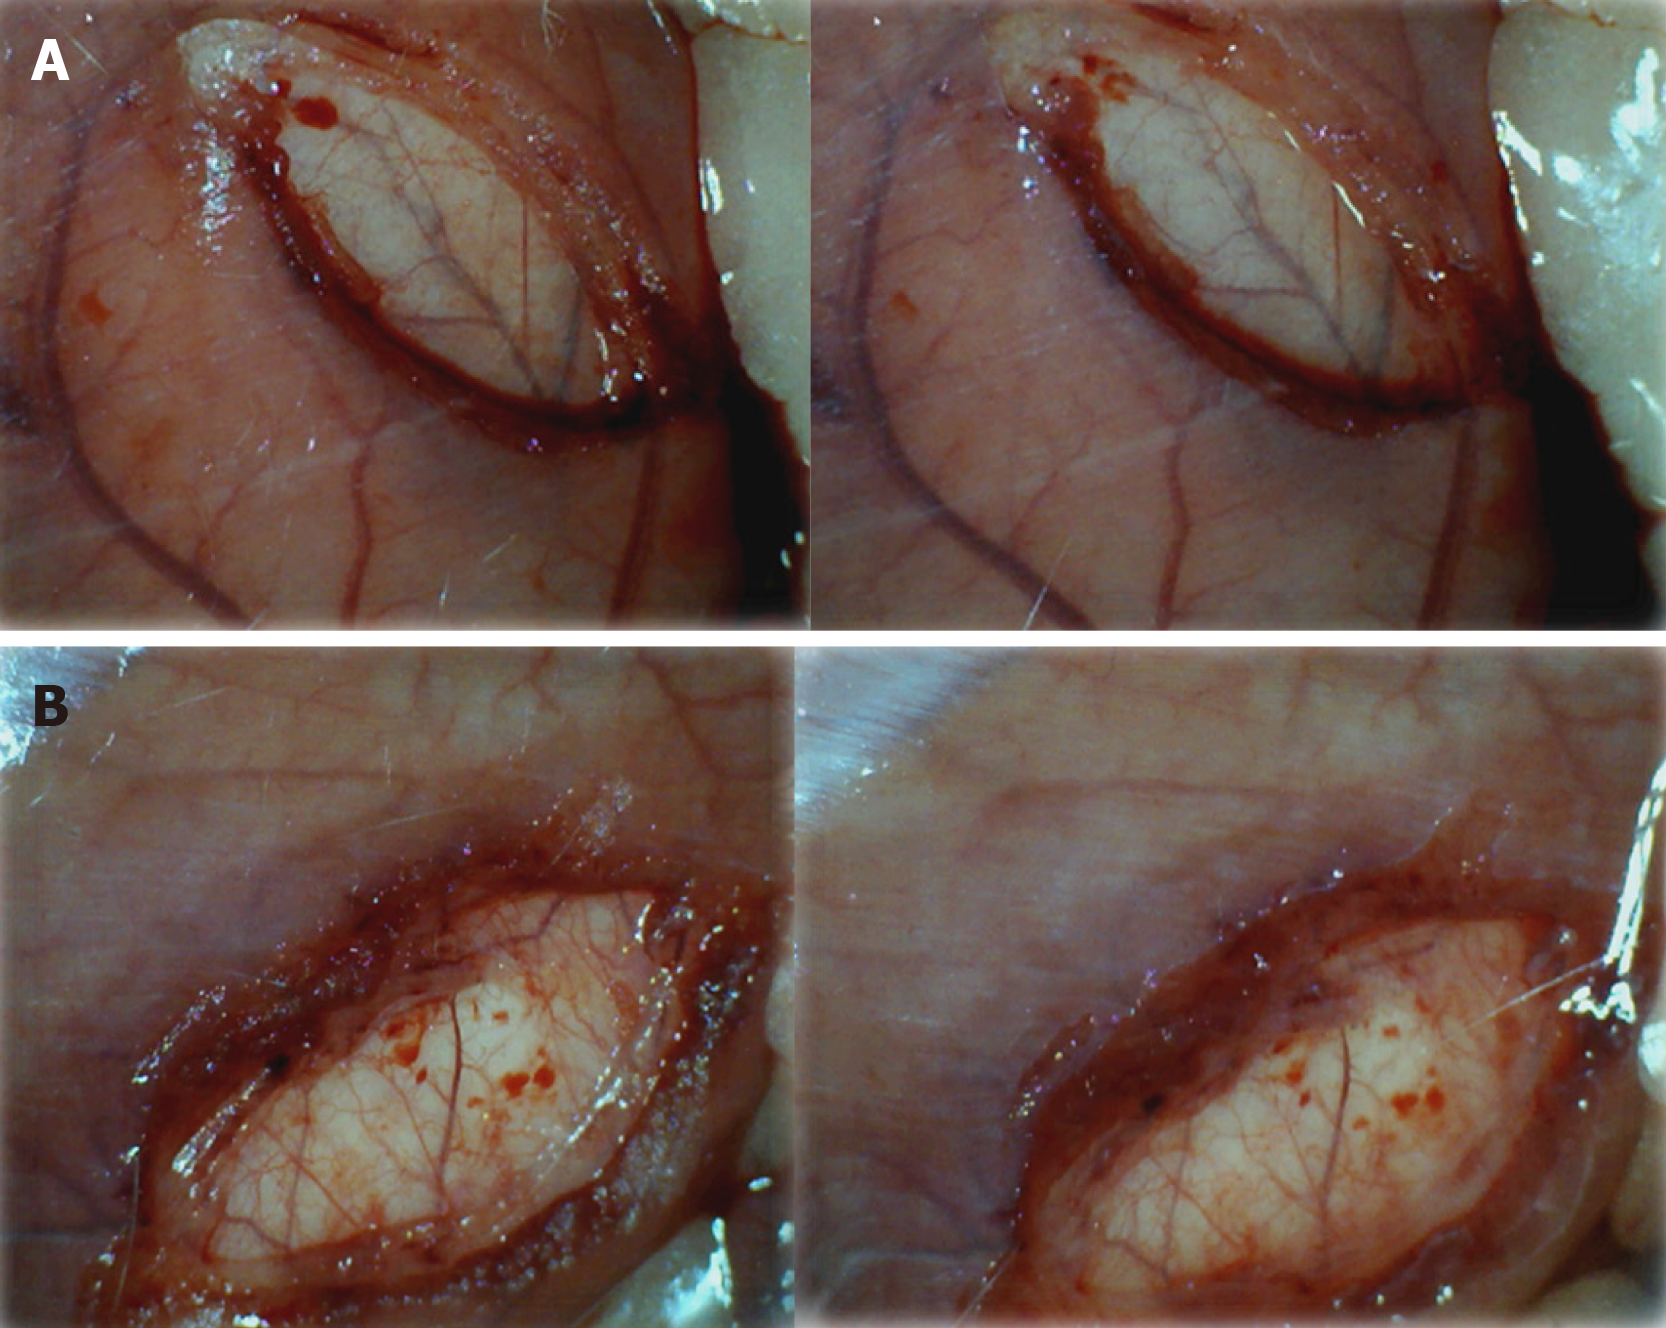
Figure 7 Early vascular presentation in and close to defect, before and immediately after therapy application.
A: Control rats. Illustrative presentation of the vessels in and close to the defect immediately before therapy (left), and immediately after therapy application at the abdominal cavity, under saline solution immersion (right). No particular vessel recruitment; B: BPC 157 rat. Illustrative presentation of the vessels in and close to the defect immediately before therapy (left), and immediately after therapy application at the abdominal cavity, under BPC 157 solution immersion (right). Particular vessel recruitment in and close to the defect.
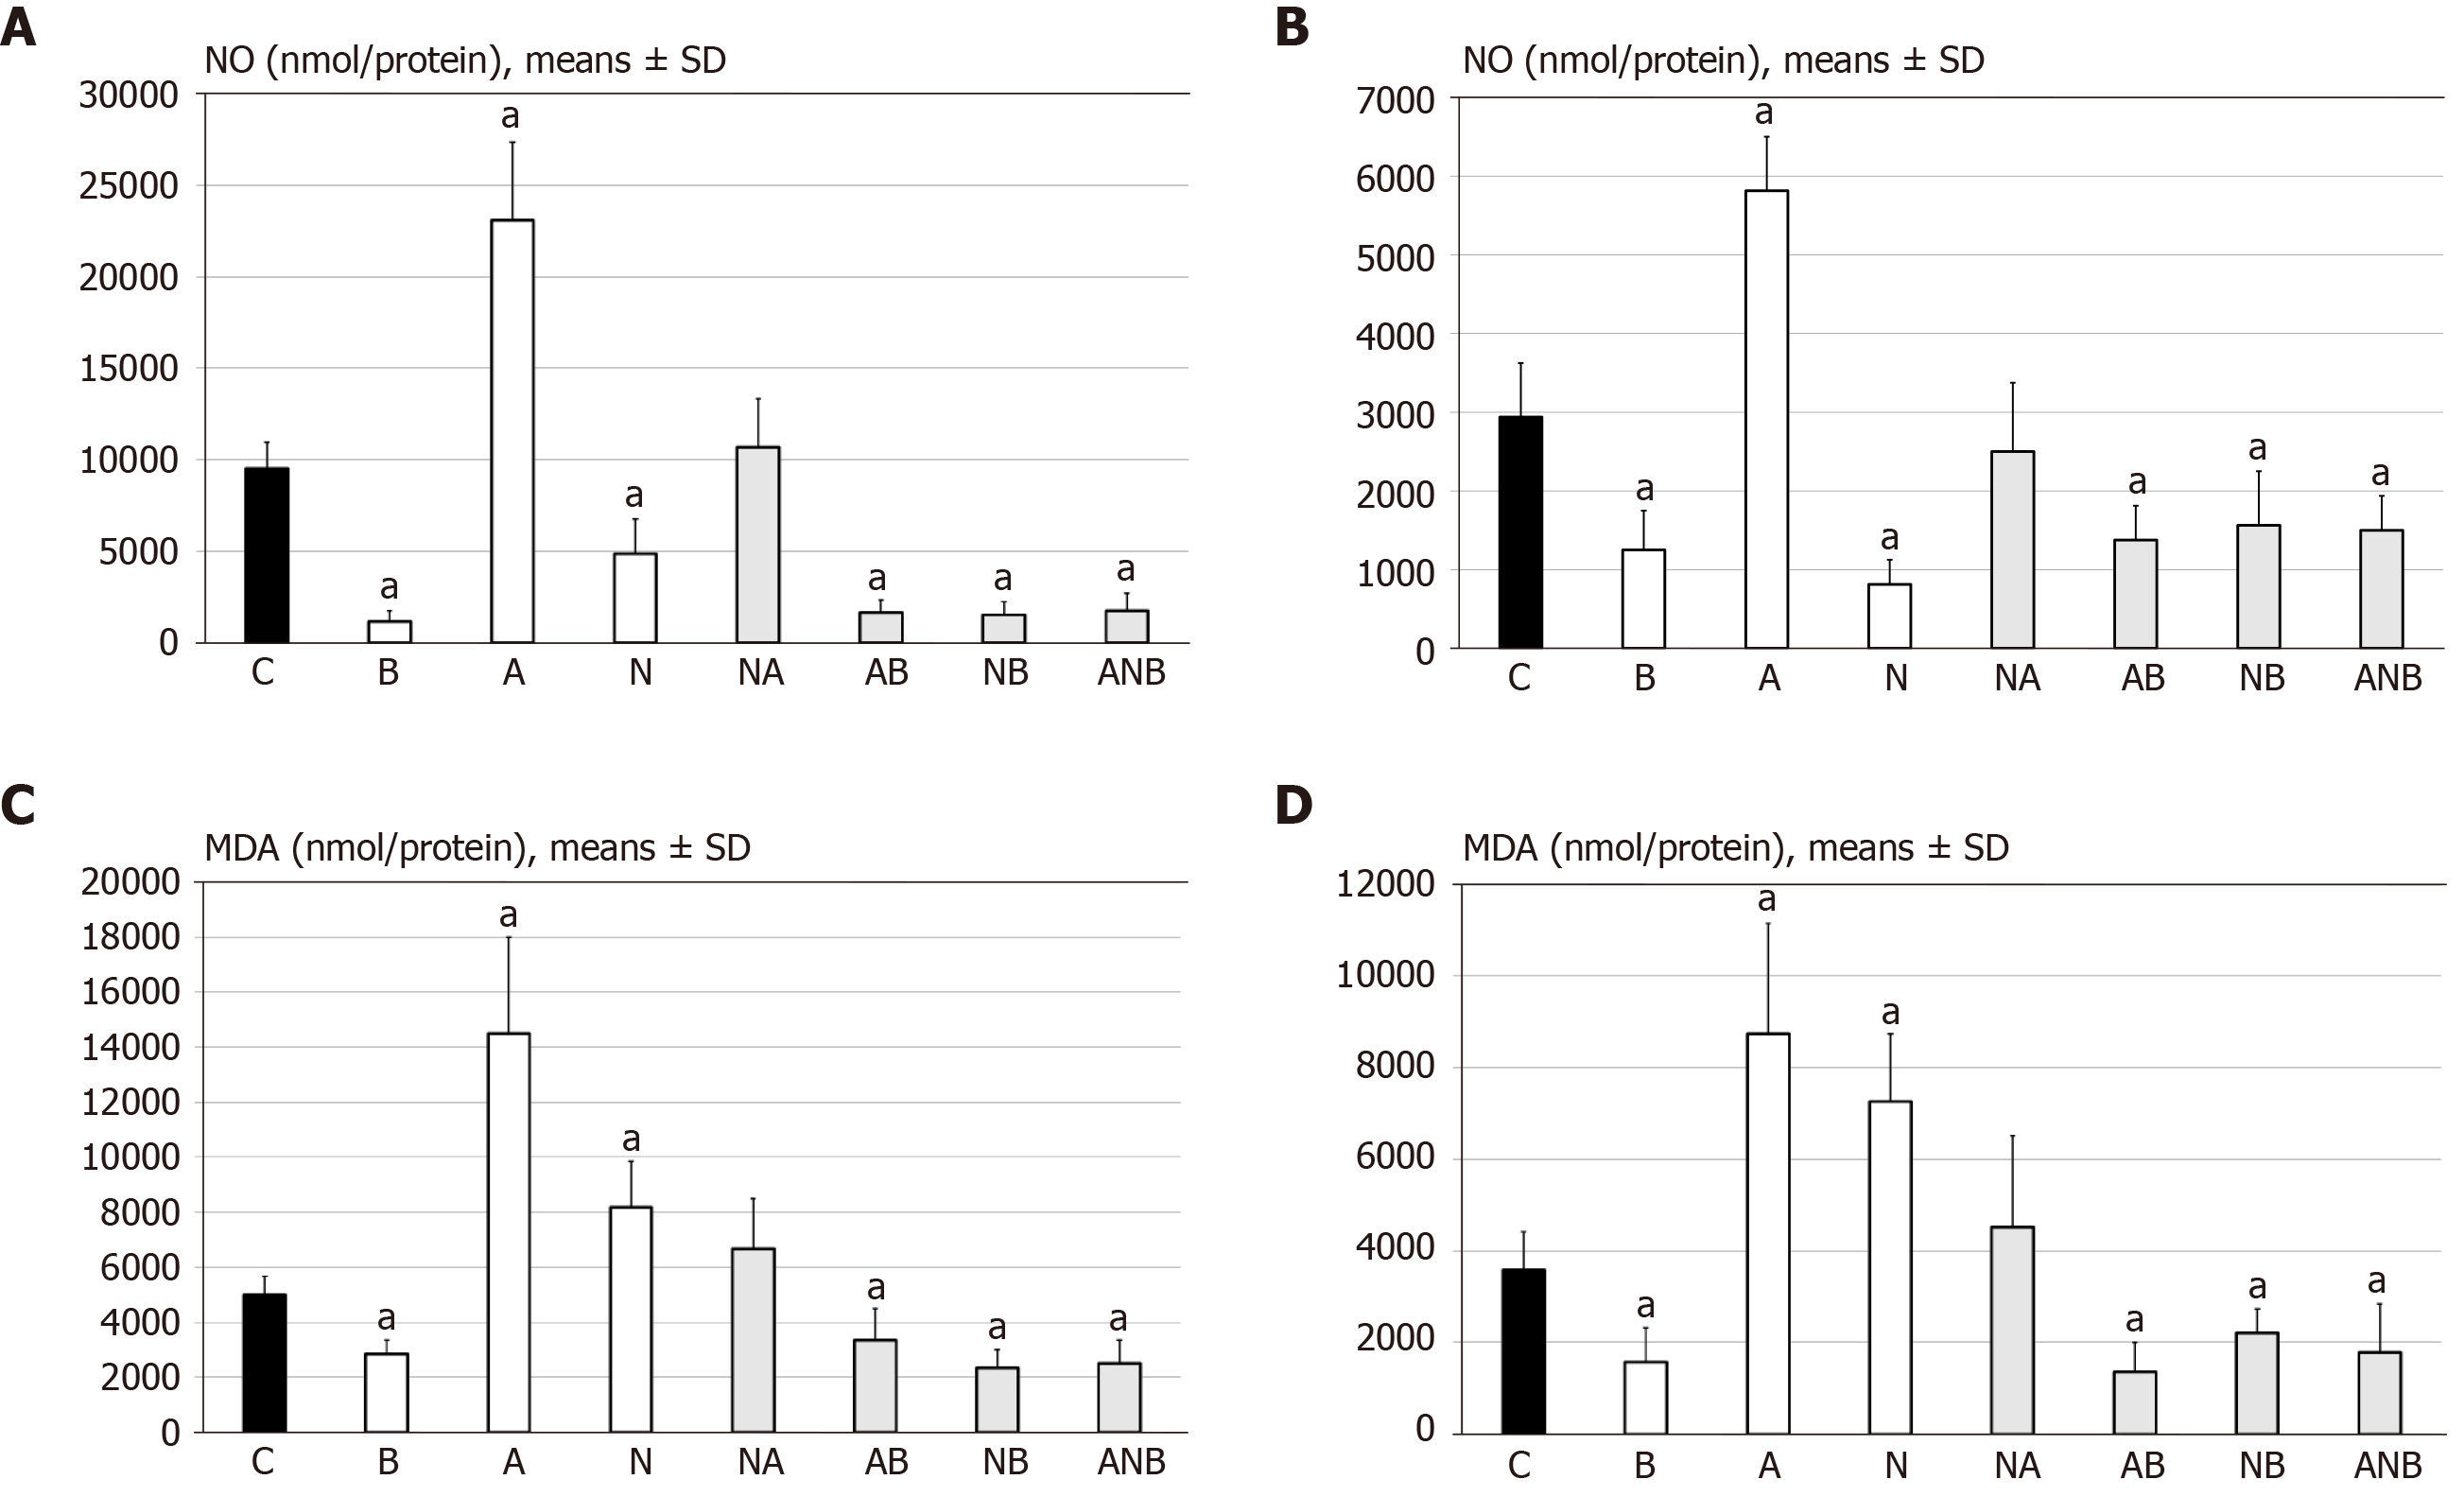
Figure 8 Support was obtained from the presentation of MDA- and NO tissue levels in adhesion tissues.
A: At 7 d post-injury, we determined nitric oxide (NO) in adhesion tissue samples using the Griess reaction. Medication (/kg, 10 mL/2 min bath/rat) at abdominal cavity was BPC 157 (10 µg) (B), L-arginine (A) (100 mg), L-NAME (5 mg) alone or in combinations L-NAME + L-arginine (NA), L-arginine + BPC 157 (AB), L-NAME + BPC 157 (NB), L-arginine + L-NAME + BPC 157 (ANB) or saline bath equal volume (controls) (C). aP < 0.05 at least vs control; B: At 14 d post-injury, we determined NO in adhesion tissue samples using the Griess reaction. Medication (/kg, 10 mL/2 min bath/rat) at abdominal cavity was BPC 157 (10 µg) (B), L-arginine (A) (100 mg), L-NAME (5 mg) alone or in combinations L-NAME + L-arginine (NA), L-arginine + BPC 157 (AB), L-NAME + BPC 157 (NB), L-arginine + L-NAME + BPC 157 (ANB) or saline bath equal volume (controls) (C). aP < 0.05 at least vs control; C: At 7 d post-injury, we determined oxidative stress in adhesion tissue samples was assessed by quantifying thiobarbituric acid reactivity as malondialdehyde equivalents. Medication (/kg, 1 mL bath/rat) at abdominal cavity was BPC 157 (10 µg) (B), L-arginine (A) (100 mg), L-NAME (5 mg) alone or in combinations L-NAME + L-arginine (NA), L-arginine + BPC 157 (AB), L-NAME + BPC 157 (NB), L-arginine + L-NAME + BPC 157 (ANB) or saline bath equal volume (controls) (C). aP < 0.05 at least vs control; and D: At 14 d post-injury, we determined oxidative stress in adhesion tissue samples was assessed by quantifying thiobarbituric acid reactivity as malondialdehyde equivalents. Medication (/kg, 1 bath/rat) at abdominal cavity was BPC 157 (10 µg) (B), L-arginine (A) (100 mg), L-NAME (5 mg) alone or in combinations L-NAME + L-arginine (NA), L-arginine + BPC 157 (AB), L-NAME + BPC 157 (NB), L-arginine + L-NAME + BPC 157 (ANB) or saline bath equal volume (controls)(C). aP < 0.05 at least vs control.
- Citation: Berkopic Cesar L, Gojkovic S, Krezic I, Malekinusic D, Zizek H, Batelja Vuletic L, Petrovic A, Horvat Pavlov K, Drmic D, Kokot A, Vlainic J, Seiwerth S, Sikiric P. Bowel adhesion and therapy with the stable gastric pentadecapeptide BPC 157, L-NAME and L-arginine in rats. World J Gastrointest Pharmacol Ther 2020; 11(5): 93-109
- URL: https://www.wjgnet.com/2150-5349/full/v11/i5/93.htm
- DOI: https://dx.doi.org/10.4292/wjgpt.v11.i5.93


