Copyright
©The Author(s) 2020.
World J Gastrointest Pharmacol Ther. Nov 8, 2020; 11(5): 79-92
Published online Nov 8, 2020. doi: 10.4292/wjgpt.v11.i5.79
Published online Nov 8, 2020. doi: 10.4292/wjgpt.v11.i5.79
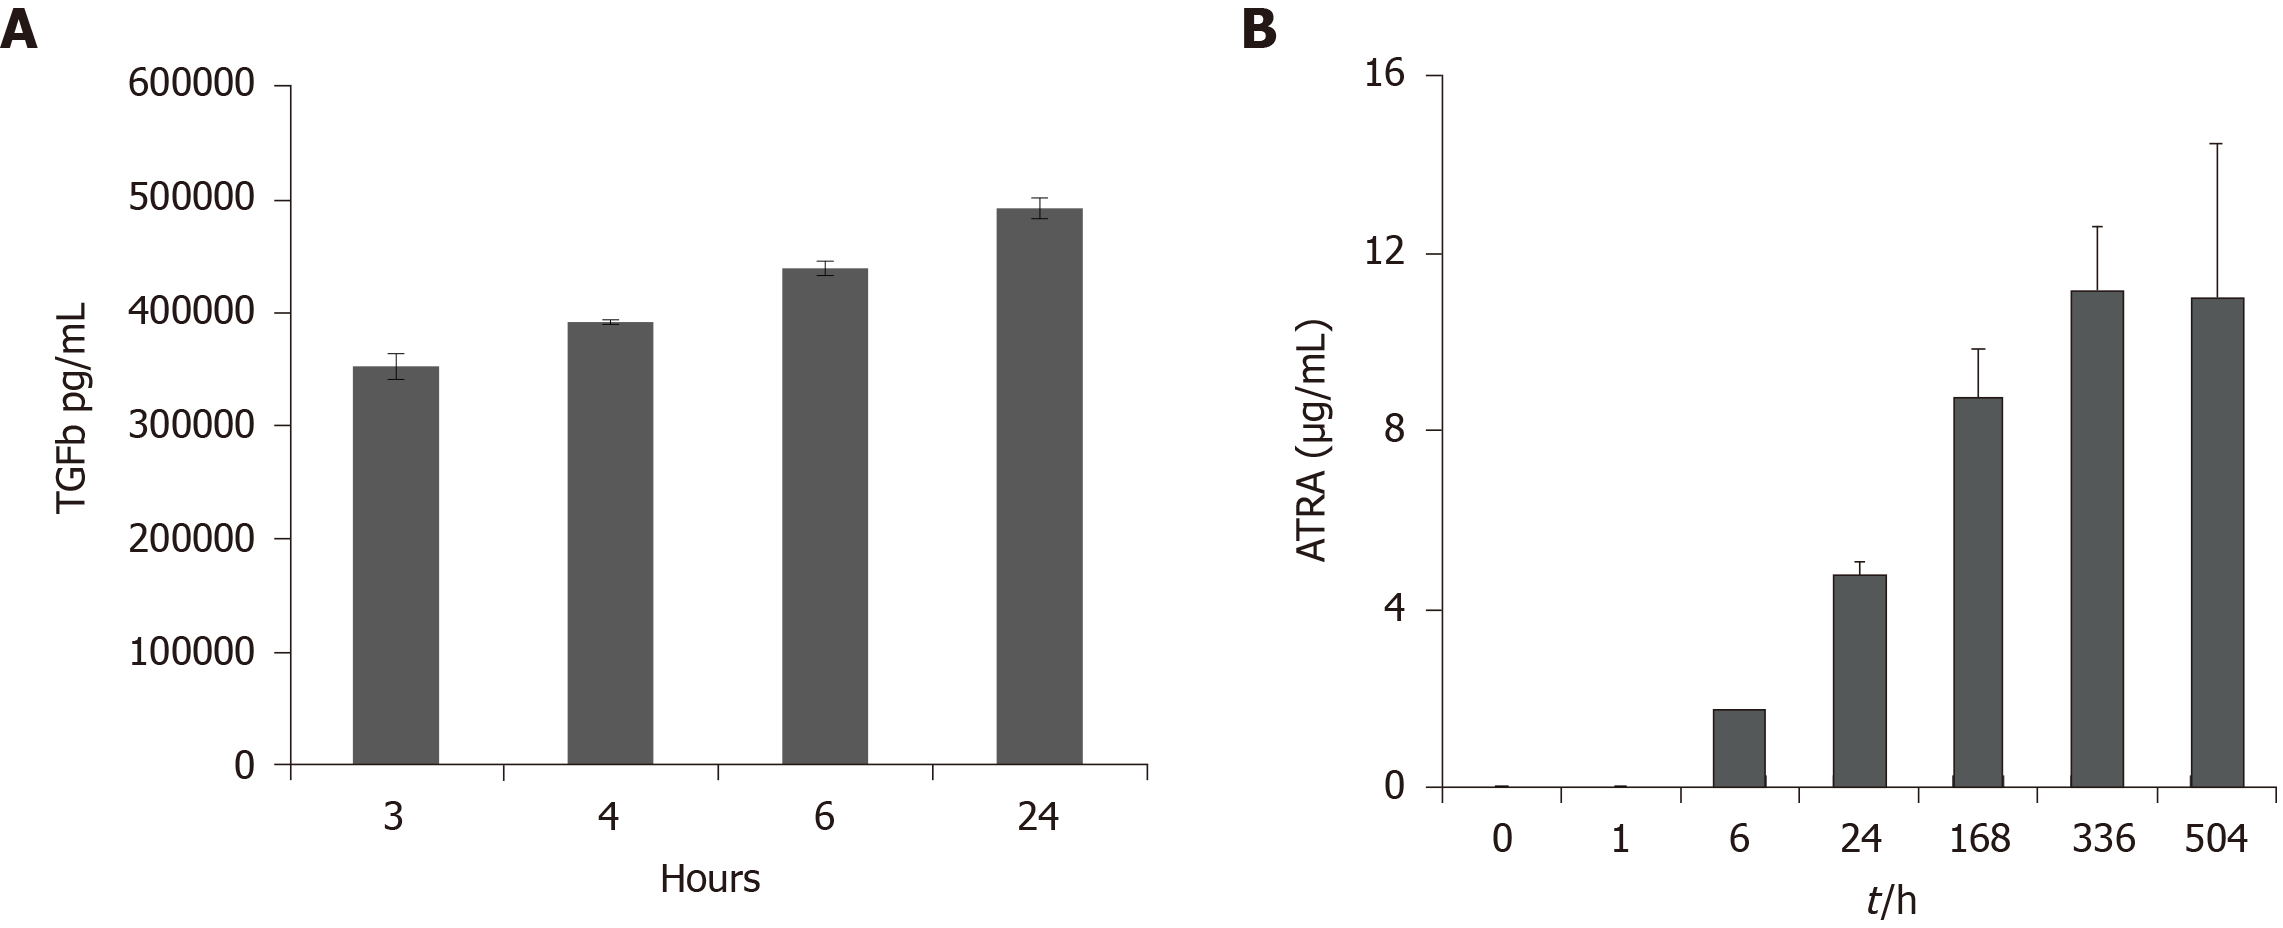
Figure 1 Release profiles of transforming growth factor -loaded poly-lactic acid microspheres and all trans retinoic acid-loaded poly-lactic-co-glycolic acid microspheres.
Transforming growth factor (TGF) was encapsulated in poly-lactic acid (PLA) microspheres (285 μg of TGF per gram of particles) using Phase Inversion Nano-encapsulation (PIN). All trans retinoic acid (ATRA) was encapsulated into poly-lactic-co-glycolic acid (PLGA) microspheres (1 mg of ATRA per gram of particles) using a modification of the solvent evaporation technique (see methods section). A: TGF-loaded microspheres were release-tested using the in vitro release assay as described in the methods section; B: ATRA-loaded microspheres were release-tested using an in vitro extraction assay as described in the methods section. Data are expressed as pg/mL or as μg/mL ± SE. TGFβ: Transforming growth factor ; ATRA: All trans retinoic acid.
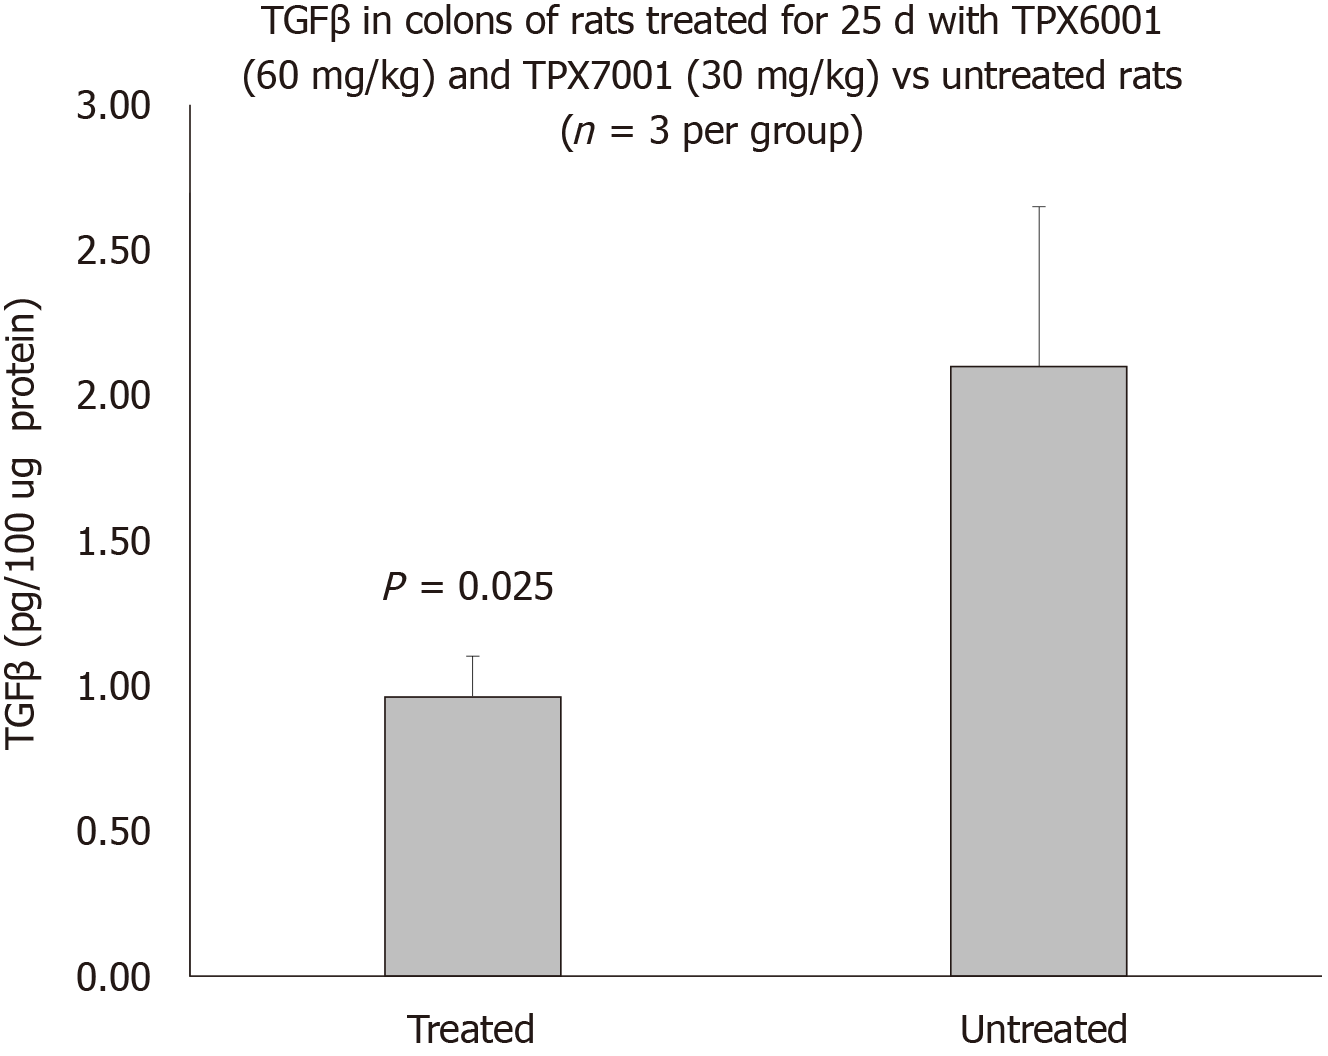
Figure 2 Effect of oral treatment with TreXTAM on levels of transforming growth factor in colon.
Treated rats (n =3) received TreXTAM [60 mg/kg encapsulated transforming growth factor (TGF) and 30 mg/kg encapsulated all trans retinoic acid (ATRA)] three times a week for four weeks. Colons of these animals were taken 4 h after the final dose, along with tissues from age and sex matched untreated animals. All tissues were frozen at -20 oC and stored until used. Tissues were then thawed and homogenized using a glass tube with the pestle insert, in the presence of EDTA-free SIGMAFAST™ Protease Inhibitor Cocktail Tablets (used as per manufacturer’s instructions). Levels of TGF in lysates were determined by ELISA according to manufacturer’s instructions but without acid activation. (Quantikine, R&D Systems, Minneapolis, MN, United States). Total protein concentration was determined by BCA Protein Assay- Pierce (Thermo Fisher Cat# 23227) Data are expressed as pg/100 μg protein ± standard deviation. TGFβ: Transforming growth factor .
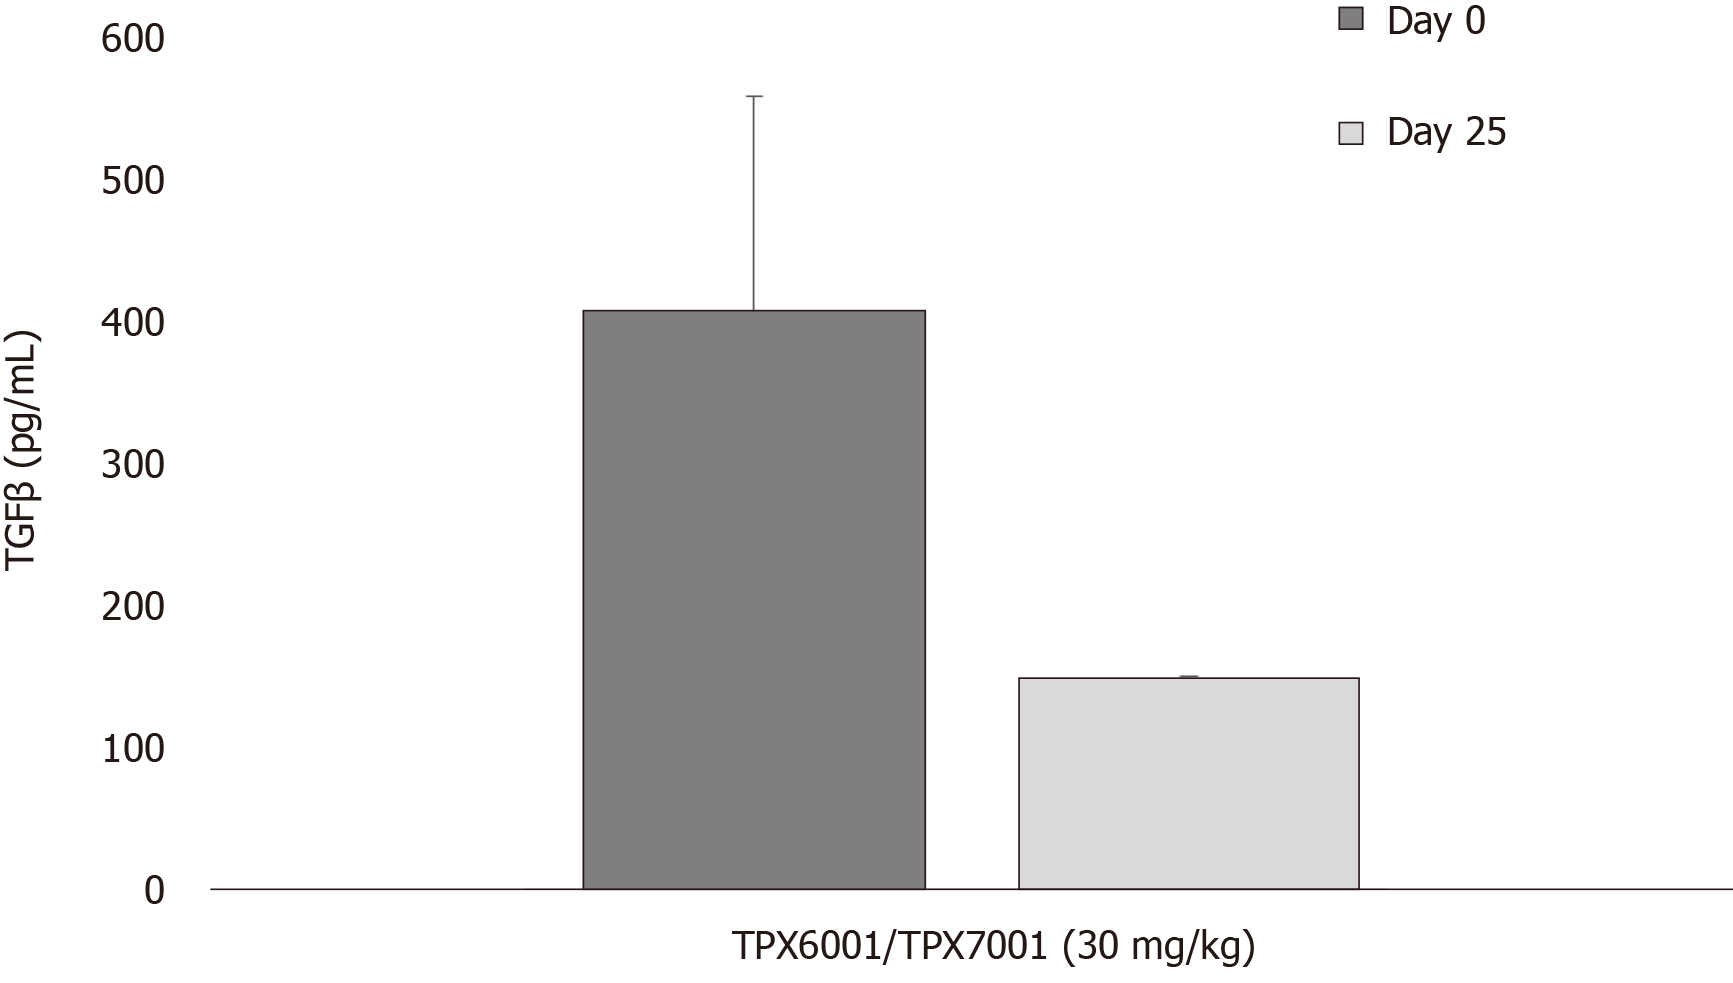
Figure 3 Baseline serum levels of transforming growth factor in naïve and TreXTAM treated animals.
Blood was taken from naïve male and female Sprague-Dawley rats (males and females, 3 per sex) before and after treatment with TreXTAM [30 mg/kg encapsulated transforming growth factor (TGF) and 30 mg/kg encapsulated all trans retinoic acid (ATRA)]. Animals were dosed by gavage 3 × per week for 25 d. Serum levels of TGFβ were determined by ELISA without acid activation (R&D Systems Quantikine ELISA Catalog# MB100B). TGFβ: Transforming growth factor .
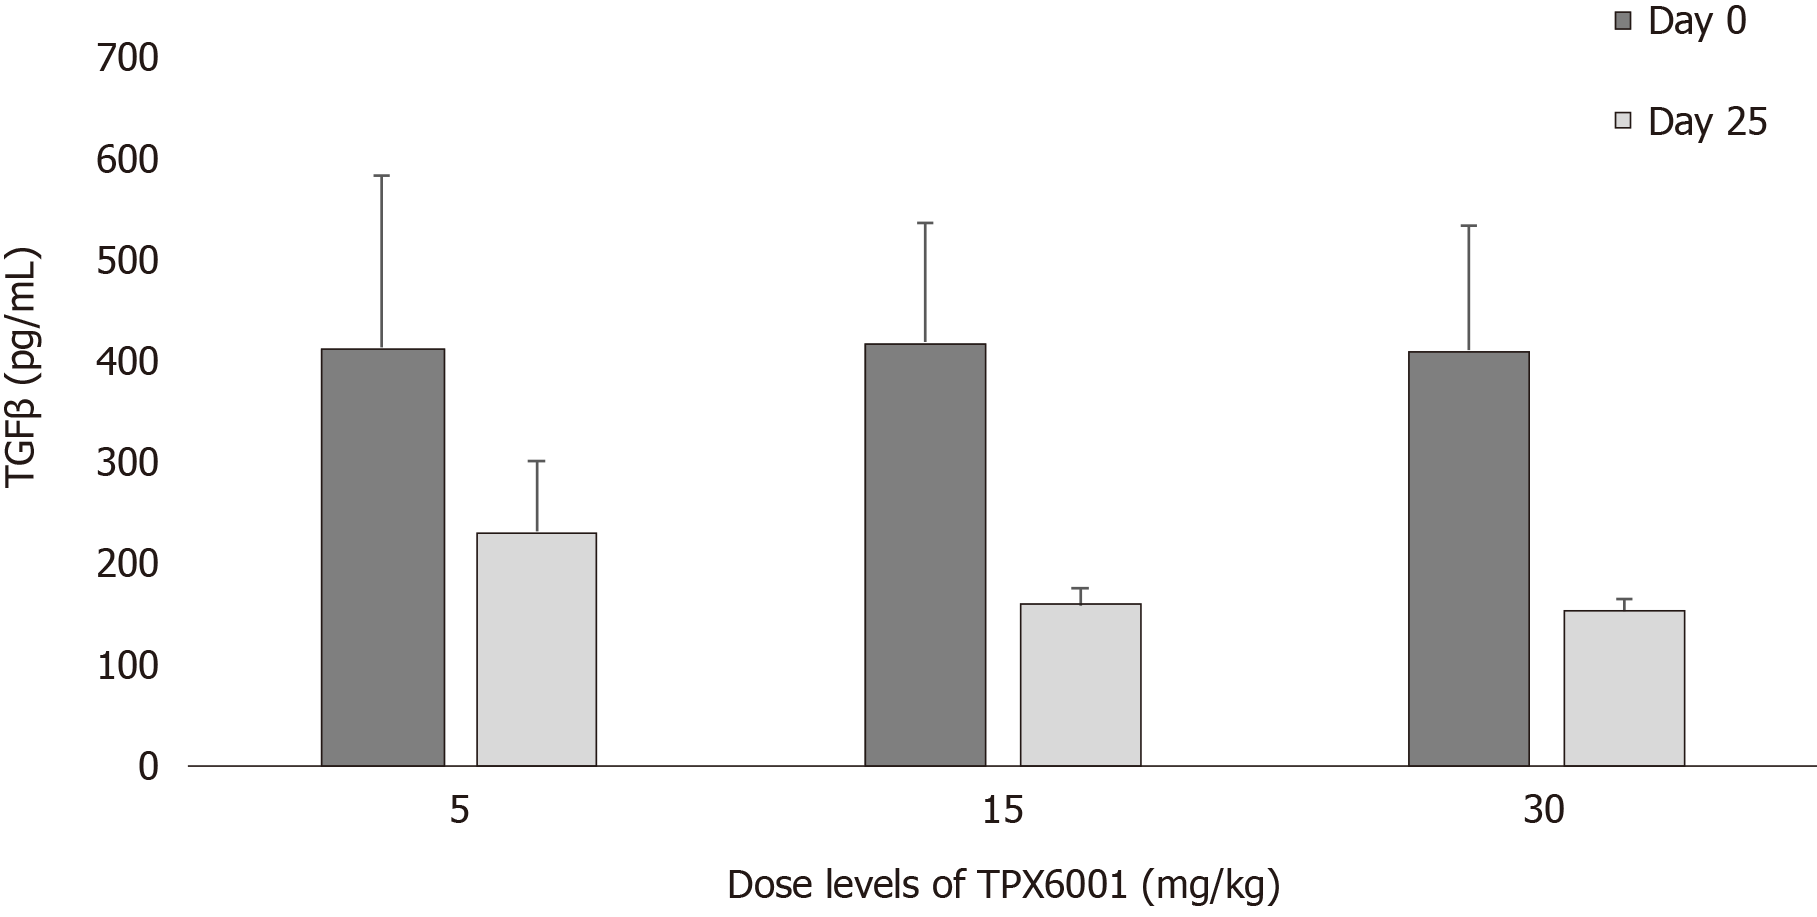
Figure 4 Baseline serum levels of transforming growth factor in naïve rats and in poly-lactic acid encapsulated transforming growth factor treated rats.
Blood was taken from naïve Sprague-Dawley rats (males and females, 6 per sex) before and after treatment with poly-lactic acid encapsulated transforming growth factor (TGF). Animals were treated by gavage at doses of 5, 15 or 30 mg/kg, 3 × per week for 25 d. Serum levels of TGFβ were determined by ELISA without acid activation (R&D Systems Quantikine ELISA Catalog# MB100B). Statistical significance (P ≤ 0.02) vs day 25 at 5 mg/kg vs day 25 at 30 mg/kg. All differences between day 0 pre-dose and day 25 pre-dose were significant (P ≤ 0.01). TGFβ: Transforming growth factor .
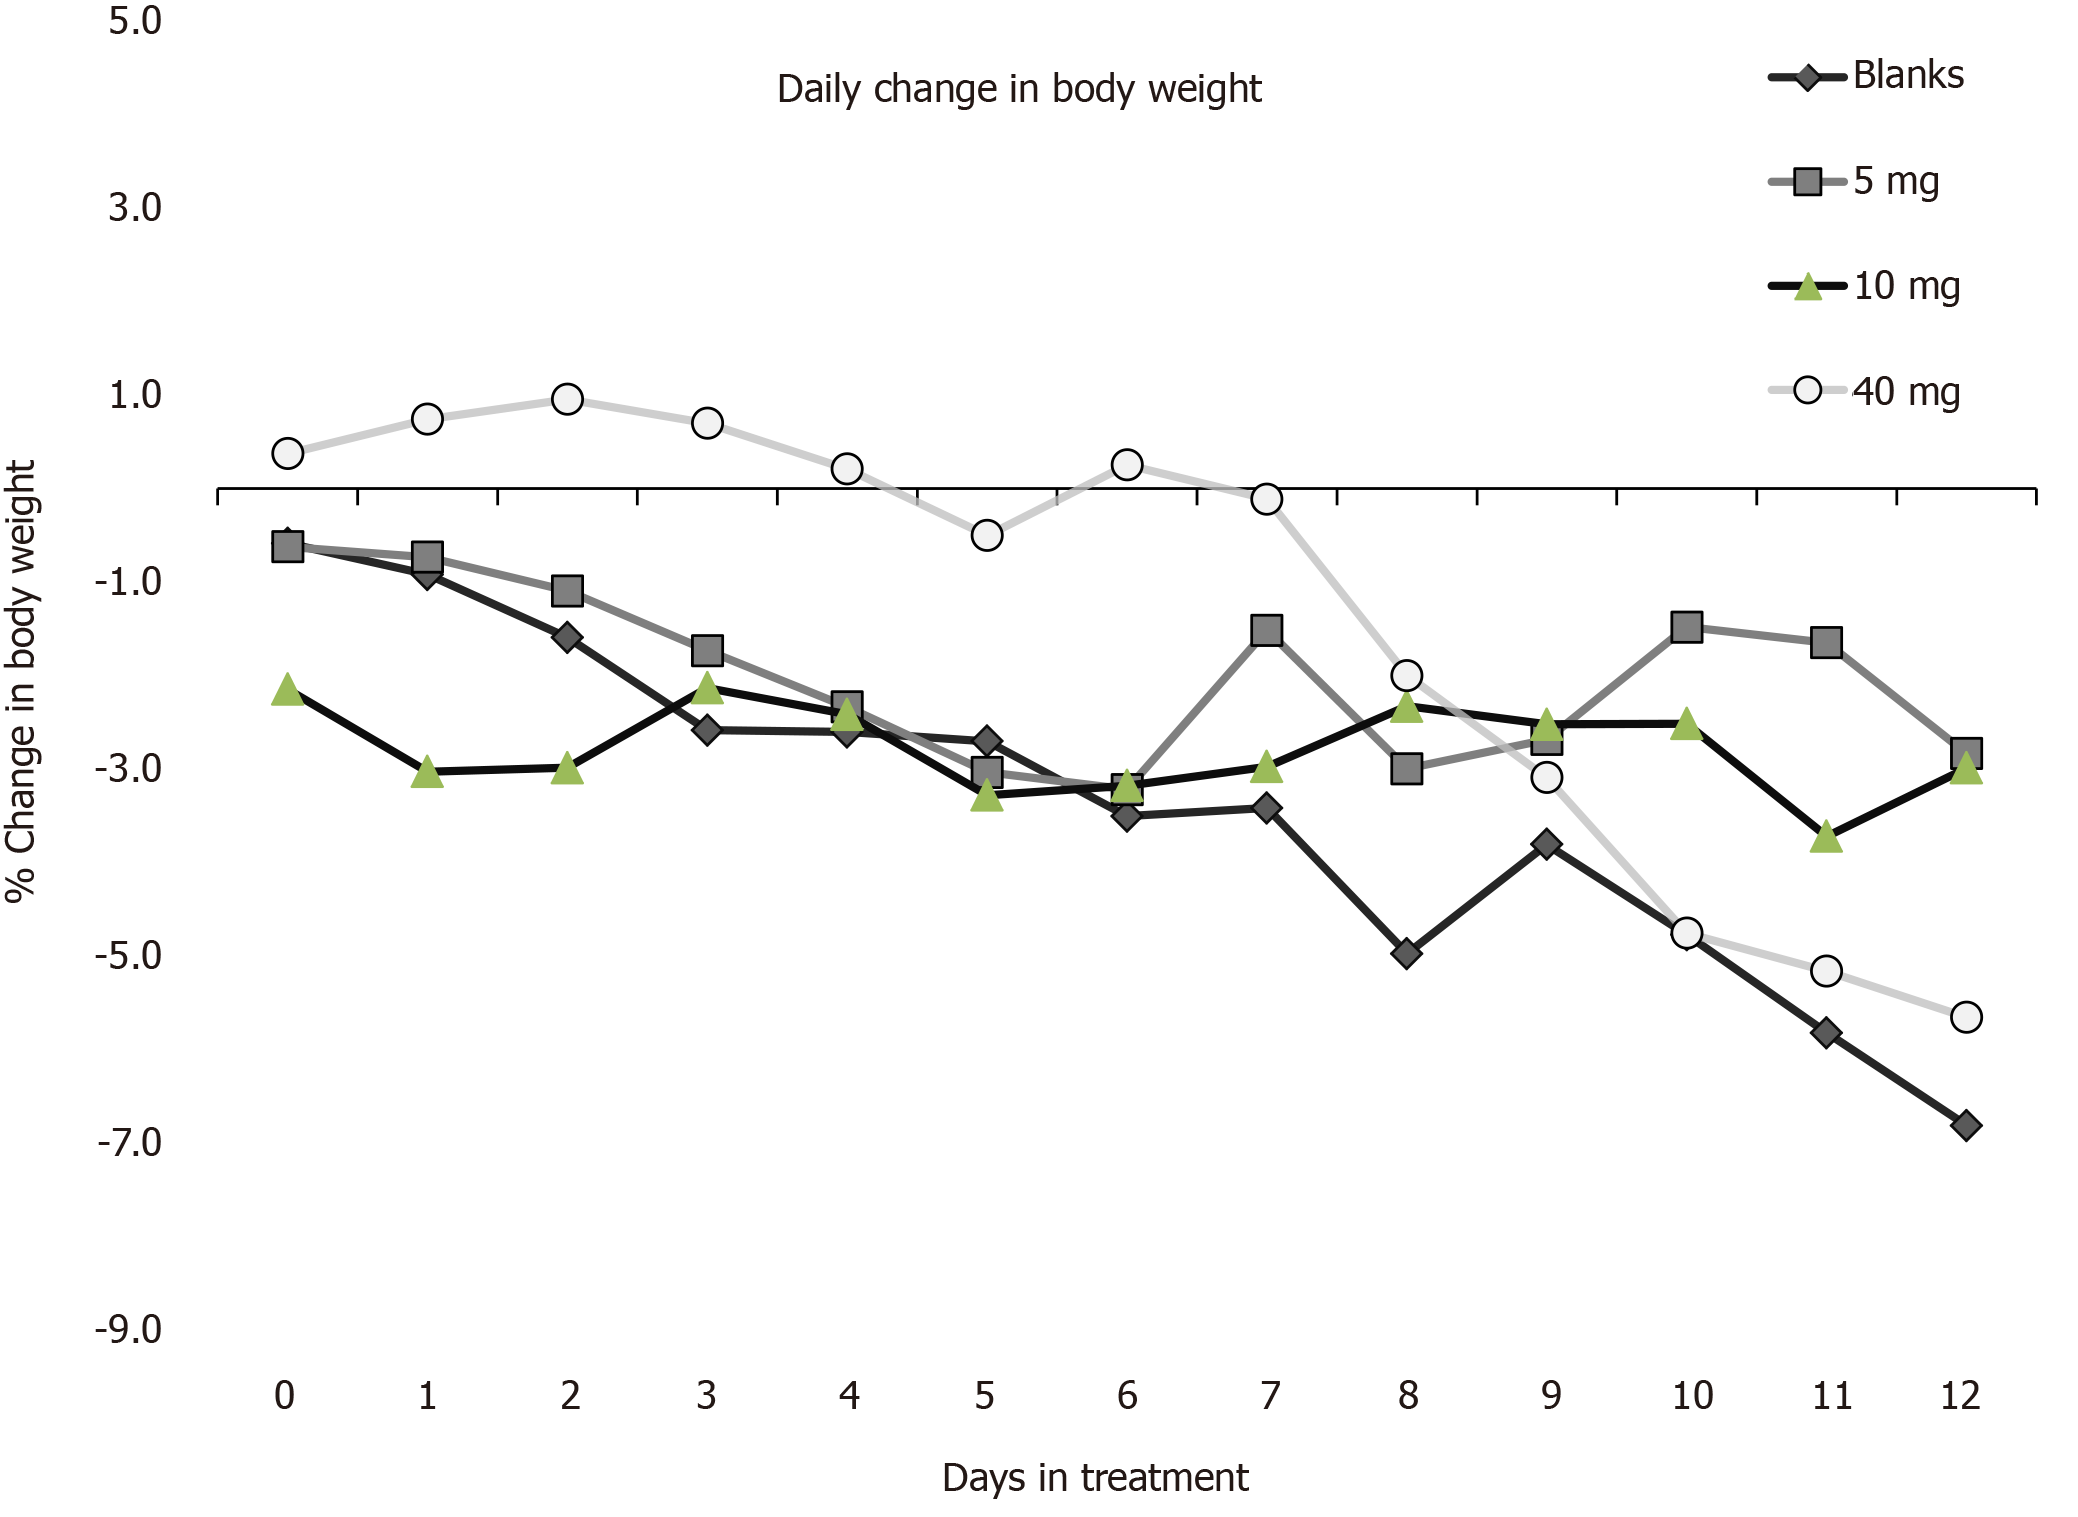
Figure 5 Therapeutic activity of transforming growth factor β loaded particles (TPX6001) in the SCID mouse adoptive CD4+ CD25- T-cell transfer model of inflammatory bowel disease.
Mice (n = 6-9 per group) with established disease were weighed (day 0) and fed transforming growth factor β1 microspheres (5, 10, or 40 mg/mouse), or blank microspheres (40 mg/mouse) in 0.2 ml water 3 times per week for 2 wk. Mice were monitored for overall disease score and weighed 3 times per week for two weeks. Mice were sacrificed 2 d after the last dose, serum taken, colons weighed and measured; and colons samples prepared for histological analysis (five randomly selected sections from each mouse). Data are expressed as % change in body weight relative to day of first treatment. 5 and 40 mg/mouse TPX6001-treated groups were significantly different (P = 0.01 on days 3-12) from animals treated with blank microspheres.
- Citation: Hammer L, Furtado S, Mathiowitz E, Auci DL. Oral encapsulated transforming growth factor β1 reduces endogenous levels: Effect on inflammatory bowel disease. World J Gastrointest Pharmacol Ther 2020; 11(5): 79-92
- URL: https://www.wjgnet.com/2150-5349/full/v11/i5/79.htm
- DOI: https://dx.doi.org/10.4292/wjgpt.v11.i5.79


