Copyright
©The Author(s) 2016.
World J Gastrointest Pathophysiol. Nov 15, 2016; 7(4): 300-306
Published online Nov 15, 2016. doi: 10.4291/wjgp.v7.i4.300
Published online Nov 15, 2016. doi: 10.4291/wjgp.v7.i4.300
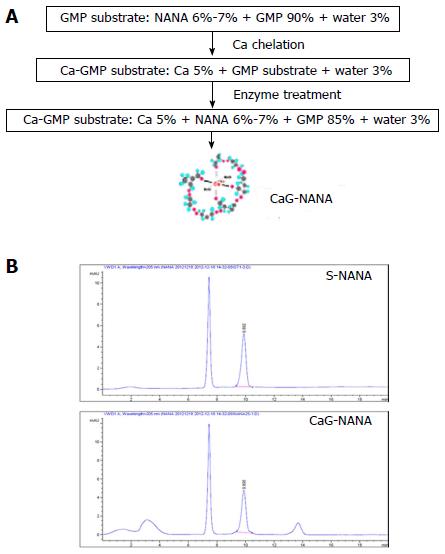
Figure 1 Confirmation of N-acetylneuraminic acid.
A: The scheme of CaG-NANA manufacture; B: HPLC analysis of NANA content in CaG-NANA. The condition of HPLC analysis is described in Table 1. GMP: Glycomacropeptide; HPLC: High performance liquid chromatography; CaG-NANA: Calcium-glycomacropeptide-N-acetylneuraminic acid; S-NANA: Standard N-acetylneuraminic acid.
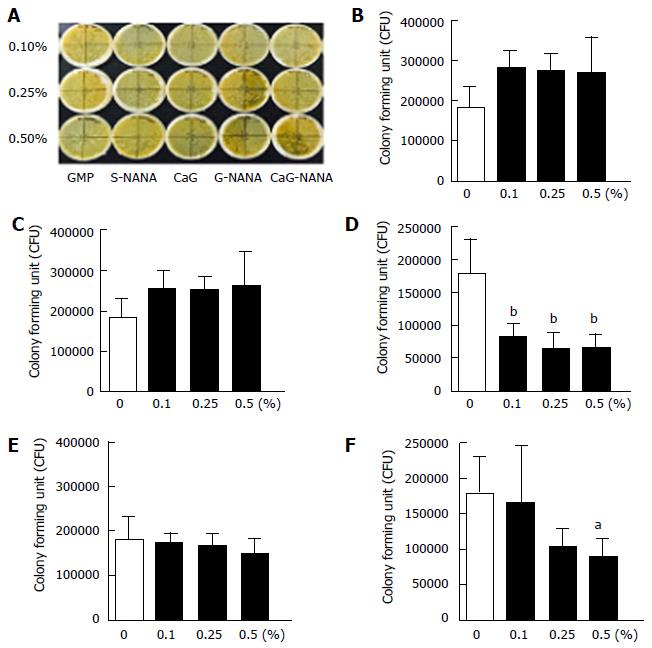
Figure 2 Inhibitory effect of calcium-glycomacropeptide-N-acetylneuraminic acid on Helicobacter pylori in vitro.
Agar plates were inoculated with Helicobacter pylori (H. pylori) at serial concentrations of 1 × 10⁸, 1 × 10⁷, and 1 × 10⁶ CFU/mL and cultured for 72 h. The minimal inhibitory concentration (MIC) was defined as the minimal concentration of materials required for complete inhibition of H. pylori growth. Bactericidal activity was evaluated using time-kill curves with 0.5, 1.0 and 2.0 × MIC of CaG-NANA compared with blank controls. All experiments were performed three times and significance was set at aP < 0.1 and bP < 0.05. A: Picture of colony forming unit assay; B: GMP; C: CaG; D: S-NANA; E: G-NANA; F: CaG-NANA. GMP: Glycomacropeptide; CaG: Calcium-glycomacropeptide; S-NANA: Ststandard N-acetylneuraminic acid; CaG-NANA: Calcium-glycomacropeptide-N-acetylneuraminic acid.
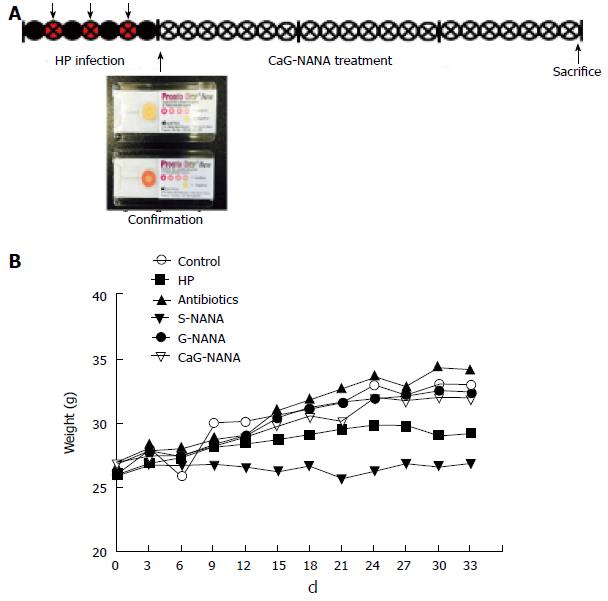
Figure 3 Inhibitory effect of calcium-glycomacropeptide-N-acetylneuraminic acid on Helicobacter pylori in vivo.
Antibiotic doses are described in the “materials and methods” section. A: Schematic design of in vivo study; B: Weight changes of mice. HP: Helicobacter pyroli; S-NANA: Standard N-acetylneuraminic acid; G-NANA: Glycomacropeptide-N-acetylneuraminic acid; CaG-NANA: Calcium-glycomacropeptide-N-acetylneuraminic acid.
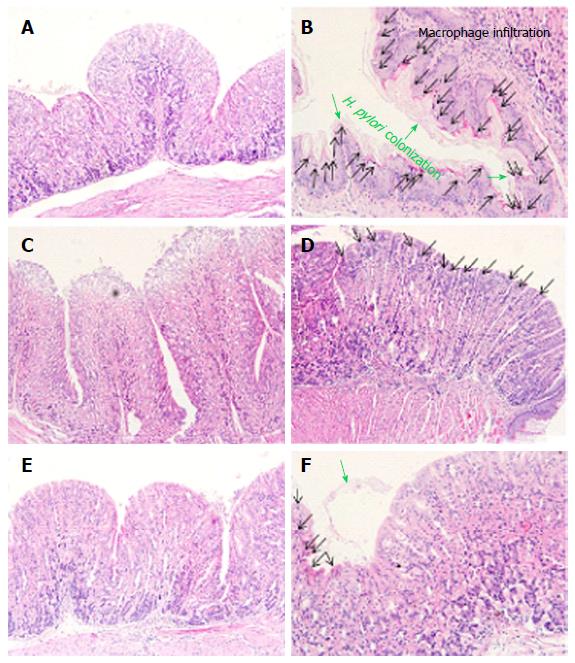
Figure 4 Histology of the gastric mucosa.
Mouse stomachs were removed and underwent hematoxylin and eosin staining. H. pylori colonization and macrophage infiltration were observed under a light microscope. A: Normal group; B: H. pylori infected group; C: Antibiotics treated group; D: S-NANA treated group; E: G-NANA treated group; F: CaG-NANA treated group. S-NANA: Standard N-acetylneuraminic acid; G-NANA: Glycomacropeptide-N-acetylneuraminic acid; CaG-NANA: Calcium-glycomacropeptide-N-acetylneuraminic acid.
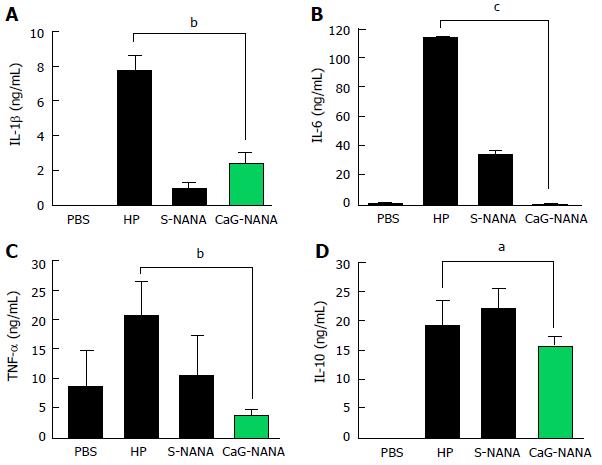
Figure 5 Expression levels of interleukine-1β, interleukine-6, tumor necrosis factor-α, and interleukine-10 in blood serum determined by enzyme-linked immunosorbent assay.
The assays were performed according to the manufacturer’s instructions and all experiments were repeated in triplicate. Statistical analysis was performed using Dunn’s multiple comparison test with significance set at aP < 0.1 and bP < 0.05, cP < 0.01. A: IL-1β; B: IL-6; C: TNF-α; D: IL-10. IL: Interleukine; TNF: Tumor necrosis factor; S-NANA: Standard N-acetylneuraminic acid; G-NANA: Glycomacropeptide-N-acetylneuraminic acid; CaG-NANA: Calcium-glycomacropeptide-N-acetylneuraminic acid.
- Citation: Rhee YH, Ku HJ, Noh HJ, Cho HH, Kim HK, Ahn JC. Anti-Helicobacter pylori effect of CaG-NANA, a new sialic acid derivative. World J Gastrointest Pathophysiol 2016; 7(4): 300-306
- URL: https://www.wjgnet.com/2150-5330/full/v7/i4/300.htm
- DOI: https://dx.doi.org/10.4291/wjgp.v7.i4.300


