Copyright
©2010 Baishideng Publishing Group Co.
World J Gastrointest Pathophysiol. Dec 15, 2010; 1(5): 154-165
Published online Dec 15, 2010. doi: 10.4291/wjgp.v1.i5.154
Published online Dec 15, 2010. doi: 10.4291/wjgp.v1.i5.154
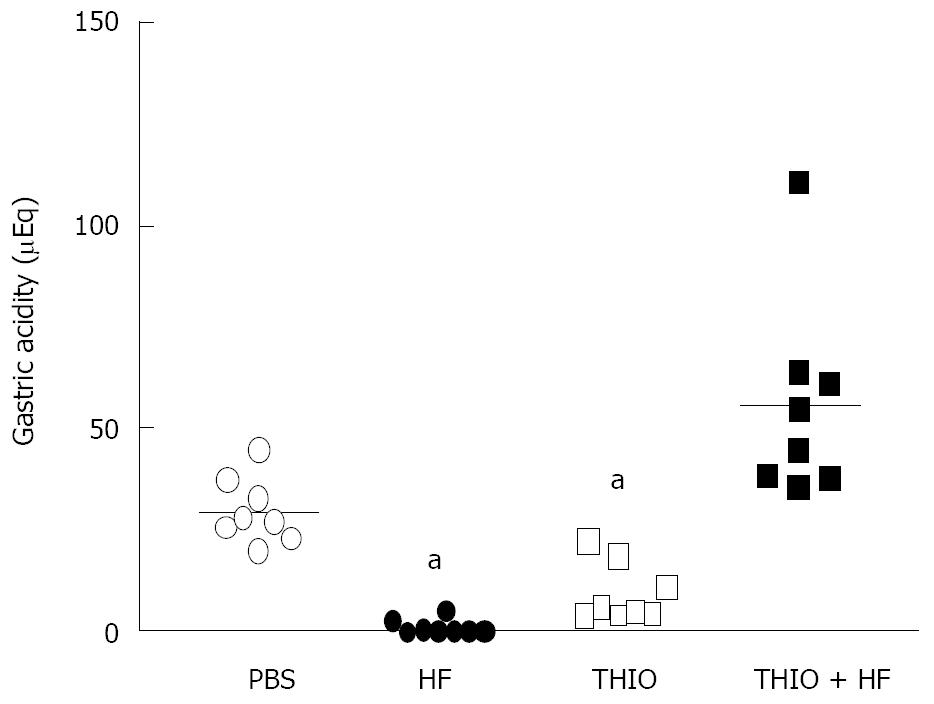
Figure 1 Helicobacter felis colonization results in decreased gastric acidity that is resolved with thioperamide treatment.
Gastric acidity for PBS, Helicobacter felis (HF), thioperamide (THIO) and THIO plus HF infection is shown as a scatter plot for each mouse. aP < 0.05 compared to PBS treated control mice (unpaired t-test).
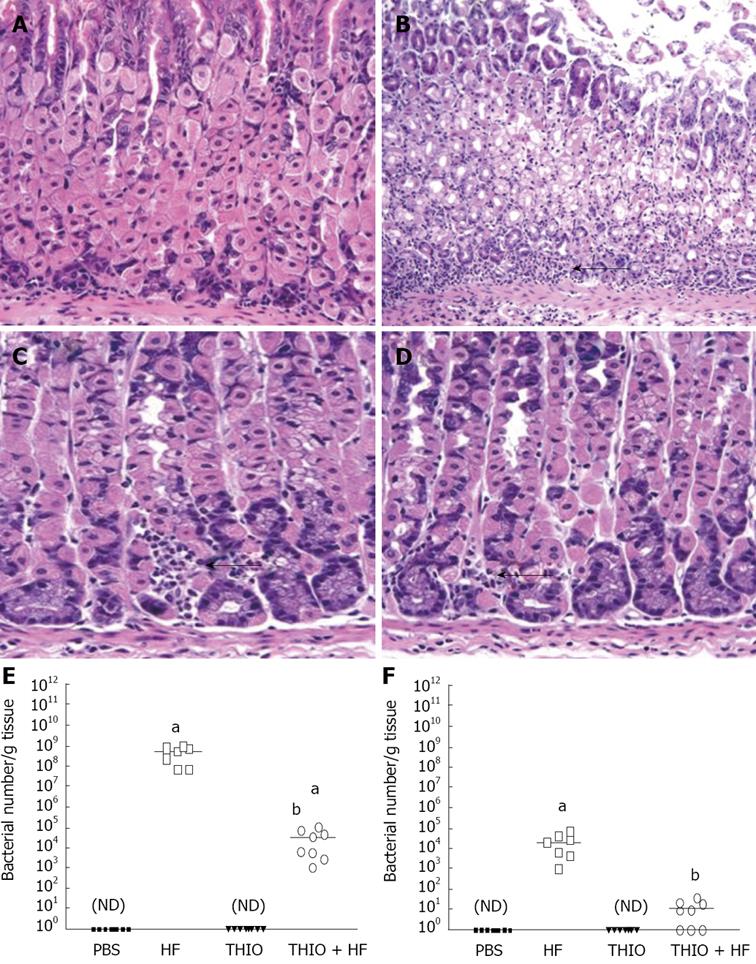
Figure 2 Thioperamide prevention of Helicobacter felis gastritis is mediated by blockade of the H3 receptor.
H&E stains of (A) PBS, (B) H. felis (HF), (C) thioperamide (THIO) and (D) THIO plus HF treated mice (magnification 400 ×). Quantification by qRT-PCR of the amount of H. felis colonizing PBS, HF, THIO and THIO plus HF treated mice. Quantitative RT-PCR was performed on RNA isolated from (E) fundic and (F) antral gastric tissue. The log fluorescent emission measured continuously during PCR per cycle was determined. Early amplification showed increased ‘starting’ fluorescent emission and was used to compute the number of Helicobacter/g tissue for each mouse using a standard curve generated from known quantities of H. felis. Scatter plots showing the bacterial count for each mouse is shown. The mean indicated by a horizontal bar for n = 8 mice. aP < 0.05 vs PBS mice; bP < 0.05 vs H. felis mice (unpaired -test); ND: non-detectable.
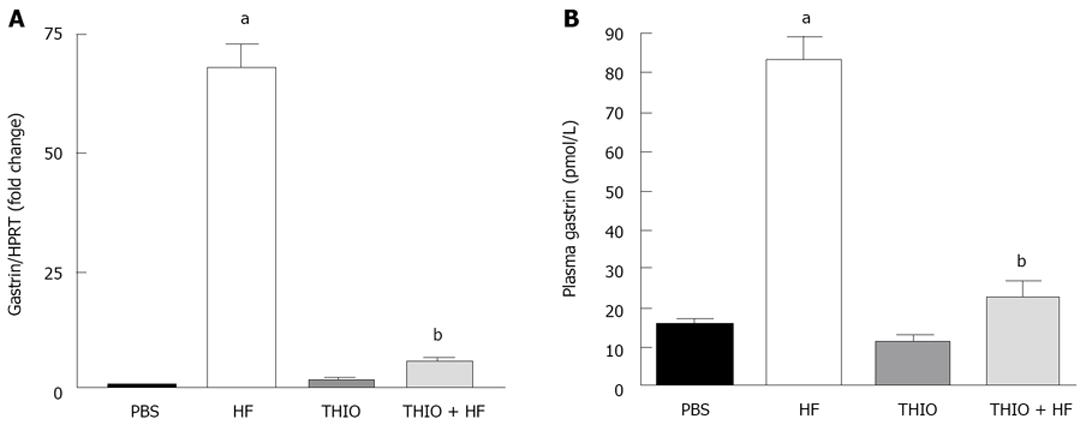
Figure 3 Hypergastrinemia induced by Helicobacter felis infection is resolved with thioperamide treatment.
A: Quantitative RT-PCR was performed on RNA isolated from the antral mucosa. Shown is the ratio of gastrin to HPRT mRNA in PBS, H. felis (HF), thioperamide (THIO) and THIO plus HF treated mice; B: Changes in plasma gastrin were determined by radioimmunoassay. Data are the mean + SEM for n = 8 mice; aP < 0.05 vs PBS control mice; bP < 0.05 vs THIO treated mice.
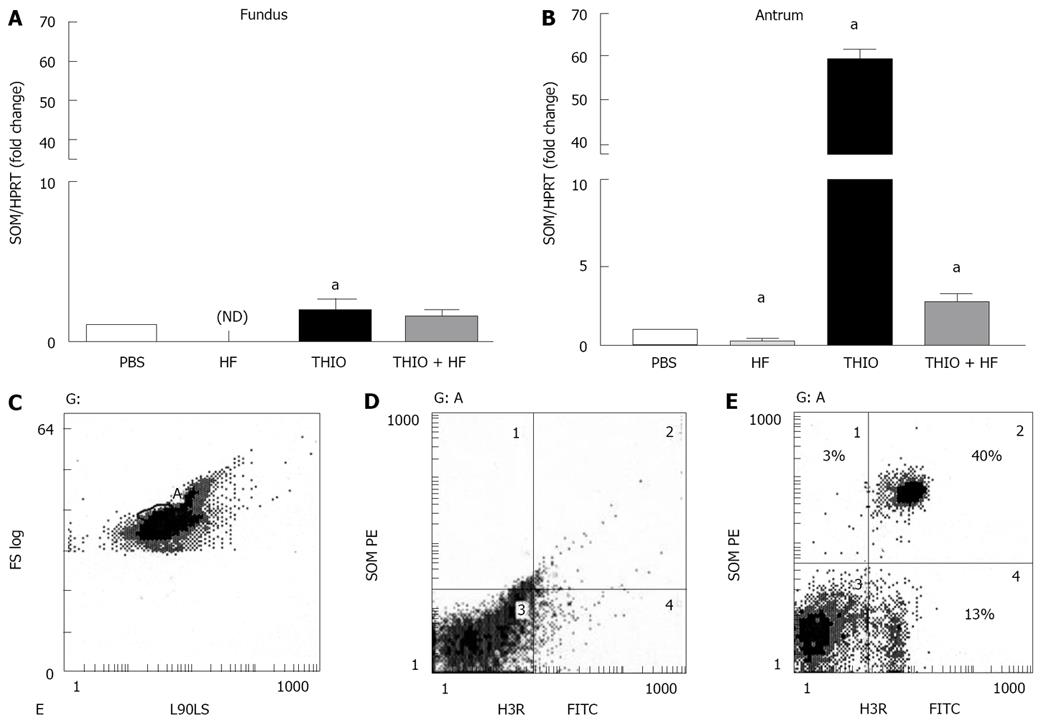
Figure 4 Differential expression of somatostatin mRNA in fundic and antral tissue with thioperamide treatment.
Quantitative RT-PCR was performed on RNA isolated from the (A) fundic and (B) antral mucosa. Shown is the ratio of somatostatin to HPRT mRNA in PBS, H. felis (HF), thioperamide (THIO) and THIO plus HF treated mice. Data are the mean + SEM for n = 8 mice, aP < 0.05 vs PBS control mice. Identification of H3 receptor on canine D-cells by flow cytometry. D-cells expressing H3 receptors (H3R, FITC) were identified as dual-labeled somatostatin (SOM)-PE and FITC-H3 receptor positive cells. Shown is (C) double-parameter histogram showing forward light scatter (cell size, FS LOG) and right-angle light scatter (cell shape, L90LS), gated cell population (region A) (D) isotype controls and (E) percent of isolated canine fundic D-cells expressing H3 receptors (H3R) (region 2), D-cells not expressing H3R (region 1) and H3R cells not expressing somatostatin (region 3). Results shown are representative of n = 2 canine cell preparations.
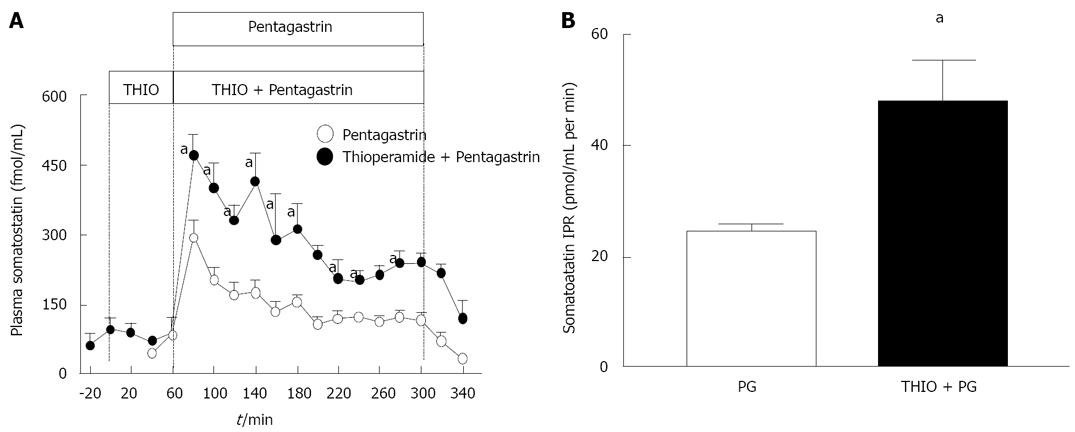
Figure 5 Suppression of somatostatin with chronic infusion of pentagastrin in the sheep model.
A: Infusion of pentagastrin for 4 h in the sheep stimulates the release of somatostatin followed by a gradual decrease in concentration. The stimulatory effect of pentagastrin on somatostatin is greater with thioperamide infusion; B: Somatostatin integrated plasma response (IPR, pmol/mL per minute) showing a significant increase in pentagastrin stimulated somatostatin with thioperamide treatment. PG: pentagastrin; THIO: thioperamide. Data shown as mean + SEM, aP < 0.05 versus PG, n = 6 for PG infusion, n = 3 for THIO + PG infusion. The IPR was calculated as the area under the somatostatin time curve as follows: IPR = DS0 - DS1× (t1 - t2) + …. DSn-DSn-1× (tn - tn-1); DS: plasma somatostatin-basal somatostatin concentrations; t: time of infusion; Subscripts 0, 1, 2…n: times at which samples were collected.
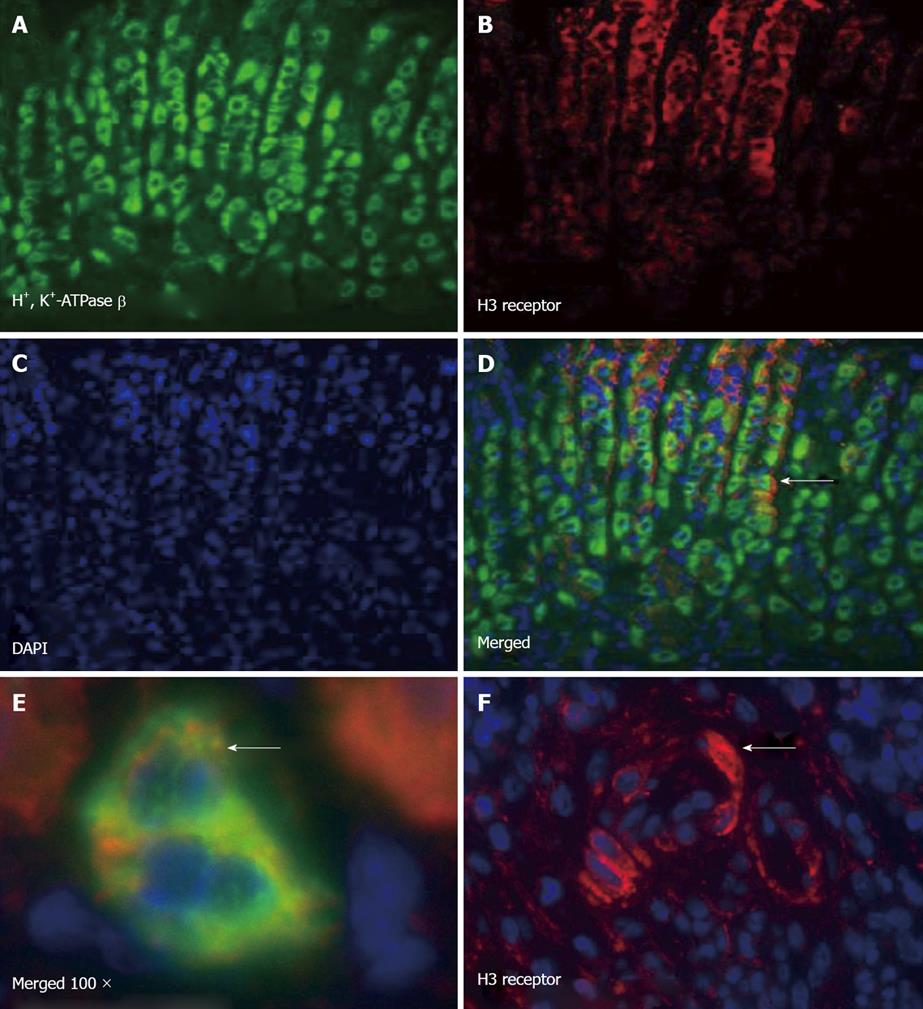
Figure 6 H3 receptor expression of mouse parietal and immune cells.
Immunofluorescence of paraffin sections of mouse stomach stained with (A) H+, K+-ATPase β subunit (FITC), (B) H3 receptor (Texas red), (C) DAPI, and (D) merged image showing colocalization; E: High power image showing parietal cells expressing the H3 receptor; F: H3 receptor expressing cells within the inflammatory infiltrate in H. felis infected mice.
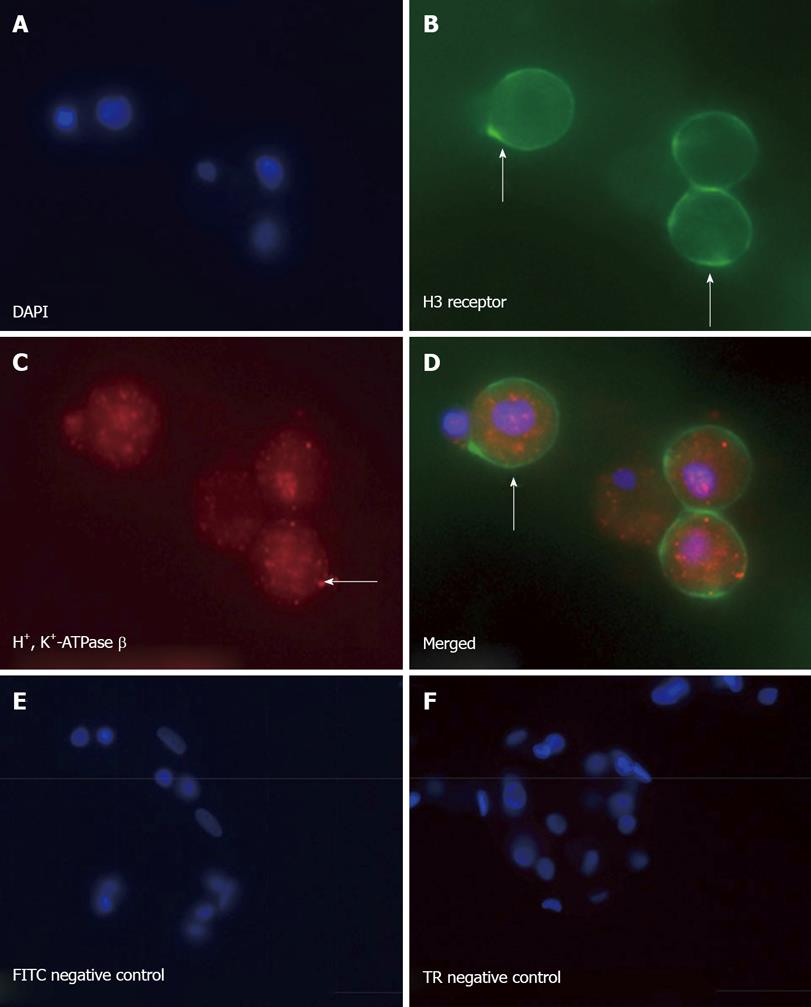
Figure 7 Primary canine parietal cells express the H3 receptor.
Immunofluorescence of isolated parietal cells stained with (A) 4', 6-Diamidino-2-Phenylindole
(DAPI), (B) H3 receptor (FITC), (C) H+, K+-ATPase b subunit (Texas red), and (D) merged image showing colocalization of the H3 receptor on the parietal cell. Negative IgG controls for (E) FITC and (F) Texas red (TR) secondary antibodies are shown.
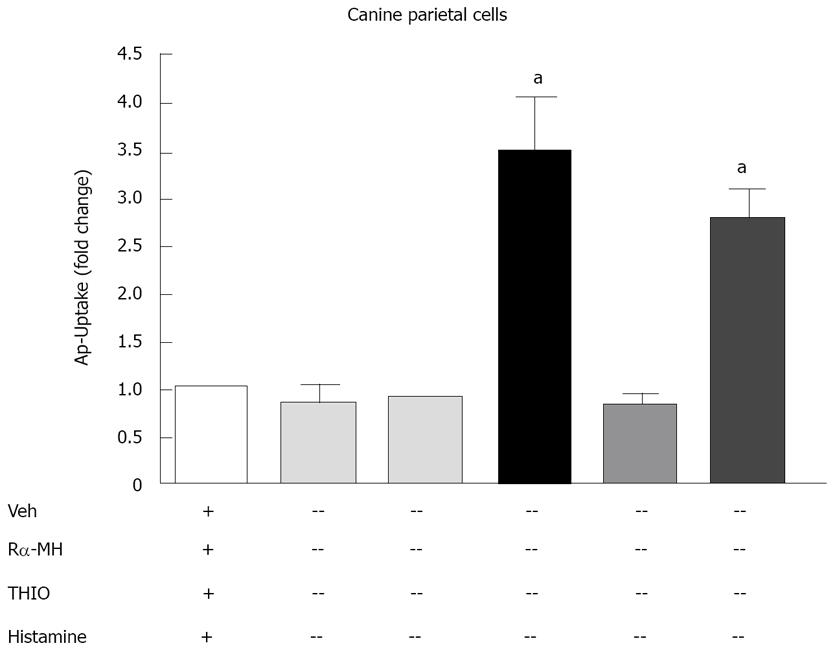
Figure 8 Acid production from canine parietal cells in response to H3 receptor agonist and antagonist.
Aminopyrine (AP)-uptake in response to vehicle (Veh), H3 receptor agonist R alpha methylhistamine (RαMH), H3 receptor antagonist (thioperamide, THIO) and histamine was performed. The data are expressed as the mean fold induction over Veh treated cells + SEM, n = 3 experiments, aP < 0.05 vs Veh.
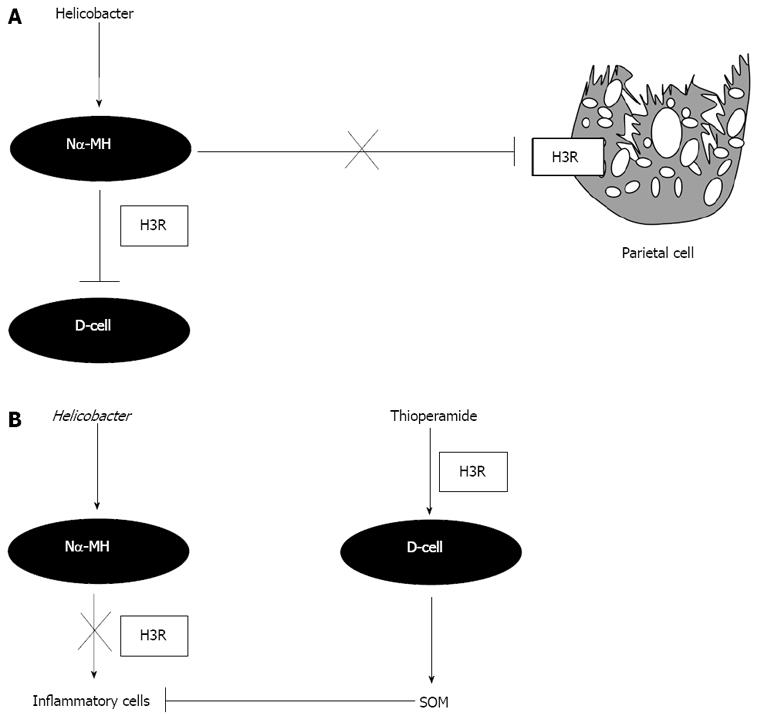
Figure 9 Proposed role for the H3R in gastric function during Helicobacter infection.
A: H3Rs localized on parietal cells and D-cells supports a direct inhibitory effect of the H. pylori metabolite Nα-MH on acid and somatostatin secretion respectively during infection; B: The stimulatory effect of thioperamide on somatostatin expression and secretion regulates the host immune response during H. pylori infection; H3R: histamine 3 receptor; SOM: somatostatin.
-
Citation: Zavros Y, Mesiwala N, Waghray M, Todisco A, Shulkes A, Merchant JL. Histamine 3 receptor activation mediates inhibition of acid secretion during
Helicobacter -induced gastritis. World J Gastrointest Pathophysiol 2010; 1(5): 154-165 - URL: https://www.wjgnet.com/2150-5330/full/v1/i5/154.htm
- DOI: https://dx.doi.org/10.4291/wjgp.v1.i5.154


