Copyright
©2010 Baishideng Publishing Group Co.
World J Gastrointest Pathophysiol. Dec 15, 2010; 1(5): 154-165
Published online Dec 15, 2010. doi: 10.4291/wjgp.v1.i5.154
Published online Dec 15, 2010. doi: 10.4291/wjgp.v1.i5.154
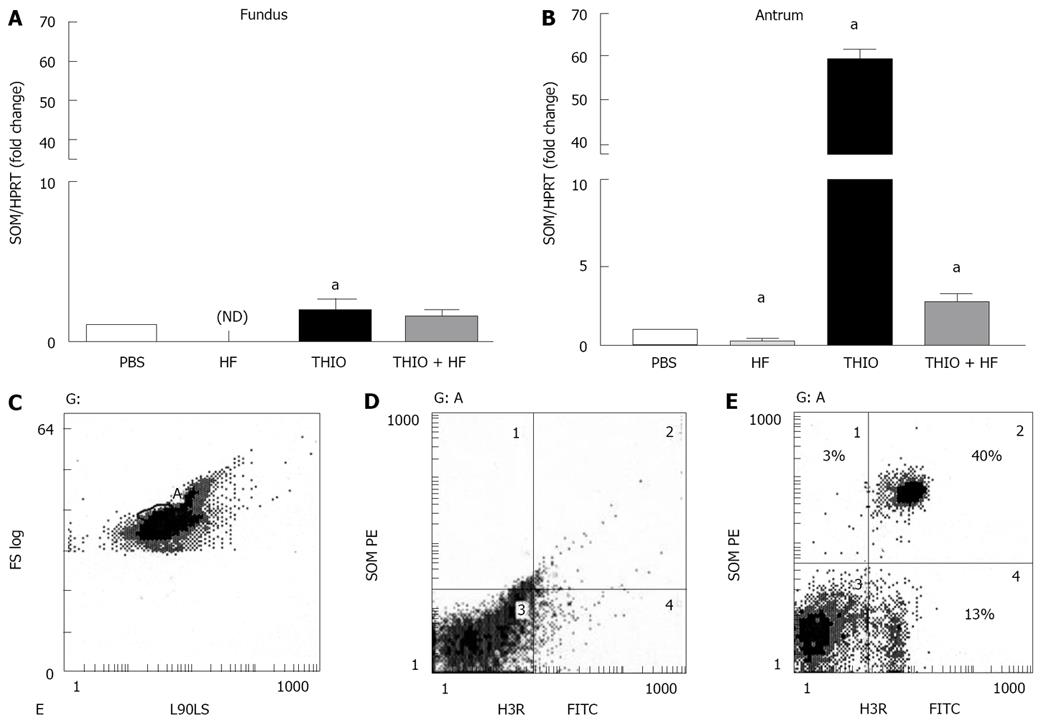
Figure 4 Differential expression of somatostatin mRNA in fundic and antral tissue with thioperamide treatment.
Quantitative RT-PCR was performed on RNA isolated from the (A) fundic and (B) antral mucosa. Shown is the ratio of somatostatin to HPRT mRNA in PBS, H. felis (HF), thioperamide (THIO) and THIO plus HF treated mice. Data are the mean + SEM for n = 8 mice, aP < 0.05 vs PBS control mice. Identification of H3 receptor on canine D-cells by flow cytometry. D-cells expressing H3 receptors (H3R, FITC) were identified as dual-labeled somatostatin (SOM)-PE and FITC-H3 receptor positive cells. Shown is (C) double-parameter histogram showing forward light scatter (cell size, FS LOG) and right-angle light scatter (cell shape, L90LS), gated cell population (region A) (D) isotype controls and (E) percent of isolated canine fundic D-cells expressing H3 receptors (H3R) (region 2), D-cells not expressing H3R (region 1) and H3R cells not expressing somatostatin (region 3). Results shown are representative of n = 2 canine cell preparations.
-
Citation: Zavros Y, Mesiwala N, Waghray M, Todisco A, Shulkes A, Merchant JL. Histamine 3 receptor activation mediates inhibition of acid secretion during
Helicobacter -induced gastritis. World J Gastrointest Pathophysiol 2010; 1(5): 154-165 - URL: https://www.wjgnet.com/2150-5330/full/v1/i5/154.htm
- DOI: https://dx.doi.org/10.4291/wjgp.v1.i5.154


