Published online Jul 28, 2015. doi: 10.4329/wjr.v7.i7.170
Peer-review started: December 2, 2014
First decision: February 7, 2015
Revised: March 30, 2015
Accepted: June 4, 2015
Article in press: June 8, 2015
Published online: July 28, 2015
Various imaging modalities are available for the diagnosis, staging and response evaluation of patients with renal cell carcinoma (RCC). While contrast enhanced computed tomography (CT) is used as the standard of imaging for size, morphological evaluation and response assessment in RCC, a new functional imaging technique like perfusion CT (pCT), goes down to the molecular level and provides new perspectives in imaging of RCC. pCT depicts regional tumor perfusion and vascular permeability which are indirect parameters of tumor angiogenesis and thereby provides vital information regarding tumor microenvironment. Also response evaluation using pCT may predate the size criteria used in Response Evaluation Criteria in Solid Tumors, as changes in the perfusion occurs earlier following tissue kinase inhibitors before any actual change in size. This may potentially help in predicting prognosis, better selection of therapy and more accurate and better response evaluation in patients with RCC. This article describes the techniques and role of pCT in staging and response assessment in patients with RCCs.
Core tip: Perfusion computed tomography is a functional imaging technique. It can be used to predict the histologic grade and early as well as more accurate response evaluation in renal cell carcinoma (RCC). This has the potential to help in better selection of therapy and improve prognosis in RCC.
- Citation: Das CJ, Thingujam U, Panda A, Sharma S, Gupta AK. Perfusion computed tomography in renal cell carcinoma. World J Radiol 2015; 7(7): 170-179
- URL: https://www.wjgnet.com/1949-8470/full/v7/i7/170.htm
- DOI: https://dx.doi.org/10.4329/wjr.v7.i7.170
Renal cell carcinoma (RCC) is the most common primary tumor of the kidney. Hypervascularity is an important feature of primary RCC as well as its metastases. Angiogenesis plays an important role in the growth of the primary tumor and the spread of distant metastases.
Depending on the histologic type and the stage of tumors, the treatment options vary from surgery to chemotherapy. With the advent of new anti-angiogenic agents acting at a molecular level, the treatment of RCC has undergone a paradigm shift. These drugs include sorafenib, sunitinib, pazopanib, and axitinib that target key growth factors like the vascular endothelial growth factor and tyrosine kinase, monoclonal antibody (e.g., bevacizumab), and mammalian target of rapamycin inhibitors (e.g., temsirolimus and everolimus).
The evaluation of the treatment response in patients on these drugs is a challenge. Because of their cytostatic nature, most of these agents produce no significant change in the size of tumor as compared to earlier agents which were cytotoxic. Thus traditional response evaluation based only on size will not be accurate in predicting actual response.
Hence there is a need for tumor evaluation with new functional imaging techniques like perfusion computed tomography (pCT) and dynamic contrast enhanced magnetic resonance imaging. These make feasible grading of the tumor, prognosticating and targeted therapy. These are predicted based on certain perfusion parameters, namely blood flow (BF), blood volume (BV), mean transit time (MTT) and permeability (PMB) which shall be dealt in detail in the subsequent paragraphs. Also different histologic types of tumors have been shown to have different perfusion parameters which will have an impact on the prognosis[1].
pCT is based on the temporal changes in tissue attenuation after intravenous administration of iodinated contrast media. Tissue iodine concentration determines enhancement and is an indirect reflection of tissue vascularity and vascular physiology[2,3]. Two phases are seen in tissue enhancement based on the contrast dynamics and contrast distribution in the intravascular and extravascular compartment[2]. Initial phase contrast enhancement is due to intravascular space distribution and lasts for approximately 40 to 60 s[2-4]. Contrast extravasation from the intravascular to the extravascular compartment across the capillary basement membrane marks the onset of the second phase.
BF and BV determine the first phase, whereas vascular PMB to the contrast media is the main determining factor during the second phase[2]. In pCT, images are taken in quick succession in the region of interest during these two phases. A tissue attenuation curve is plotted after recording the temporal changes in tissue attenuation. Quantification of tissue perfusion is done by applying proper mathematical modeling[2].
pCT protocol consists of a baseline image acquisition without contrast enhancement. Dynamic acquisition performed sequentially after intravenous injection of contrast media follows subsequently[2].
An unenhanced CT scan of the upper abdomen covering the kidneys is initially performed to locate the renal lesion. It also acts as a localizer to further select the region of interest in the contrast-enhanced dynamic imaging phase. Larger coverage (8-16 cm) is currently obtained with the use of newer scanners having increased rows of detectors[2].
Images are acquired every 3 to 5 s (Table 1) in the initial cine phase for a total of approximately 40 to 60 s during the first-pass study[2-4]. For obtaining PMB measurements, a second phase lasting from 2 to 10 min is supplemented after the first-pass study[2,3]. The second phase images are acquired every 10 to 20 s[2].
| No. of scans | Cycle time (s) | Accumulated time since start of scan (s) |
| 3 | 3 | 9 |
| 9 | 1.5 | 22.5 |
| 5 | 3 | 37.5 |
| 5 | 6 | 68.0 |
| 22 (in total) | Examination time: 68 |
In the pCT study, a predefined scan volume (80 mm for shuttle axial technique and 40 mm for cine technique) in the Z-axis is selected to cover the lesion[5]. For lesions smaller than 20 mm, cine technique is useful. One hundred milliliters of non-ionic iodinated contrast is administered intravenously for the pCT study maintaining a flow rate of 5 mL/s followed by 40 mL of normal saline flush at the same flow rate[5].
In cine mode acquisition, 8 contiguous sections, collimated to 5 mm, with temporal resolution of 1 s by are obtained without table movement using the following parameters: 100 Kv, 80 mAs, rotation time 0.5 s, and scan field of view of 50 cm[5]. Whereas in shuttle-mode acquisition, 8 contiguous sections, collimated to 5 mm, with temporal resolution of 2.8 s are obtained with table movement (21 passes) and using following parameters: 100 Kv, 80 mAs, rotation time 0.4 s, and scan field of view of 50 cm[5]. In order to include both first-pass enhancement and delayed phase, the total duration of scan is approximately 60 s. After pCT scans, a conventional contrast enhanced CT of the abdomen and thorax is performed immediately. Excretory phase CT urography may be obtained after 5 to 10 min after the contrast media injection whenever required[5].
Post processing is done to correct for the motion artifacts and the data are analyzed at a work station. The slice showing the maximal transverse tumor diameter is chosen for further analysis. An arterial input is defined by putting a circular region-of-interest (ROI) over the abdominal aorta at the level of the renal vessels. Similarly, ROIs are also placed manually (covering 1 cm2) over the renal tumor and the normal renal cortex of the affected kidney or the contralateral kidney. Tumor ROI is placed in solid enhancing area avoiding necrosis, calcification, hemorrhage and cysts.
A tissue time attenuation curve is generated using in-built software. Perfusion parameters (BV, BF, MTT, PMB, MIP) are also calculated. The perfusion parameters are obtained and their definitions have been enumerated in Table 2.
| Perfusion parameters | Definition | Unit | Biomarker |
| Regional blood flow | Blood flow per unit volume or mass of tissue | mL/100 mL per minute | Tumour vascularization |
| Regional tumour blood volume | Ratio of blood volume to tumour volume | mL/100 mL | Tumour vascularization |
| Permeability/blood flow extraction (PMB/PS/k-trans) | Rate of transfer of contrast agent from the intravascular to the extravascular compartment | mL/100 gm per minute | Vascular immaturity |
| Mean transit time | Average time taken to travel from artery to vein | s | Perfusion pressure |
| Time to peak | Time from arrival of the contrast in major arterial vessels to thepeak enhancement | s | Perfusion pressure |
| Maximum peak intensity | Maximum increase in tissue density after contrast injection | HU | Tissue blood volume |
Differentiation between the different tumor types on the basis of qualitative interpretation of contrast enhancement patterns may be possible but quantitative methods of measuring enhancement provides a higher degree of accuracy[6]. Quantitative method is associated with less subjective variability. ROI-based method of assessing enhancement has demonstrated high accuracy in differentiating clear cell RCC (ccRCC) from papillary RCC (pRCC)[6]. Limitations of ROI-based methods include invariability in ROI placement amongst different observers, difficulty in selecting the exact location of ROI and technical problems such as misregistration between pre- and post-contrast acquisitions[6].
Therefore, to overcome the limitations of ROI placement, a tool that can perform automatic registration, lesion segmentation, and whole-lesion (WL) enhancement analysis is needed. Furthermore, histogram distribution has been used to discriminate ccRCC from pRCC using analysis of the WL enhancement pattern[6]. Whole lesion parameter of third quartile enhancement has been found to have the highest accuracy (area under curve 0.98), with sensitivity of 96% and specificity of 90%[6]. Special software is used to obtain a histogram of the voxel-based enhancement values and computation of the mean, median, and third quartile enhancement of the sorted values done. Histogram distribution parameters like kurtosis and skewness off-line are subsequently obtained from the values computed[6].
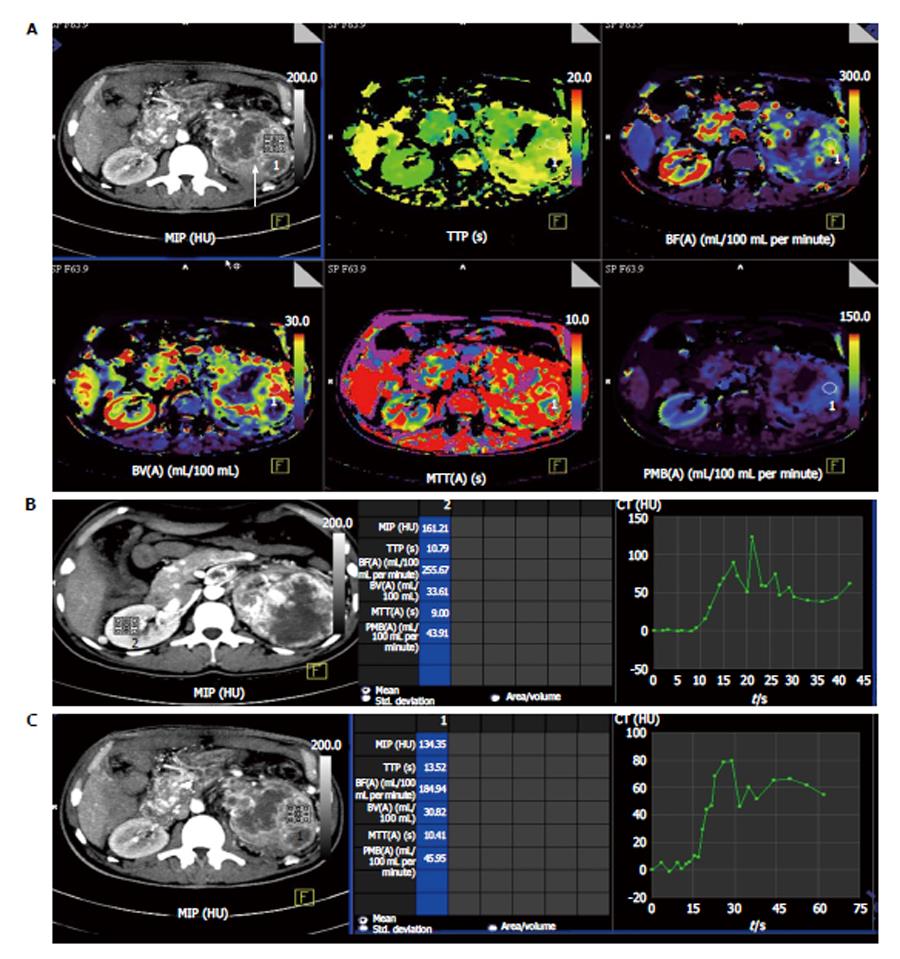
Chen et al[7] have reported CT perfusion values for normal renal cortex; the average BF was reported to be 454.32 mL/100 mL per minute (Figure 1). Difference between BF, BV, MTT, and PMB of normal renal cortex and RCC are shown in Table 3. Perfusion parameters in two representative cases are shown in Table 4.
| Normal renal cortex (mean ± SD) | Renal cell carcinoma (mean ± SD) | t value | P value | |
| Blood flow (mL/min per 100 g) | 454.32 ± 110.90 | 261.96 ± 175.86 | -7.620 | 0.000 |
| Blood volume (mL/100 g) | 23.53 ± 5.71 | 17.17 ± 8.34 | -5.193 | 0.000 |
| Mean transit time (s) | 3.62 ± 1.38 | 7.08 ± 3.42 | 7.670 | 0.000 |
| Permeability (mL/min per 100 g) | 63.95 ± 18.85 | 25.07 ± 13.20 | -14.193 | 0.000 |
| Date of study | MIP (HU) | TTP (s) | BF (mL/100 mL per minute) | BV (mL/100 mL) | MTT (s) | PMB (mL/100 mL per minute) | ||
| Case 1 | 2013-4-2 | Normal cortex | 120 | 11.1 | 202.9 | 31.6 | 8.7 | 47.1 |
| Renal tumour | 134 | 13.5 | 184.9 | 30.8 | 10.4 | 45.95 | ||
| 2013-9-11 | Normal cortex | 121 | 13.2 | 209 | 30.2 | 9.2 | 50.2 | |
| Renal tumour | 79 | 11.5 | 174 | 13.2 | 5 | 18.1 | ||
| 2013-11-20 | Normal cortex | 130 | 10.8 | 229 | 32 | 9.6 | 45.3 | |
| Renal tumour | 42 | 12.3 | 5.7 | 1.2 | 12.4 | 8.2 | ||
| Case 2 | 2013-10-23 | Normal cortex | 157 | 11.9 | 236 | 27.8 | 8.9 | 43.7 |
| Renal tumour | 88 | 12.3 | 64.4 | 9.3 | 8.9 | 18.7 | ||
| 2013-12-26 | Normal cortex | 140 | 15.2 | 170.9 | 29.5 | 10.5 | 42.1 | |
| Renal tumour | 82.7 | 14.8 | 60.9 | 7.9 | 8.4 | 13.8 | ||
| 2013-8-3 | Normal cortex | 216 | 12.5 | 315 | 38 | 72 | 55.2 | |
| Renal tumour | 84.6 | 12.3 | 72.3 | 8 | 7.4 | 10.8 |
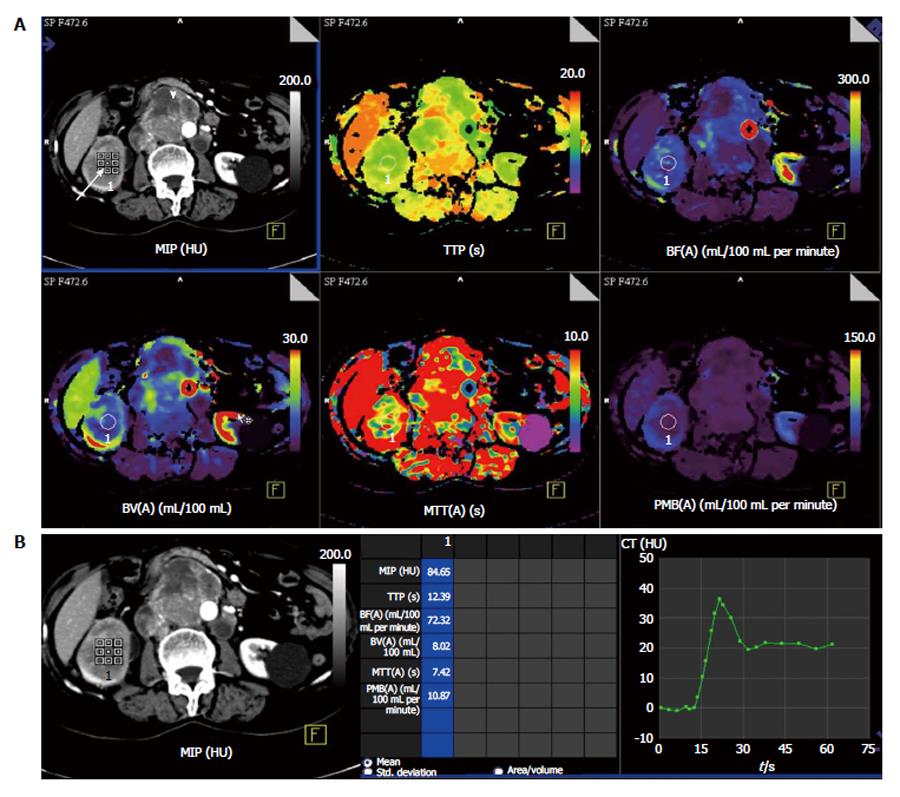
Predicting the histologic grade: Pre-operative tumor histotyping using perfusion parameters can be used to prognosticate patients and is important in patients with small renal tumors. Chen et al[7] found that mean values of BF, BV were significantly higher and mean MTT was significantly lower in ccRCC than in pRCC (P < 0.05 (Figures 1 and 2).
Similarly Gigli et al[1] have shown a correlation between tumor histological subtype and perfusion index. Significant differences in perfusion values were found in ccRCC of different Fuhrman grades. High perfusion index corresponded with high microvessel density (MVD) while those with lower MVD showed lower perfusion indices.
Previous studies have shown that there was a significant difference in PS and MTT values of malignant lesions (ccRCCs, pRCCs, and chromophobe RCCs) and the normal renal cortex (P < 0.001 and P = 0.029, respectively) but BF and BV values did not differ significantly[8,9]. Also the permeability surface area product, MTT, and BF values were reported to be significantly lower in malignant lesions as compared with oncocytomas[8].
BF and BV are two perfusion parameters which have been found to have significant histological correlation (P < 0.01) with MVD as a prognostic marker for RCCs and the neoangiogenesis associated with RCCs[8]. The difference in normal cortex and tumoral PS values has been found to best predict RCCs with a cutoff greater than 2.5 mL/100 g per minute having sensitivity, specificity, and accuracy of 100%, 66.67%, and 95.92%[5]. Hence, evaluation of the different perfusion parameters can depict histologic grade of RCCs.
Response evaluation with anti-angiogenic therapy: Predicting response assessment with anti-angiogenic therapy can be done with pCT (e.g., colorectal)[10]. It is known that growth of primary tumor as well as seeding of distant metastasis in patients with renal tumors requires angiogenesis. By inhibiting angiogenesis, it is possible to target both the primary tumor as well as metastases.
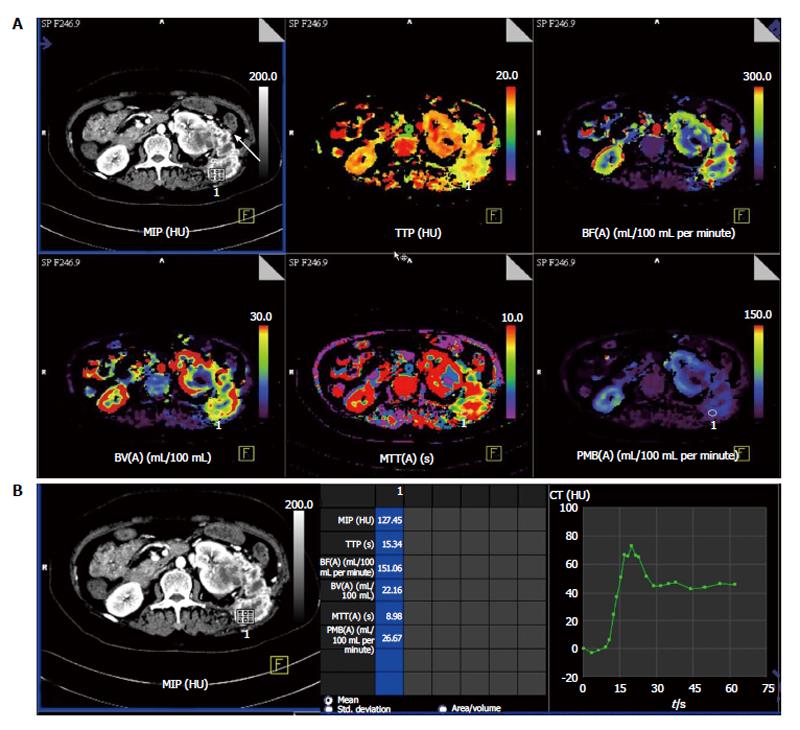
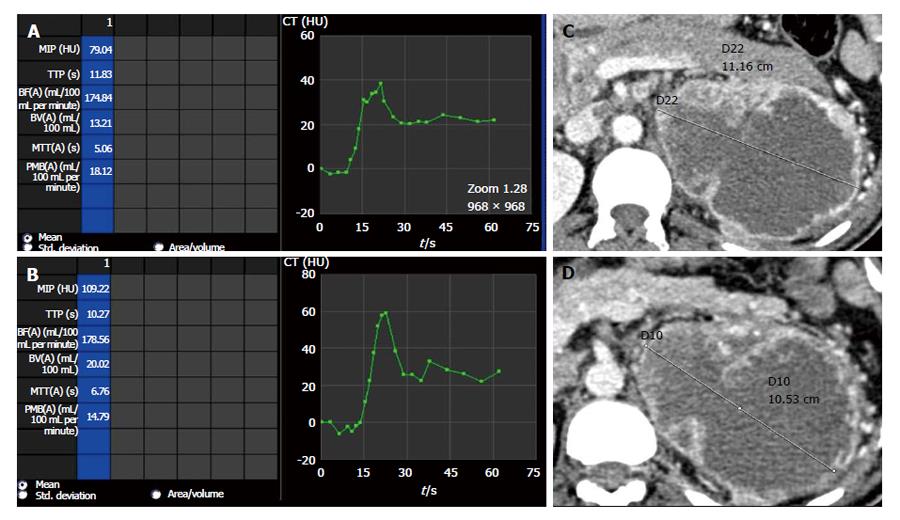
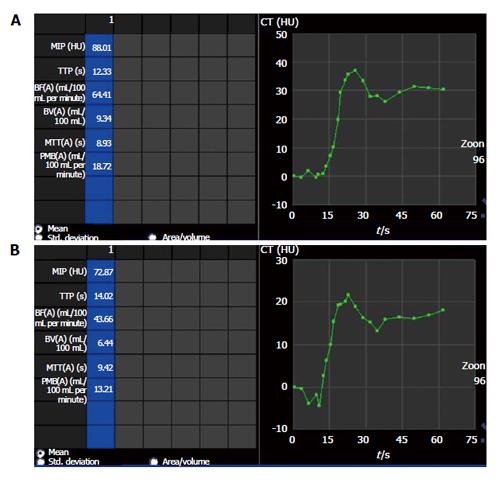
The role of several antiangiogenic therapies in RCC are currently being evaluated in clinical trials[11-14]. However, these anti-angiogenic therapies are predominantly cytostatic in action rather than cytotoxic and induce disease stabilization rather than tumor regression (Figures 3-5). Thereby, traditional response assessment based on size criteria by using the Response Evaluation Criteria in Solid Tumors (RECIST) is rendered inadequate for follow-up and prognostication of patients on anti-angiogenic therapy. In such instances, functional evaluation with pCT can play a major role. There are few studies highlighting the role of pCT for assessing effect of antiangiogenesis[15-17].
Significant differences in pCT parameters have been described between treated tumors and control tumors in a rat model by Kan et al[16]. There was significant difference in these parameters after interventional therapy as compared with the pre-therapy in an investigation in a rabbit model[17].
Maksimovic et al[18] in their study using tyrosine kinase inhibitor sorafenib found that perfusion parameters changes appear much earlier before changes in size during therapy. Also early disease progression identification seen as new areas of tumour perfusion would enable clinicians to change therapy. A targeted biopsy and therapy by identification of the specific area at an early stage can be performed[19].
Perfusion parameters can also be utilized to prognosticate response to therapy. Patients responding to antiangiogenic therapy had higher baseline values of BF and BV than in those patients whose perfusion parameters remained stable throughout follow-up[20].
Significant decrease in BF, BV and PMB can be seen in those patients responding to antiangiogenic therapy (case 1 in Table 4) (Figures 3 and 4) while those showing progression showed increase in these perfusion parameters over serial follow-up (case 2 in Table 4) (Figure 5).
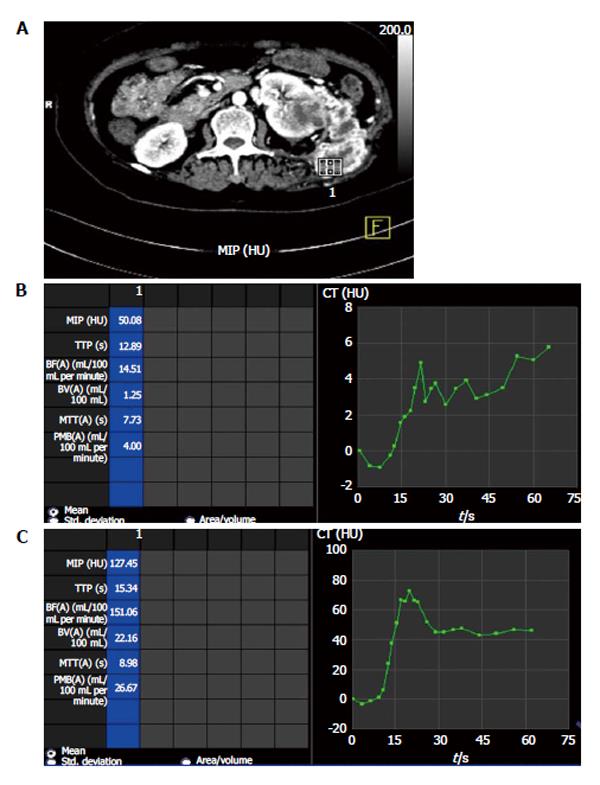
Evaluation of metastases: Metastases are commonly seen in RCCs. Most are hematogenous and are highly vascular. Amongst the different histologic subtypes, ccRCCs have the highest risk of developing metastatic disease and is seen in more than 90% of cases[21]. Since maximum anatomic coverage during pCT is limited, hence evaluation of distant metastasis is challenging considering the increasing radiation burden with increase in the region covered. However, evaluation of RCC metastases is made possible in most cases because of the characteristic distribution of these metastases in lung bases, liver, adrenal glands, pancreas, retroperitoneal lymph nodes (Figure 2) and lumbar fossa (Figure 6)[22]. The renal metastases show similar contrast enhancement as the parent tumor and may be evaluated for treatment response by using pCT.
As true for any imaging technique, pCT also has certain technical limitations. These include high radiation burden as shown in Table 5 because of the repetitive scans acquired over a period of time and limited anatomic coverage. As the scan has to be repeated within a short span of time, the actual anatomic length that can be covered is limited (maximum up to about 20 cm). This imposes a limitation on the evaluation of distant metastases which may be present in such patients.
| Dynamic acquisition | Chest and abdomenscan (routine) | |
| Exposure time (s) | 33 | 14.24 |
| Scan length (mm) | 155 | 655 |
| Collimation (mm) | 1.2 | 0.6 |
| KVp | 100 | 100 |
| Ma | 523 | 211 |
| CTDI vol (mGy) | 180.1 | 7.2 |
| DLP (mGycm) | 2789.69 | 458.68 |
pCT is an evolving imaging modality which provides deeper insights into the molecular behavior of tumor angiogenesis and thereby facilitating targeted therapy. It has revolutionized oncologic imaging by prognosticating and evaluating therapy response at an earlier stage. Other potential benefits include identifying tumor histological subtype and predicting potentially aggressive tumors which can help clinicians to better plan the therapy of patients. As an emerging technique, pCT is currently used in evaluation of malignancies of different body parts such as kidneys, brain, lung, liver, pancreas and colon. In the future, pCT is likely to become the in vivo biomarker for tumor behavior and response evaluation in malignant lesions of different body parts.
P- Reviewer: Cerwenka HR, Chen F, Nouh MR S- Editor: Tian YL L- Editor: A E- Editor: Liu SQ
| 1. | Gigli F, Zattoni F, Zamboni G, Valotto C, Bernardin L, Mucelli RP, Zattoni F. [Correlation between pathologic features and perfusion CT of renal cancer: a feasibility study]. Urologia. 2010;77:223-231. [PubMed] [Cited in This Article: ] |
| 2. | Miles KA. Tumour angiogenesis and its relation to contrast enhancement on computed tomography: a review. Eur J Radiol. 1999;30:198-205. [PubMed] [DOI] [Cited in This Article: ] [Cited by in Crossref: 220] [Cited by in F6Publishing: 230] [Article Influence: 9.2] [Reference Citation Analysis (0)] |
| 3. | Miles KA, Griffiths MR. Perfusion CT: a worthwhile enhancement? Br J Radiol. 2003;76:220-231. [PubMed] [DOI] [Cited in This Article: ] [Cited by in Crossref: 311] [Cited by in F6Publishing: 336] [Article Influence: 16.0] [Reference Citation Analysis (0)] |
| 4. | Miles KA. Functional CT imaging in oncology. Eur Radiol. 2003;13 Suppl 5:M134-M138. [PubMed] [DOI] [Cited in This Article: ] [Cited by in Crossref: 101] [Cited by in F6Publishing: 111] [Article Influence: 5.0] [Reference Citation Analysis (0)] |
| 5. | Mazzei FG, Mazzei MA, Cioffi Squitieri N, Pozzessere C, Righi L, Cirigliano A, Guerrini S, D’Elia D, Ambrosio MR, Barone A. CT perfusion in the characterisation of renal lesions: an added value to multiphasic CT. Biomed Res Int. 2014;2014:135013. [PubMed] [DOI] [Cited in This Article: ] [Cited by in Crossref: 13] [Cited by in F6Publishing: 23] [Article Influence: 2.3] [Reference Citation Analysis (0)] |
| 6. | Chandarana H, Rosenkrantz AB, Mussi TC, Kim S, Ahmad AA, Raj SD, McMenamy J, Melamed J, Babb JS, Kiefer B. Histogram analysis of whole-lesion enhancement in differentiating clear cell from papillary subtype of renal cell cancer. Radiology. 2012;265:790-798. [PubMed] [DOI] [Cited in This Article: ] [Cited by in Crossref: 82] [Cited by in F6Publishing: 85] [Article Influence: 7.7] [Reference Citation Analysis (0)] |
| 7. | Chen Y, Zhang J, Dai J, Feng X, Lu H, Zhou C. Angiogenesis of renal cell carcinoma: perfusion CT findings. Abdom Imaging. 2010;35:622-628. [PubMed] [DOI] [Cited in This Article: ] [Cited by in Crossref: 63] [Cited by in F6Publishing: 63] [Article Influence: 4.5] [Reference Citation Analysis (0)] |
| 8. | Chen C, Liu Q, Hao Q, Xu B, Ma C, Zhang H, Shen Q, Lu J. Study of 320-slice dynamic volume CT perfusion in different pathologic types of kidney tumor: preliminary results. PLoS One. 2014;9:e85522. [PubMed] [DOI] [Cited in This Article: ] [Cited by in Crossref: 20] [Cited by in F6Publishing: 22] [Article Influence: 2.2] [Reference Citation Analysis (0)] |
| 9. | Reiner CS, Roessle M, Thiesler T, Eberli D, Klotz E, Frauenfelder T, Sulser T, Moch H, Alkadhi H. Computed tomography perfusion imaging of renal cell carcinoma: systematic comparison with histopathological angiogenic and prognostic markers. Invest Radiol. 2013;48:183-191. [PubMed] [DOI] [Cited in This Article: ] [Cited by in Crossref: 52] [Cited by in F6Publishing: 54] [Article Influence: 4.9] [Reference Citation Analysis (0)] |
| 10. | Sahani DV, Kalva SP, Hamberg LM, Hahn PF, Willett CG, Saini S, Mueller PR, Lee TY. Assessing tumor perfusion and treatment response in rectal cancer with multisection CT: initial observations. Radiology. 2005;234:785-792. [PubMed] [DOI] [Cited in This Article: ] [Cited by in Crossref: 227] [Cited by in F6Publishing: 214] [Article Influence: 11.3] [Reference Citation Analysis (0)] |
| 11. | Dhanabal M, Ramchandran R, Volk R, Stillman IE, Lombardo M, Iruela-Arispe ML, Simons M, Sukhatme VP. Endostatin: yeast production, mutants, and antitumor effect in renal cell carcinoma. Cancer Res. 1999;59:189-197. [PubMed] [Cited in This Article: ] |
| 12. | Morita T, Shinohara N, Tokue A. Antitumour effect of a synthetic analogue of fumagillin on murine renal carcinoma. Br J Urol. 1994;74:416-421. [PubMed] [DOI] [Cited in This Article: ] [Cited by in Crossref: 27] [Cited by in F6Publishing: 29] [Article Influence: 1.0] [Reference Citation Analysis (0)] |
| 13. | Fujioka T, Hasegawa M, Ogiu K, Matsushita Y, Sato M, Kubo T. Antitumor effects of angiogenesis inhibitor 0-(chloroacetyl-carbamoyl) fumagillol (TNP-470) against murine renal cell carcinoma. J Urol. 1996;155:1775-1778. [PubMed] [DOI] [Cited in This Article: ] [Cited by in Crossref: 25] [Cited by in F6Publishing: 26] [Article Influence: 0.9] [Reference Citation Analysis (0)] |
| 14. | Stadler WM, Kuzel T, Shapiro C, Sosman J, Clark J, Vogelzang NJ. Multi-institutional study of the angiogenesis inhibitor TNP-470 in metastatic renal carcinoma. J Clin Oncol. 1999;17:2541-2545. [PubMed] [Cited in This Article: ] |
| 15. | Koukourakis MI, Mavanis I, Kouklakis G, Pitiakoudis M, Minopoulos G, Manolas C, Simopoulos C. Early antivascular effects of bevacizumab anti-VEGF monoclonal antibody on colorectal carcinomas assessed with functional CT imaging. Am J Clin Oncol. 2007;30:315-318. [PubMed] [DOI] [Cited in This Article: ] [Cited by in Crossref: 44] [Cited by in F6Publishing: 49] [Article Influence: 2.9] [Reference Citation Analysis (0)] |
| 16. | Kan Z, Phongkitkarun S, Kobayashi S, Tang Y, Ellis LM, Lee TY, Charnsangavej C. Functional CT for quantifying tumor perfusion in antiangiogenic therapy in a rat model. Radiology. 2005;237:151-158. [PubMed] [DOI] [Cited in This Article: ] [Cited by in Crossref: 92] [Cited by in F6Publishing: 104] [Article Influence: 5.5] [Reference Citation Analysis (0)] |
| 17. | Zhang J, Wang R, Lou H, Zou Y, Zhang M. Functional computed tomographic quantification of angiogenesis in rabbit VX2 soft-tissue tumor before and after interventional therapy. J Comput Assist Tomogr. 2008;32:697-705. [PubMed] [DOI] [Cited in This Article: ] [Cited by in Crossref: 12] [Cited by in F6Publishing: 14] [Article Influence: 0.9] [Reference Citation Analysis (0)] |
| 18. | Maksimovic O, Schraml C, Hartmann JT, Bitzer M, Claussen CD, Pintoffl J, Horger M. Evaluation of response in malignant tumors treated with the multitargeted tyrosine kinase inhibitor sorafenib: a multitechnique imaging assessment. AJR Am J Roentgenol. 2010;194:5-14. [PubMed] [DOI] [Cited in This Article: ] [Cited by in Crossref: 23] [Cited by in F6Publishing: 29] [Article Influence: 2.1] [Reference Citation Analysis (0)] |
| 19. | Sabir A, Schor-Bardach R, Wilcox CJ, Rahmanuddin S, Atkins MB, Kruskal JB, Signoretti S, Raptopoulos VD, Goldberg SN. Perfusion MDCT enables early detection of therapeutic response to antiangiogenic therapy. AJR Am J Roentgenol. 2008;191:133-139. [PubMed] [DOI] [Cited in This Article: ] [Cited by in Crossref: 56] [Cited by in F6Publishing: 60] [Article Influence: 3.8] [Reference Citation Analysis (0)] |
| 20. | Fournier LS, Oudard S, Thiam R, Trinquart L, Banu E, Medioni J, Balvay D, Chatellier G, Frija G, Cuenod CA. Metastatic renal carcinoma: evaluation of antiangiogenic therapy with dynamic contrast-enhanced CT. Radiology. 2010;256:511-518. [PubMed] [DOI] [Cited in This Article: ] [Cited by in Crossref: 113] [Cited by in F6Publishing: 116] [Article Influence: 8.3] [Reference Citation Analysis (0)] |
| 21. | Motzer RJ, Bacik J, Mariani T, Russo P, Mazumdar M, Reuter V. Treatment outcome and survival associated with metastatic renal cell carcinoma of non-clear-cell histology. J Clin Oncol. 2002;20:2376-2381. [PubMed] [DOI] [Cited in This Article: ] [Cited by in Crossref: 383] [Cited by in F6Publishing: 364] [Article Influence: 16.5] [Reference Citation Analysis (0)] |
| 22. | Bianchi M, Sun M, Jeldres C, Shariat SF, Trinh QD, Briganti A, Tian Z, Schmitges J, Graefen M, Perrotte P. Distribution of metastatic sites in renal cell carcinoma: a population-based analysis. Ann Oncol. 2012;23:973-980. [PubMed] [DOI] [Cited in This Article: ] [Cited by in Crossref: 361] [Cited by in F6Publishing: 426] [Article Influence: 32.8] [Reference Citation Analysis (0)] |


