Copyright
©The Author(s) 2017.
World J Radiol. Oct 28, 2017; 9(10): 371-388
Published online Oct 28, 2017. doi: 10.4329/wjr.v9.i10.371
Published online Oct 28, 2017. doi: 10.4329/wjr.v9.i10.371
Figure 1 SUIT atlas (top) and template (bottom) showing the central cerebellar slice in the sagittal, coronal and axial planes.
The atlas does not explicitly identify white matter apart from the dentate nuclei (from Ref. [55]).
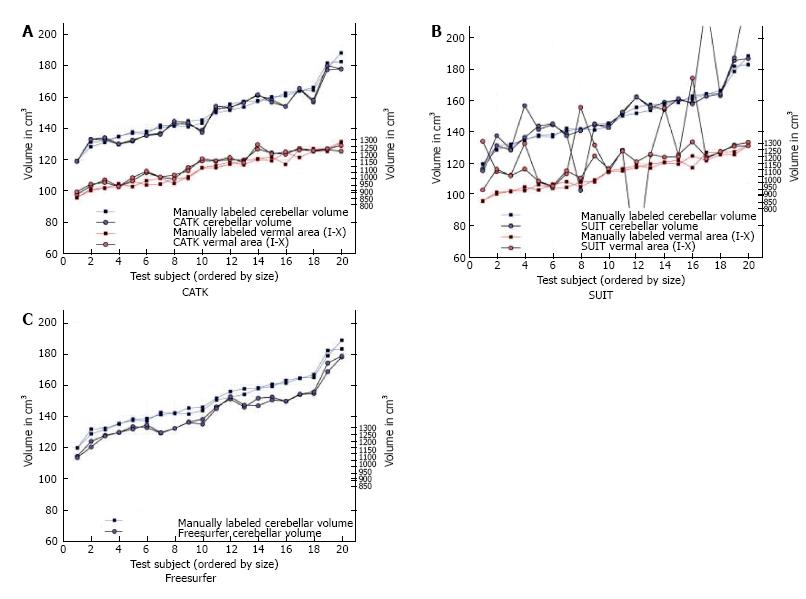
Figure 2 Comparative plots of total cerebellar volumes and combined vermal areas are shown against manually labeled examples, in 20 subjects with (A) CATK, (B) SUIT and (C) Freesurfer.
Both test and retest are plotted, illustrating the repeatability of each method (from Ref. [55]).
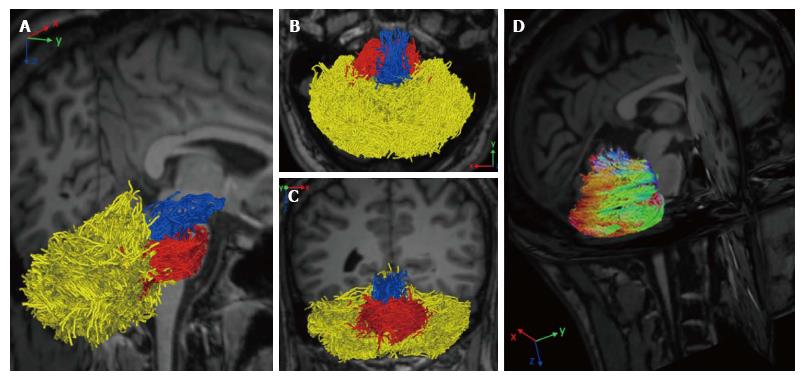
Figure 3 Reconstruction of cerebellar white matter tracts using constrained spherical deconvolution.
Sagittal rotated view (A), superior axial view (B), and coronal view (C) show each fiber bundle manually colored: Superior cerebellar peduncle (blue), middle cerebellar peduncle (red), and hemispheric cerebellar tracts (yellow). The tridimensional sagittal rotated view shows color-coded cerebellar hemispheric streamlines according to the principal eigenvector’s direction (with permission of Springer, from Ref. [63]).
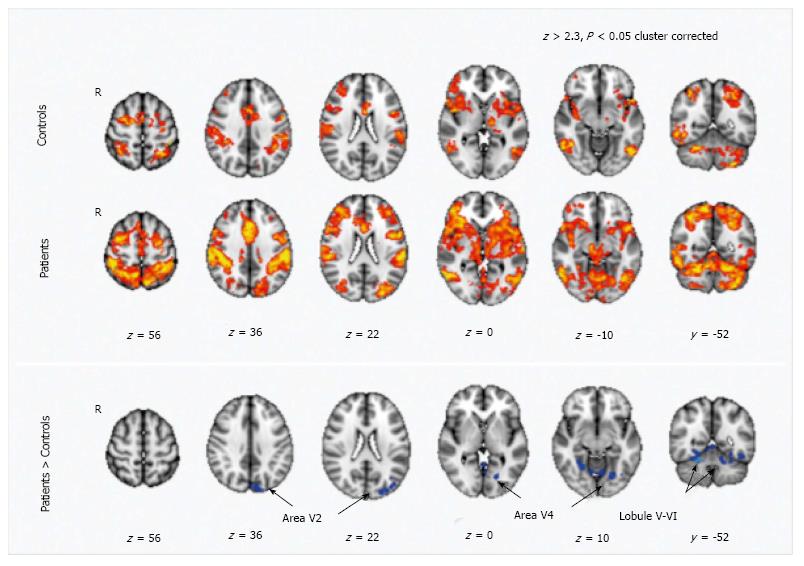
Figure 4 Motor training-dependent functional magnetic resonance imaging signal changes in healthy volunteers and in MS patients.
Maps of training-related functional magnetic resonance imaging signal changes are reported in healthy volunteers (indicated as controls) and in patients (Z > 2.3, P < 0.05, cluster corrected). Comparison between patients and controls show a higher signal reduction in the patients in regions corresponding to the secondary visual areas (V2 and V4) and in the cerebellum (lobule V-VI) (from Ref. [100]). V5: Visual cortex; R5: Right hemisphere; fMRI: Functional magnetic resonance imaging.
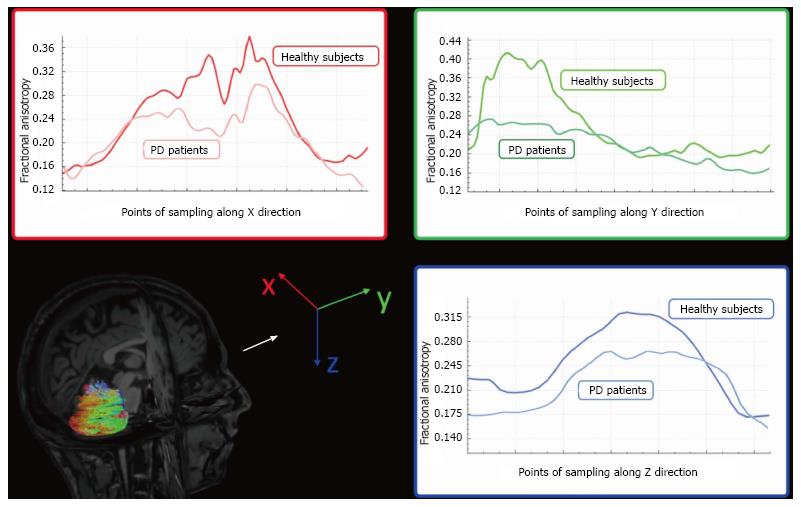
Figure 5 Graphic representations of Fractional Anisotropy mean decrement along X (red), Y (green), and Z (blue) direction samplings of Parkinson’s disease patients compared to healthy subjects.
Colors follow principal eigenvector’s directions (with permission of Springer, from Ref. [63]). PD: Parkinson’s disease.
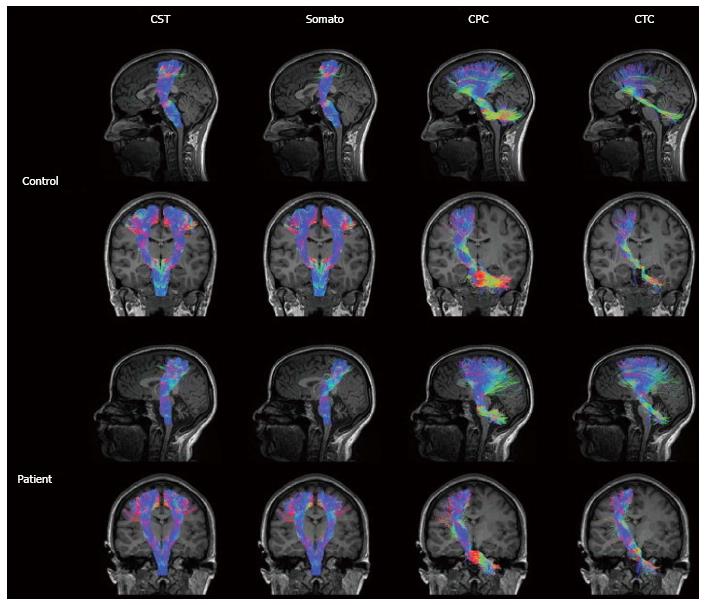
Figure 6 Somatosensory motor tracts in a representative control and ataxia telangiectasia (A-T) subject (age 23).
Control tracts are displayed in the first and second rows comprising the left sagittal (first row) tracts, left and right coronal (second row) corticospinal (CST) and somatosensory tracts, and left coronal (second row) cortico-ponto-cerebellar (CPC) and cerebellar-thalamo-cortical (CTC) tracts. Patient tracts are displayed in the third and fourth rows comprising the left sagittal (third row) tracts, left and right coronal (fourth row) CST and somatosensory tracts, and left coronal (fourth row) CPC and CTC tracts. Tract colors are based on the direction of water diffusion (Blue: Ascending-descending diffusion; Red: Left-right diffusion; Green: Anterior-posterior diffusion). Compared to motor pathways in age matched controls, A-T CST and somatosensory pathways display a morphological thinning of tracts at the level of the thalamus in the coronal view. In addition, A-T CPC and CTC pathways display morphological thinning of tracts in the cerebellum at the position of the medial cerebellar peduncles (from Ref. [147]).
Figure 7 Significant cerebellar GM and WM loss in Alzheimer’s disease.
A: Significant cerebellar GM loss in Alzheimer’s disease (green) and dementia with Lewy bodies (red) relative to healthy older subjects; B: Significant cerebellar WM loss in AD relative to healthy older subjects; C and D: Whole brain maps depicting significant regions of GM (C) and WM (D) loss between groups. Results superimposed on a MRI T1 brain template image (L = left, R = right). AD: Alzheimer’s disease; DLB: Dementia with Lewy bodies (from Ref. [154]). GM: Gray matter; WM: White matter.
- Citation: Mormina E, Petracca M, Bommarito G, Piaggio N, Cocozza S, Inglese M. Cerebellum and neurodegenerative diseases: Beyond conventional magnetic resonance imaging. World J Radiol 2017; 9(10): 371-388
- URL: https://www.wjgnet.com/1949-8470/full/v9/i10/371.htm
- DOI: https://dx.doi.org/10.4329/wjr.v9.i10.371


