Copyright
©The Author(s) 2017.
World J Radiol. Oct 28, 2017; 9(10): 371-388
Published online Oct 28, 2017. doi: 10.4329/wjr.v9.i10.371
Published online Oct 28, 2017. doi: 10.4329/wjr.v9.i10.371
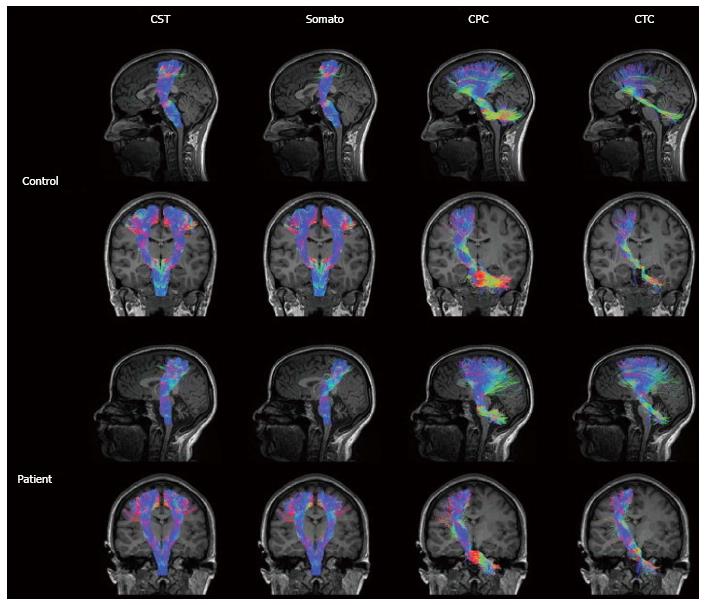
Figure 6 Somatosensory motor tracts in a representative control and ataxia telangiectasia (A-T) subject (age 23).
Control tracts are displayed in the first and second rows comprising the left sagittal (first row) tracts, left and right coronal (second row) corticospinal (CST) and somatosensory tracts, and left coronal (second row) cortico-ponto-cerebellar (CPC) and cerebellar-thalamo-cortical (CTC) tracts. Patient tracts are displayed in the third and fourth rows comprising the left sagittal (third row) tracts, left and right coronal (fourth row) CST and somatosensory tracts, and left coronal (fourth row) CPC and CTC tracts. Tract colors are based on the direction of water diffusion (Blue: Ascending-descending diffusion; Red: Left-right diffusion; Green: Anterior-posterior diffusion). Compared to motor pathways in age matched controls, A-T CST and somatosensory pathways display a morphological thinning of tracts at the level of the thalamus in the coronal view. In addition, A-T CPC and CTC pathways display morphological thinning of tracts in the cerebellum at the position of the medial cerebellar peduncles (from Ref. [147]).
- Citation: Mormina E, Petracca M, Bommarito G, Piaggio N, Cocozza S, Inglese M. Cerebellum and neurodegenerative diseases: Beyond conventional magnetic resonance imaging. World J Radiol 2017; 9(10): 371-388
- URL: https://www.wjgnet.com/1949-8470/full/v9/i10/371.htm
- DOI: https://dx.doi.org/10.4329/wjr.v9.i10.371


