Copyright
©The Author(s) 2016.
World J Radiol. Mar 28, 2016; 8(3): 298-307
Published online Mar 28, 2016. doi: 10.4329/wjr.v8.i3.298
Published online Mar 28, 2016. doi: 10.4329/wjr.v8.i3.298
Figure 1 A localizer was performed to verify the position of the kidneys relative to the transducer.
Coronal T2-weighted (T2-W) magnetic resonance images show the result of added T2-W treatment planning sequence, which was transferred to the high intensity focused ultrasound software (left and center). The right plot shows the temperature rise during ablation in the renal parenchyma. The red temperature curve represents the maximum temperature measured at the point of focus, while the green curve represents the average temperature in the region of interest.
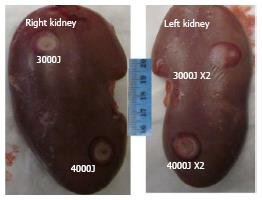
Figure 2 Macroscopic dorsal lesions in the right (single sonication) and left (double sonication) kidney are shown after high intensity focused ultrasound.
Note the doughnut-shape hemorrhage (dark red) is surrounding coagulation necrosis (pale). Double sonication at 4400J produced larger lesions compared with the others.
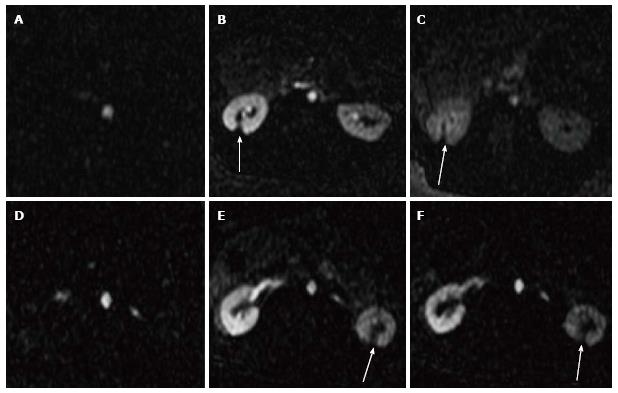
Figure 3 Selected 2D perfusion magnetic resonance images acquired from two representative animals.
The images show the arrival of Gd-DTPA bolus (A, D) in the aorta and 20-120 s (B, E and C, F) in the kidneys. Arrows denote the hypoperfused ablated lesions.
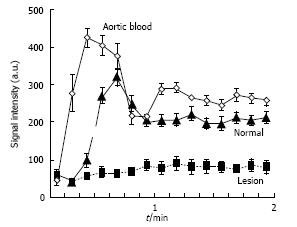
Figure 4 2D magnetic resonance perfusion demonstrates severely hypoperfused ablated lesions after magnetic resonance-guided high intensity focused ultrasound compared to remote non-ablated tissue.
Diamond: Aortic blood; Triangle: Viable renal tissue; Square: Ablated lesion. a.u.: Arbitrary units.
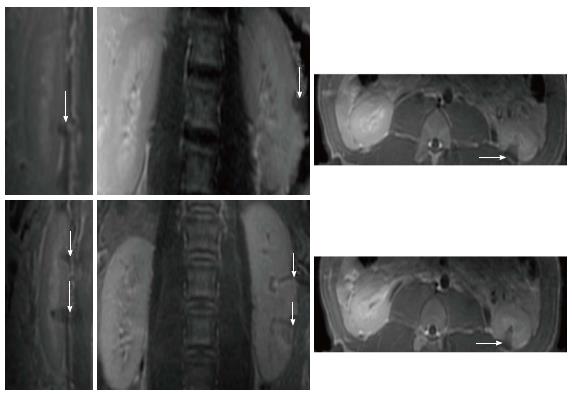
Figure 5 Renal lesions on three magnetic resonance imaging views acquired 3 h after sonication using single 4400J (top row, animal 1) and double 4400J (bottom row, animal 2).
The wedge-shape hypoenhanced lesions are seen on contrast enhanced T1-weighted fast spin echo images in sagittal (left images), coronal (center images) and axial (right images) views.
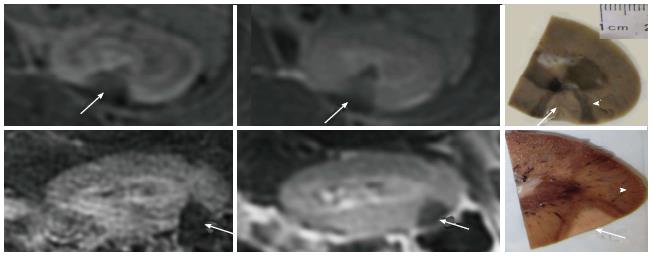
Figure 6 The wedge-shape lesions on contrast enhanced liver acquisitions with volume acquisition (left) and T1-weighted fast spin echo (center) images and gold-standard macroscopic slices (white arrows) from 2 animals (top and bottom rows).
Note the close correspondence of ablated lesions in situ and in vitro. Coagulation necrosis (white arrows) is surrounded by hemorrhagic zone (arrowheads) as shown macroscopically.
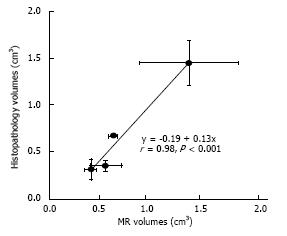
Figure 7 A close correlation was found between in situ magnetic resonance imaging and postmortem renal ablation volumes.
The bars in the x- and y-axes represent the standard error of the means. The ablated volumes after single sonication at 3000J and 4400J were not significantly different, while volumes at double sonications were significantly larger on both 4400J than 3000J. Furthermore, the effect of double sonications at 4400J was significantly larger than the other energies.
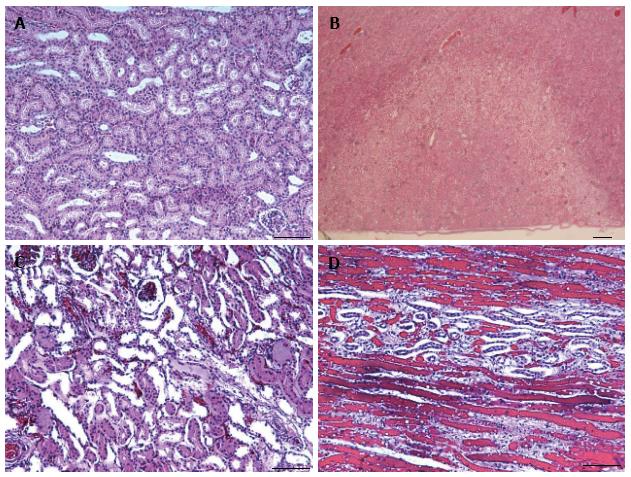
Figure 8 Microscopic sections (hematoxylin-eosin) of a normal renal tissue (A, × 40), the territory of both ablated (pale) and normal renal tissue (B, × 10) and ablated lesion (C, × 40) with damaged nephrons in a haphazard array and hemorrhage (D, × 100).
Note the close agreement in the triangular infarct territory on microscopy and microscopy lesions in Figure 6 and magnetic resonance imaging in Figure 6. There was no evidence of peri-renal tissue injury (B).
- Citation: Saeed M, Krug R, Do L, Hetts SW, Wilson MW. Renal ablation using magnetic resonance-guided high intensity focused ultrasound: Magnetic resonance imaging and histopathology assessment. World J Radiol 2016; 8(3): 298-307
- URL: https://www.wjgnet.com/1949-8470/full/v8/i3/298.htm
- DOI: https://dx.doi.org/10.4329/wjr.v8.i3.298


