Copyright
©2012 Baishideng Publishing Group Co.
World J Radiol. Jul 28, 2012; 4(7): 291-301
Published online Jul 28, 2012. doi: 10.4329/wjr.v4.i7.291
Published online Jul 28, 2012. doi: 10.4329/wjr.v4.i7.291
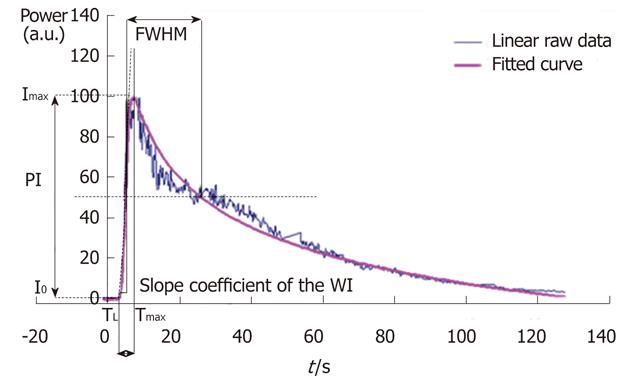
Figure 1 Graph displaying an example of a time intensity curve with four of its seven associated microvascularization parameters: the peak intensity, the time to peak intensity, the slope coefficient of the wash-in and the full width at half maximum.
The three other microvascularization parameters extracted from the time intensity curve are the area under the curve, the area under the wash-in and the area under the wash-out. WI: Wash-in; FWHM: The full width at half maximum; PI: The peak intensity; Imax: Maximal intensity value; I0; Initial intensity value; TL is the latency time and is defined as the time at the intersection between y = I0 and the tangent at Tmax/2 where Tmax is the time associated with Imax.
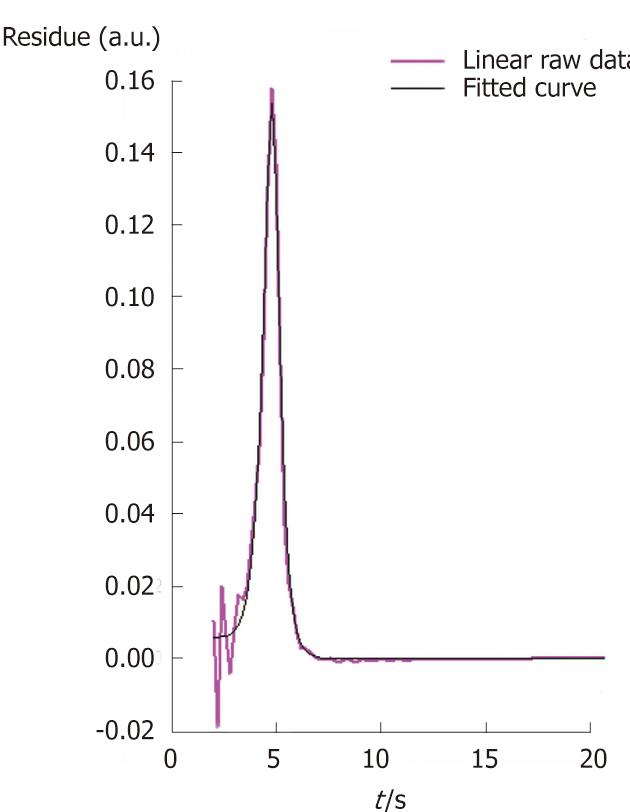
Figure 2 Graph displaying an example of a residue function.
From this curve, three quantitative microvascularization parameters are graphically extracted: Blood flow corresponds to the maximum value reached by the residue function, blood volume is defined as the area under the curve and the mean transit time is defined as the ratio between blood volume and blood flow.
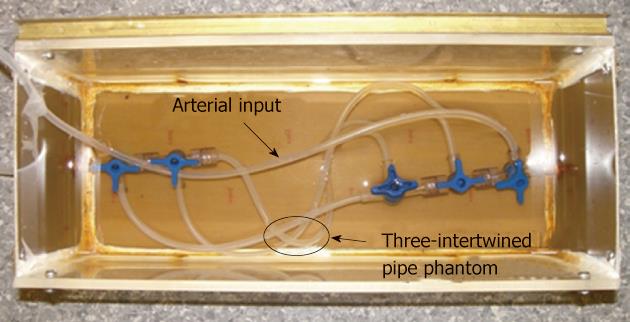
Figure 3 Three-intertwined silicone pipe phantom and its feeding pipe simulating the heterogeneous structure of a tumor and one of its arterial inputs.
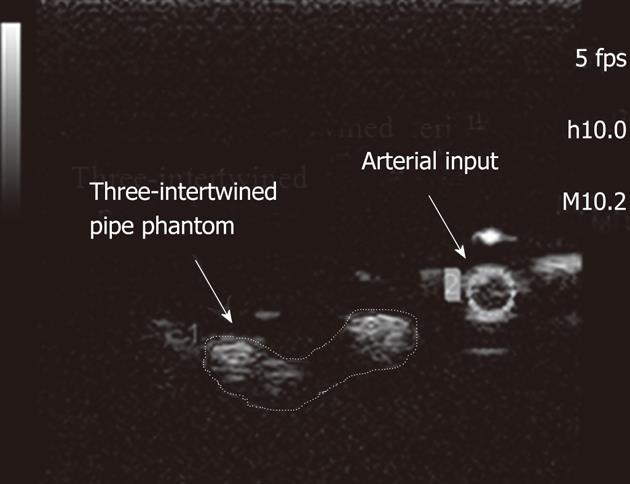
Figure 4 Pulse inversion image of the three-intertwined pipe phantom.
The figure displays the selection of the region of interests associated with the phantom and its feeding pipe. fps: Frames per second.
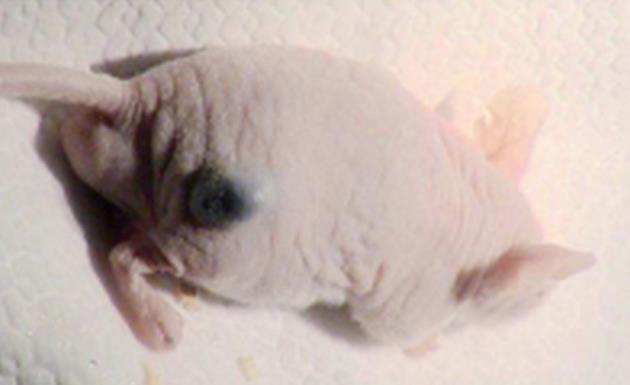
Figure 5 In vivo experiments were conducted on xenografted B16F10 female nude mice.
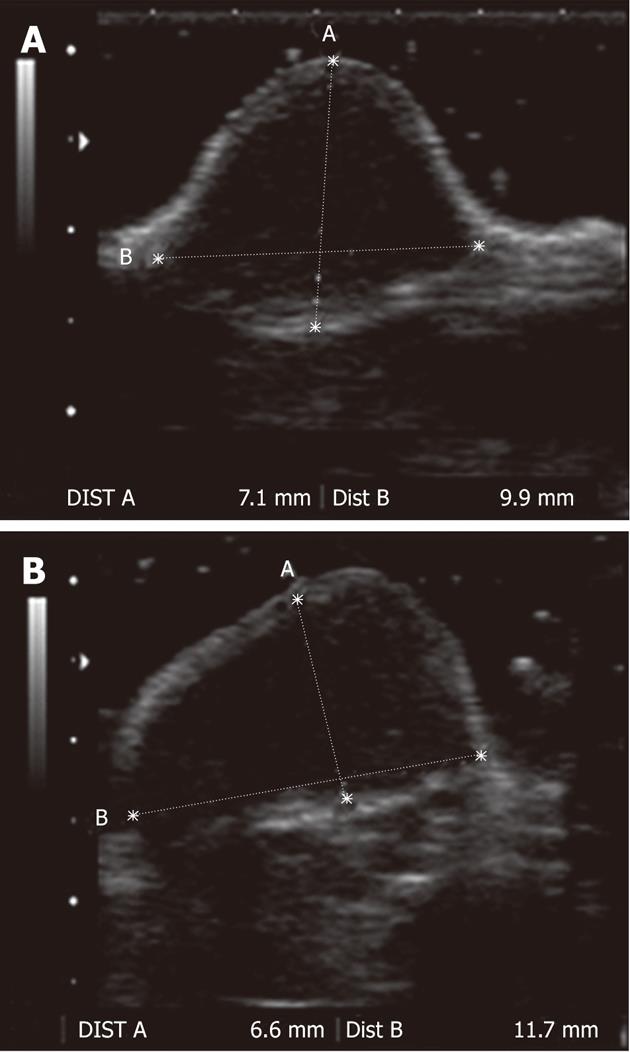
Figure 6 Volume evaluation was performed for each mouse using transversal (A) and longitudinal (B) B-mode images of the tumor.
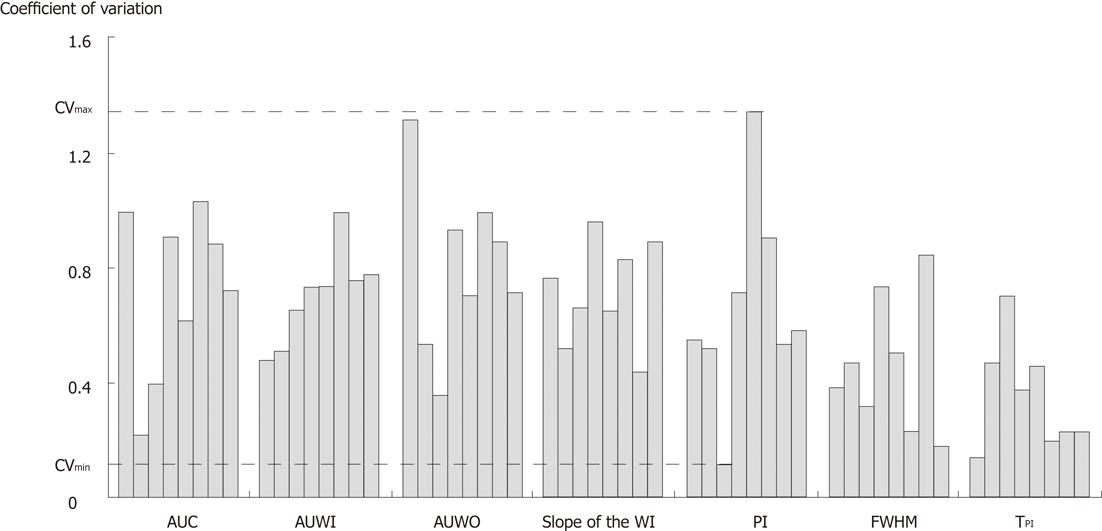
Figure 7 Display of the coefficients of variation, expressed as %, associated with the semi-quantitative microvascularization parameters extracted from the arterial region of interest.
CV: Coefficient of variation; AUC: The area under the curve; WI: The wash-in; AUWI: The area under the wash-in; AUWO: The area under the wash-out; PI: Peak intensity; TPI: Time to peak intensity; FWHM: The full width at half maximum.
- Citation: Gauthier M, Pitre-Champagnat S, Tabarout F, Leguerney I, Polrot M, Lassau N. Impact of the arterial input function on microvascularization parameter measurements using dynamic contrast-enhanced ultrasonography. World J Radiol 2012; 4(7): 291-301
- URL: https://www.wjgnet.com/1949-8470/full/v4/i7/291.htm
- DOI: https://dx.doi.org/10.4329/wjr.v4.i7.291


