Copyright
©2012 Baishideng Publishing Group Co.
World J Radiol. Jul 28, 2012; 4(7): 291-301
Published online Jul 28, 2012. doi: 10.4329/wjr.v4.i7.291
Published online Jul 28, 2012. doi: 10.4329/wjr.v4.i7.291
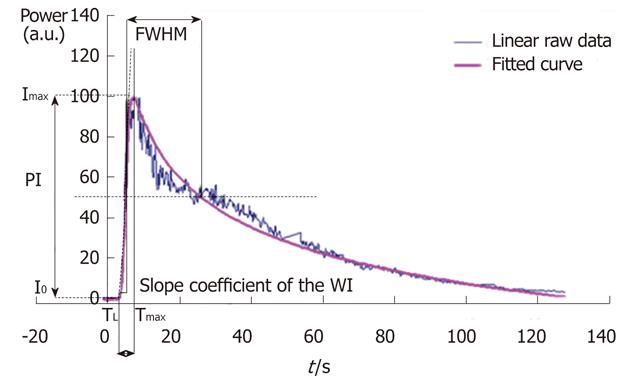
Figure 1 Graph displaying an example of a time intensity curve with four of its seven associated microvascularization parameters: the peak intensity, the time to peak intensity, the slope coefficient of the wash-in and the full width at half maximum.
The three other microvascularization parameters extracted from the time intensity curve are the area under the curve, the area under the wash-in and the area under the wash-out. WI: Wash-in; FWHM: The full width at half maximum; PI: The peak intensity; Imax: Maximal intensity value; I0; Initial intensity value; TL is the latency time and is defined as the time at the intersection between y = I0 and the tangent at Tmax/2 where Tmax is the time associated with Imax.
- Citation: Gauthier M, Pitre-Champagnat S, Tabarout F, Leguerney I, Polrot M, Lassau N. Impact of the arterial input function on microvascularization parameter measurements using dynamic contrast-enhanced ultrasonography. World J Radiol 2012; 4(7): 291-301
- URL: https://www.wjgnet.com/1949-8470/full/v4/i7/291.htm
- DOI: https://dx.doi.org/10.4329/wjr.v4.i7.291


