Copyright
©2012 Baishideng Publishing Group Co.
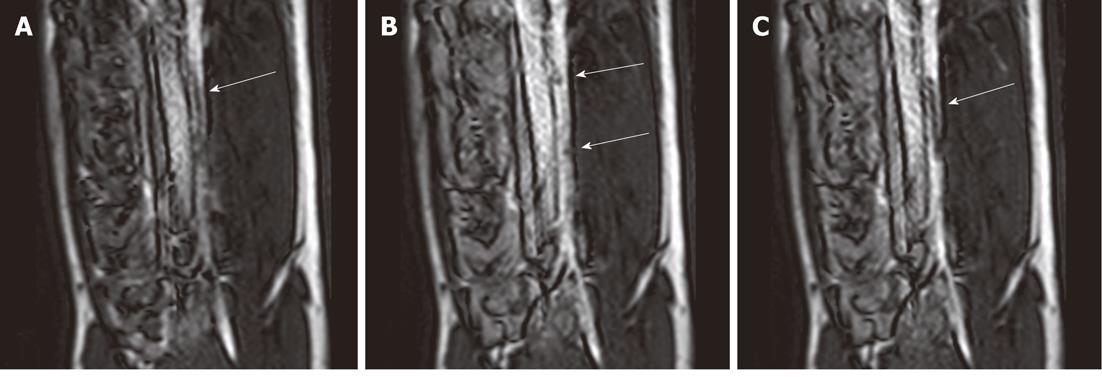
Figure 1 Selected magnetic resonance-guided images of the abdominal aorta prior to the administration of intravascular gadolinium-based (T1 enhancing agent) magnetic resonance contrast medium, the inflated balloon on the catheter is evident (arrow), but suffers substantial downstream signal loss (A).
After a blood pool magnetic resonance (MR) contrast medium administration (B), the MR dysprosium-chelate (markers placed on the catheter shaft) becomes evident (arrows, B) and, following inflation, the spatial extent of the balloon is better delineated (arrow, C).
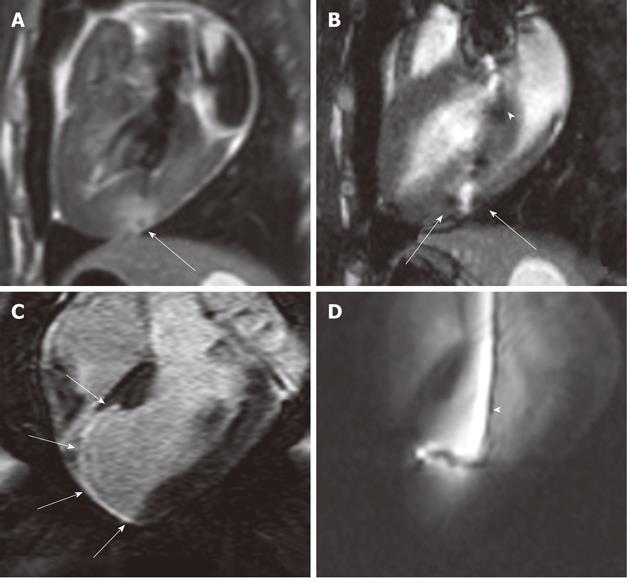
Figure 2 Gadolinium-based magnetic resonance contrast media (T1 enhancing agent) have been used for multiple purposes in cardiac interventions.
A:These agents (at a low concentration) have been used to create a target in the myocardium; B: Gadolinium oxide powder was used to coat the endovascular catheter to facilitate navigation into the LV (white arrowhead); C: Magnetic resonance (MR) contrast medium was also used for enhancing and measuring the target (myocardial infarct) (white arrows); D: Selected MR-guided images show an active catheter hitting the infarcted target.
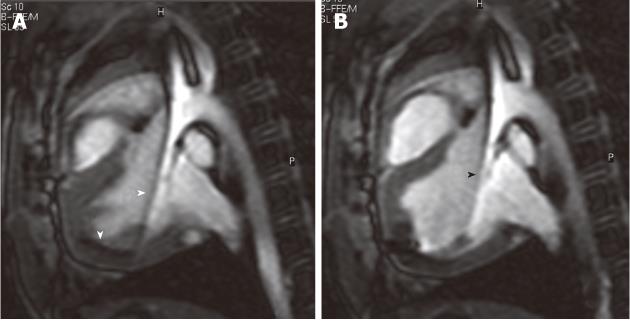
Figure 3 Selected magnetic resonance-guided images showing the advancement of a passive injecting catheter (arrowheads) in the left ventricle prior to (A) and after injecting dysprosium-chelate (T2* enhancing agent) magnetic resonance contrast medium (B, arrowhead) to ensure delivery in the targeted myocardium.
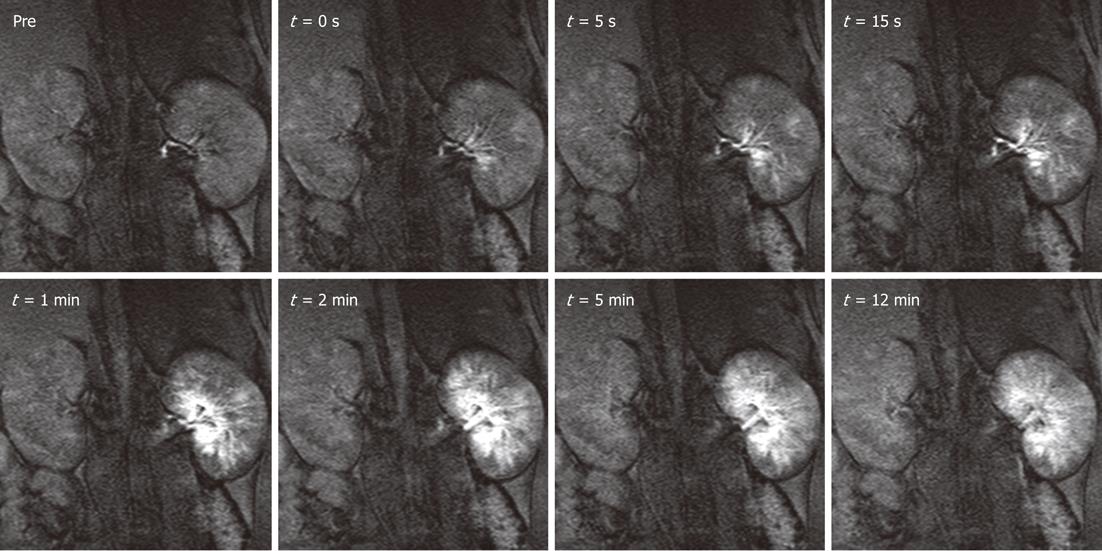
Figure 4 Distribution of magnetic resonance labeled embolic materials as a function of time in the left kidney.
Gadolinium-impregnated microspheres caused a steep increase in signal intensity over the cortical and medullary regions. Less than 5 min after the injection, as excess free gadolinium was excreted in the urine, the signal intensities began to decrease but still remained substantially above baseline for both particle sizes. Administration of magnetic resonance contrast media after the procedure confirmed the hypothesis that the injection of microspheres halts blood flow to targeted tissues. Hyperenhanced foci corresponding to microsphere location persisted for at least 1hr after injections. The smaller particles tended to settle more peripherally in the renal cortex, whereas the larger microspheres were lodged in the inner cortical and medullary regions. This new labeling technique may be useful for embolotherapy procedures, such as uterine fibroid embolization, hepatic tumor embolization, and preoperative meningioma embolization.
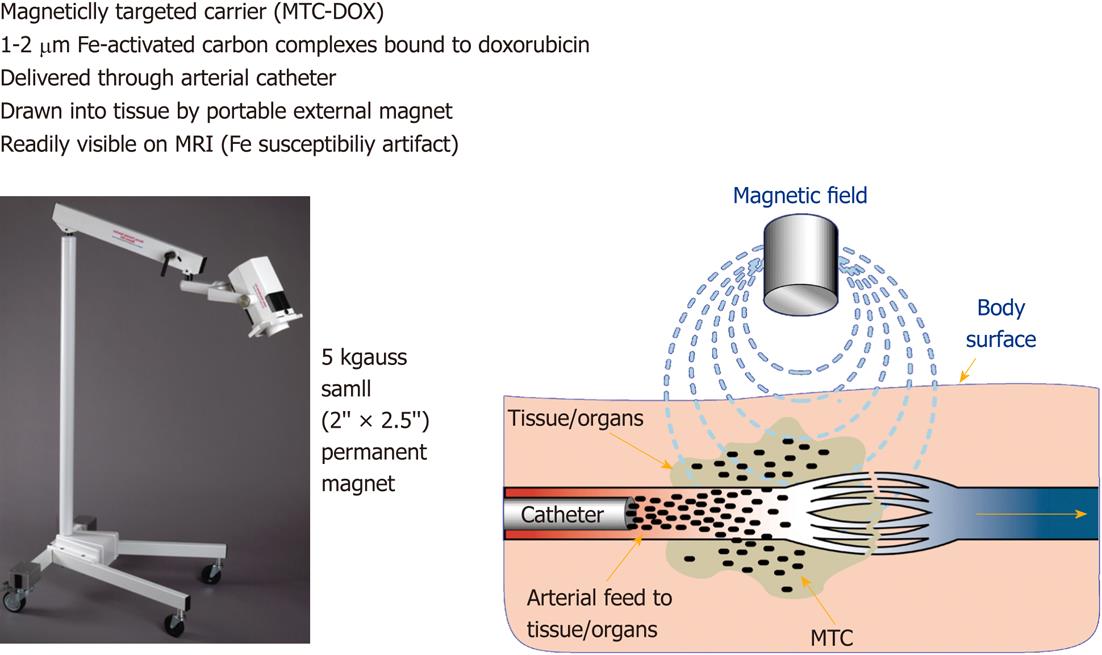
Figure 5 This figure shows a portable magnet (left) and a diagram (right) depicts the mode of action of magnetic targeted therapy in the target.
The overall height of the magnet and holding apparatus is 1.4 m. The intra-arterial injected magnetic targeted carrier (iron particles) bound to doxorubicin (MTC-DOX), which is drawn out of the artery into surrounding tumor and/or liver tissue by the influence of the local magnetic field (Image courtesy of FeRx.). MRI: Magnetic resonance imaging.
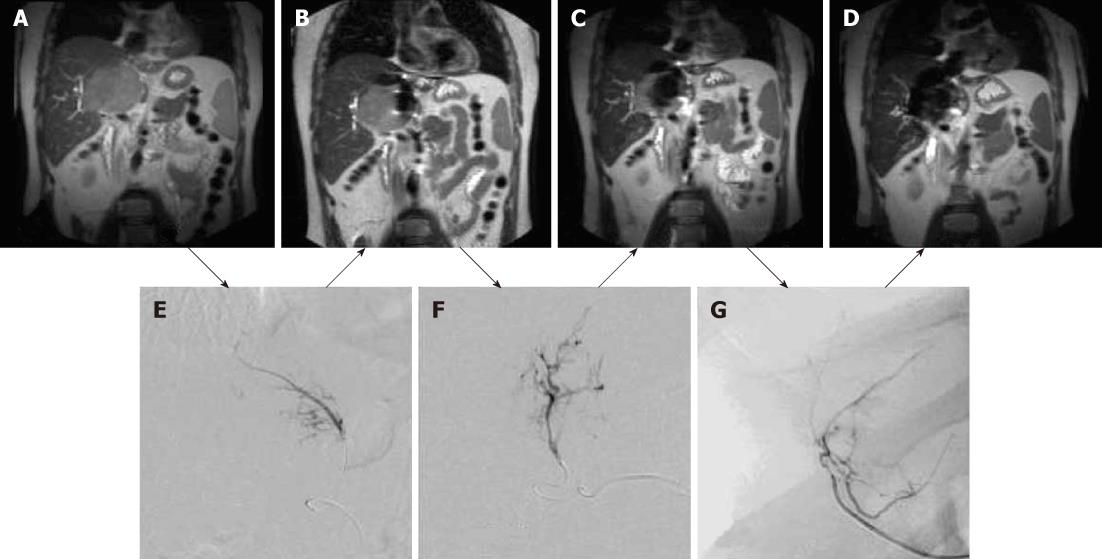
Figure 6 Coronal magnetic resonance images of large hepatocellular carcinoma obtained before magnetic targeted carrier bound to doxorubicin administration (A) and after the first (B), second (C) and third (D) dose of magnetic targeted carrier bound to doxorubicin.
The selective hepatic arterial catheter was repositioned between each dose. The initial DSA image (E) was obtained during the injection of magnetic targeted carrier bound to doxorubicin (MTC-DOX) into the left hepatic artery supplying the tumor. The next dose was injected into the hepatic artery branch segment (F), while the third dose was injected into a branch of the right hepatic artery (G). As a result, progressively larger areas of the tumor were affected by MTC-DOX, as documented by the progressive loss of signal intensity due to iron susceptibility artifacts (T2*) on the intra-procedural coronal magnetic resonance images obtained after each injection.
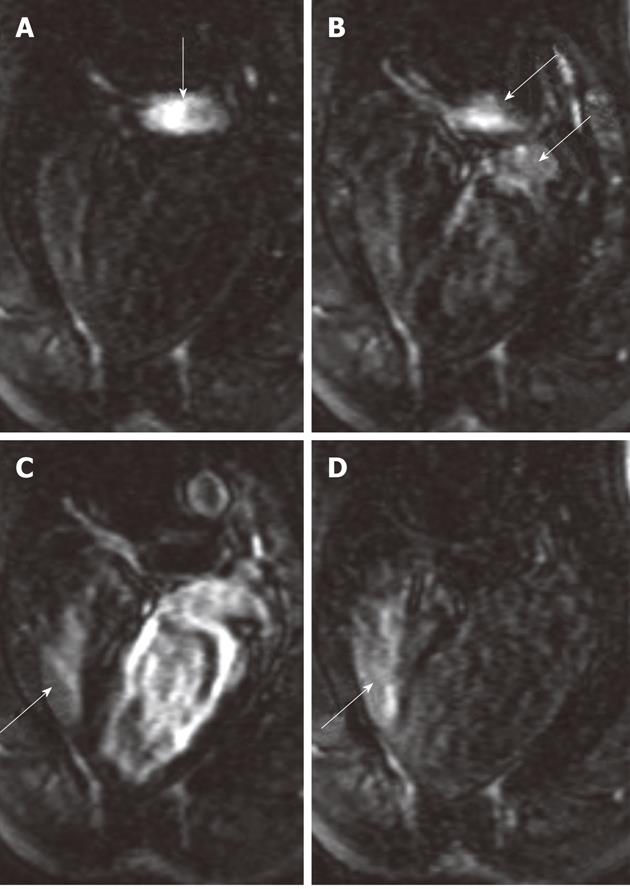
Figure 7 Bolus administration of gadolinium-chelate demonstrates atrial septal defect on cardiac magnetic resonance four-chamber view images.
At the time of administration of the contrast medium, the right atrium was enhanced (A, arrow). Images acquired 1-2 s later show the contrast medium in both the pulmonary artery and left atrium (B, arrows) and subsequently in both right (arrow) and left ventricles (C). As a sign of an intracardiac left-to-right shunt, enhancement of the right ventricle is detected simultaneously with enhancement of the left ventricle. The re-enhancement of the right ventricle (D, arrow) as a result of recirculation of the contrast medium was acquired 12 s after image A.
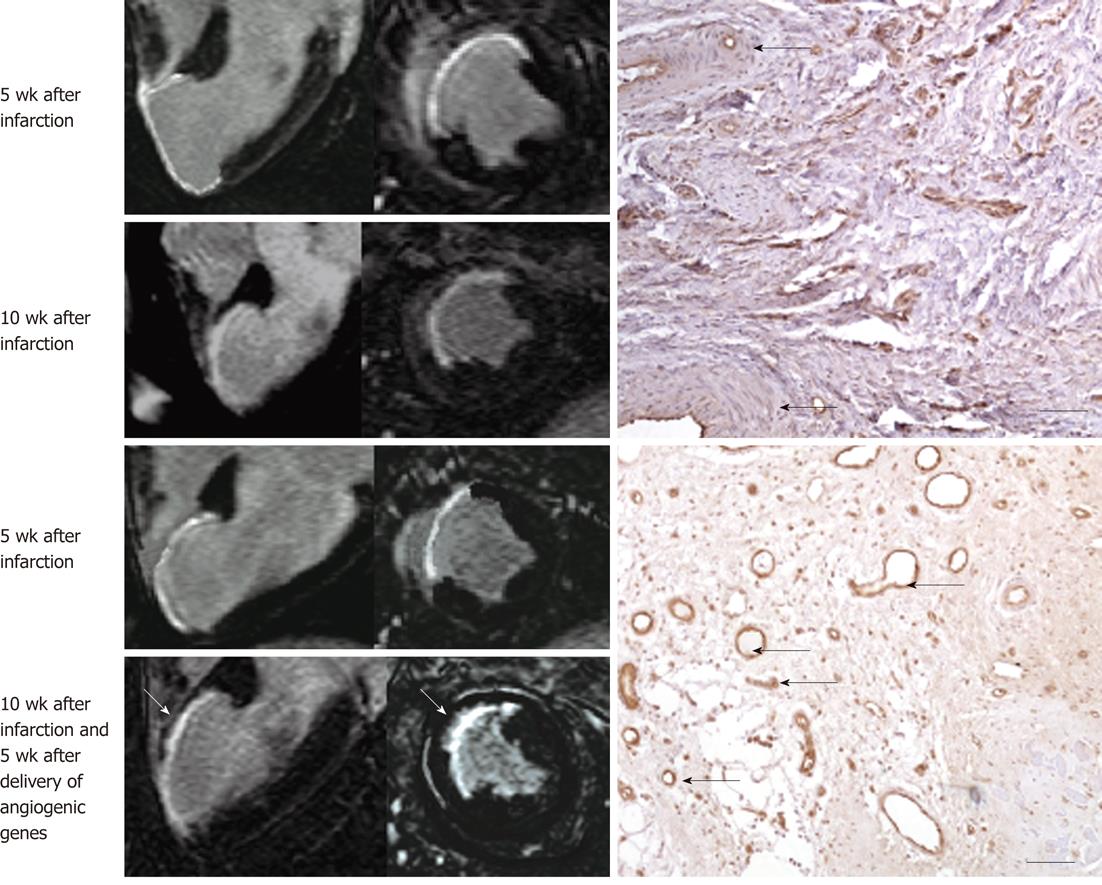
Figure 8 Gadolinium-enhanced magnetic resonance long-axis (left column) and short-axis (right column) images illustrate the extent of myocardial infarct (hyperenhanced myocardium) at 5 wk after infarction and 5 wk after injection of saline (top block, 4 magnetic resonance images) and angiogenic gene (bottom block, 4 magnetic resonance images).
Gadolinium-enhanced magnetic resonance (MR) images delineated myocardial infarct and showed substantial reduction in infarct extent and transmurality 5 wk after treatment (bottom block, bottom row, white arrows) compared with control animal (top block, bottom row). The angiogenic gene was delivered transendocardially under MR-guidance as shown in Figure 2. The histopathologic sections (right) show very few blood vessels in control animal (top right, black arrows) and the formation of abundant new blood vessels in gene treated animal (bottom right, black arrows).
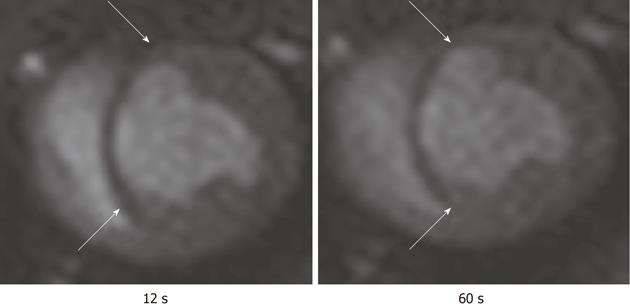
Figure 9 First pass perfusion magnetic resonance imaging shows the hypoperfused infarct scar (arrows) after bolus administration of Gd-DTPA.
The magnetic resonance (MR) images illustrate the delay in the enhancement of infarcted myocardium (arrows) compared with remote myocardium. The images were acquired at 12 s (left) and 60 s (right) after bolus administration of MR contrast media.
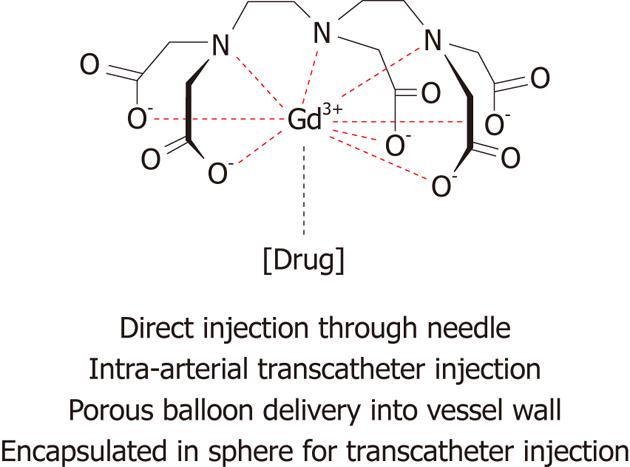
Figure 10 Schematic representation of magnetic resonance labeled therapy and their routes of delivery.
- Citation: Saeed M, Wilson M. Value of MR contrast media in image-guided body interventions. World J Radiol 2012; 4(1): 1-12
- URL: https://www.wjgnet.com/1949-8470/full/v4/i1/1.htm
- DOI: https://dx.doi.org/10.4329/wjr.v4.i1.1


