Copyright
©2011 Baishideng Publishing Group Co.
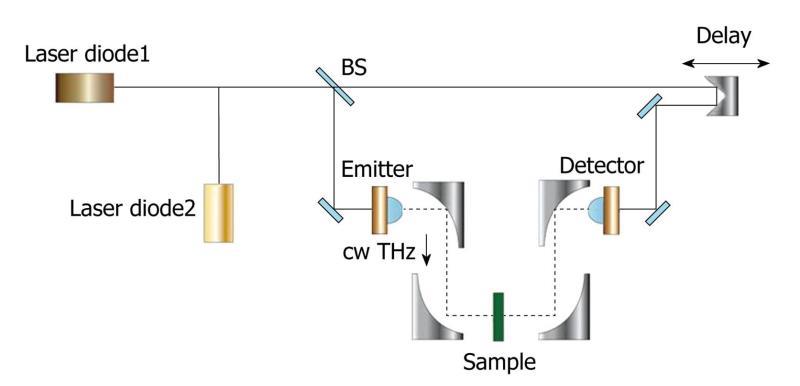
Figure 1 Schematic illustration of a continuous wave THz imaging system in transmission geometry.
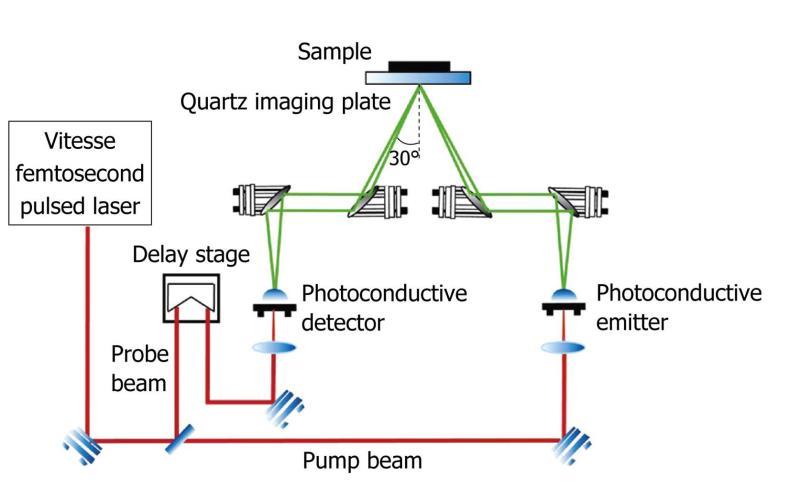
Figure 2 Schematic illustration of a pulsed THz imaging system with reflection geometry.
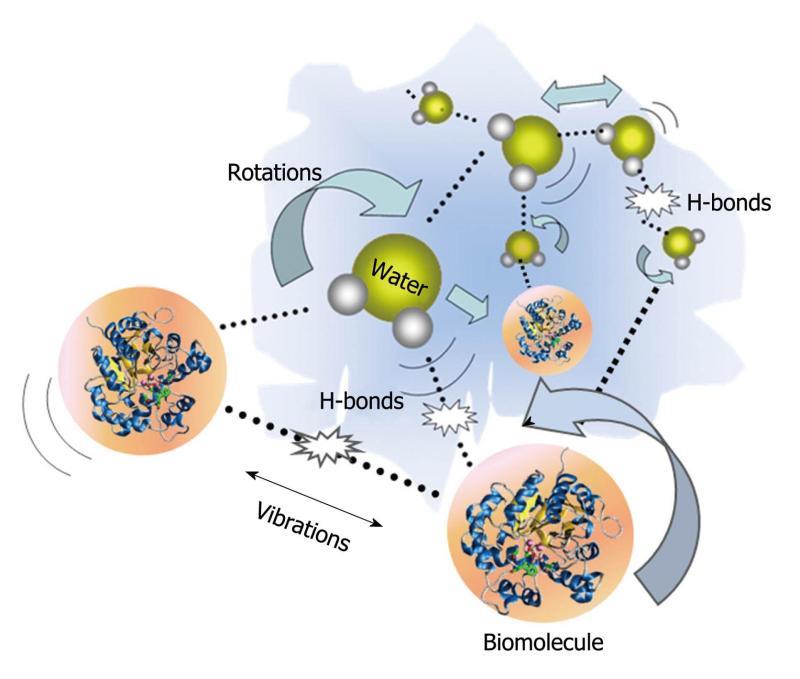
Figure 3 Schematic representation of H-bond interactions between water and biomolecules.
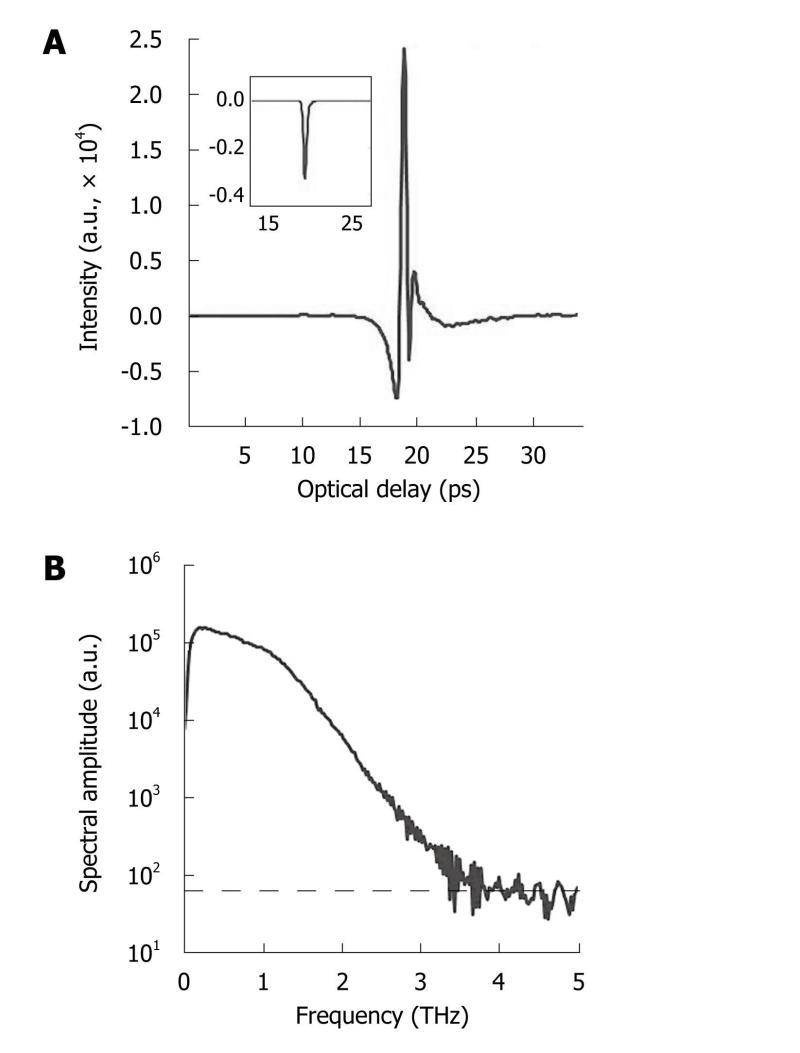
Figure 4 Typical terahertz pulse and corresponding spectrum.
A: Temporal waveform of a sample (drawn by raw data with the inset representing its corresponding processed data after deconvolution with a reference measurement); B: The corresponding spectrum of the raw data with the noise floor (indicated by dashed line).
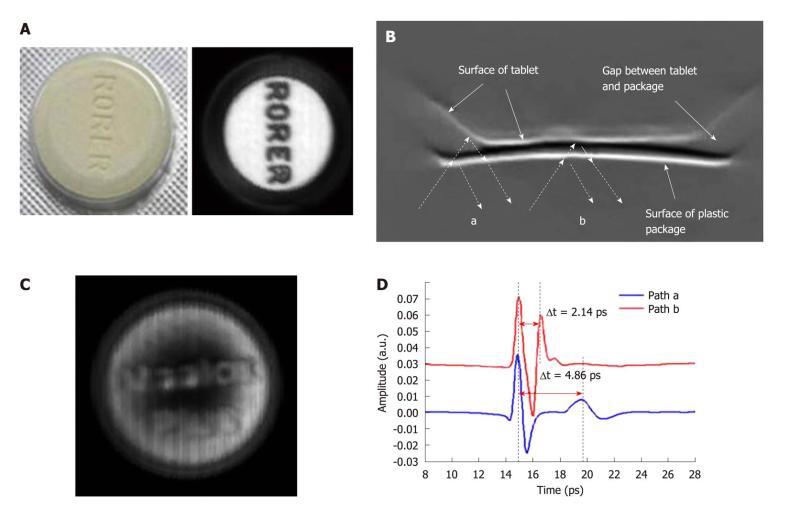
Figure 5 Terahertz imaging of the tablet.
A: Photograph of the tablet in the plastic package and THz C-Scan section imaging without the packaging; B: THz B-Scan image shows the structure of the cross-section of the tablet and the THz light paths at the edge of the tablet (path a) and the centre (path b); C: THz C-Scan image shows the tablet face inside the plastic package; D: THz deconvolved waveforms in the time-domain reflected from the paths a and b in Figure 5B.
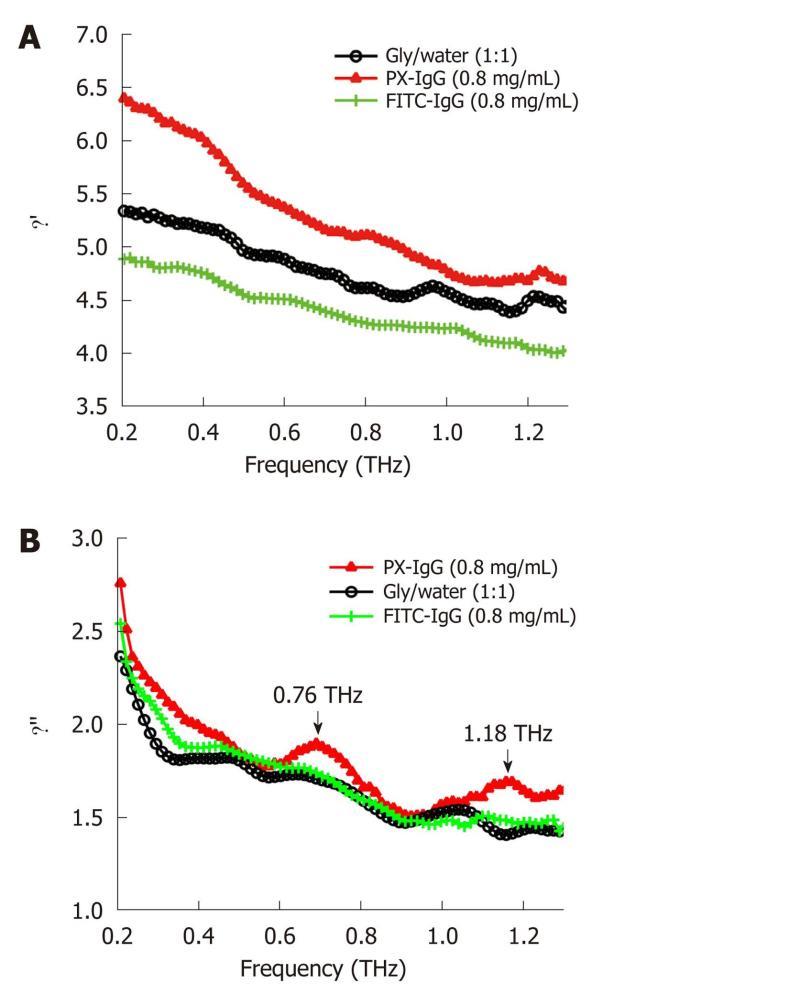
Figure 6 Dielectric constant spectra (A) and dielectric loss spectra (B) of water/ glycerol mix (black line with circles), peroxidase conjugated IgG (red line with triangles) and the fluorescein conjugated IgG (green line with crosses) dissolved in the water/glycerol solution at the concentration of 0.
8 mg/mL in the frequency range of 0.1-1.3 THz. PX: Peroxidase conjugated; FITC: Fluorescein conjugated.
Figure 7 Tissue characterization using THz spectroscopy.
A: Mean absorption coefficients of kidney, liver and abdominal fat; B: Mean refractive indices of all the tissue samples. Error bars represent 95% confidence intervals.
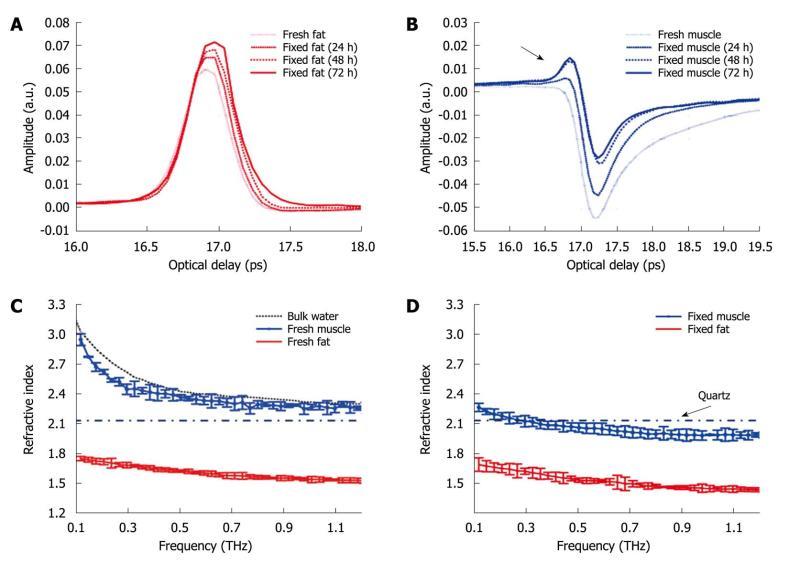
Figure 8 The deconvolved mean waveforms for adipose tissue (A) and skeletal muscle (B) as the fixing time progressed and the mean refractive index for fresh (C) and fixed samples (D) of adipose tissue and skeletal muscle.
The dot-dash line indicates the refractive index of the quartz window on which the sample was measured. Error bars represent 95% CI. The water data were acquired in transmission and the error bars are too small to be seen on this graph.
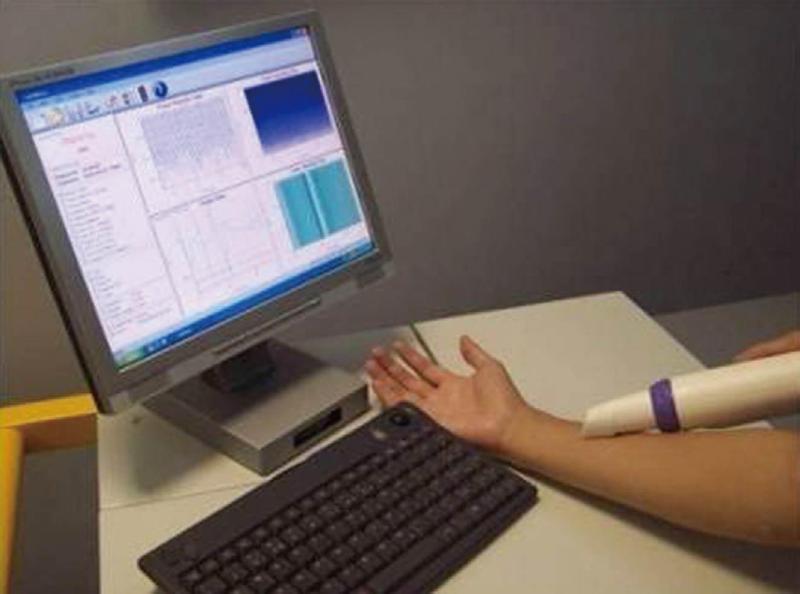
Figure 9 Photograph of the THz hand-held probe.
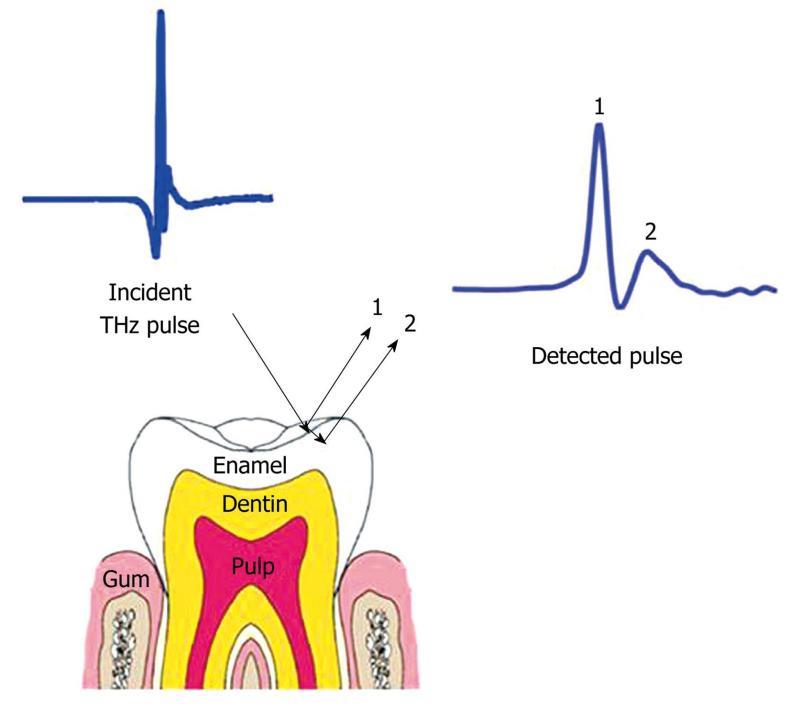
Figure 10 Schematic representation of the THz reflections from enamel.
Reflection 1 is the reflection from the surface of the enamel and reflection 2 is the reflection from within the enamel due to tooth decay causing mineral loss.
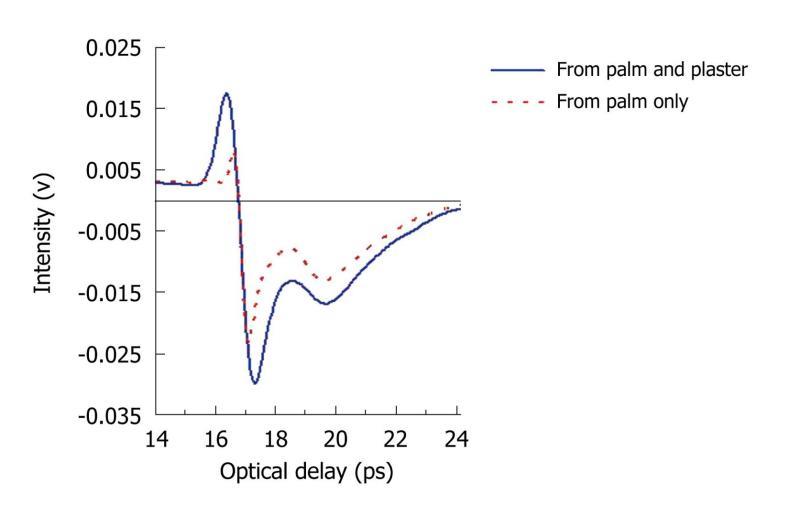
Figure 11 Measured pulses from the palm.
The blue line is the measurement of the palm through a tegaderm plaster and the red dotted line is the measurement of the palm alone. In both cases, two troughs are seen - they are the reflections from the top and bottom surfaces of the stratum corneum.
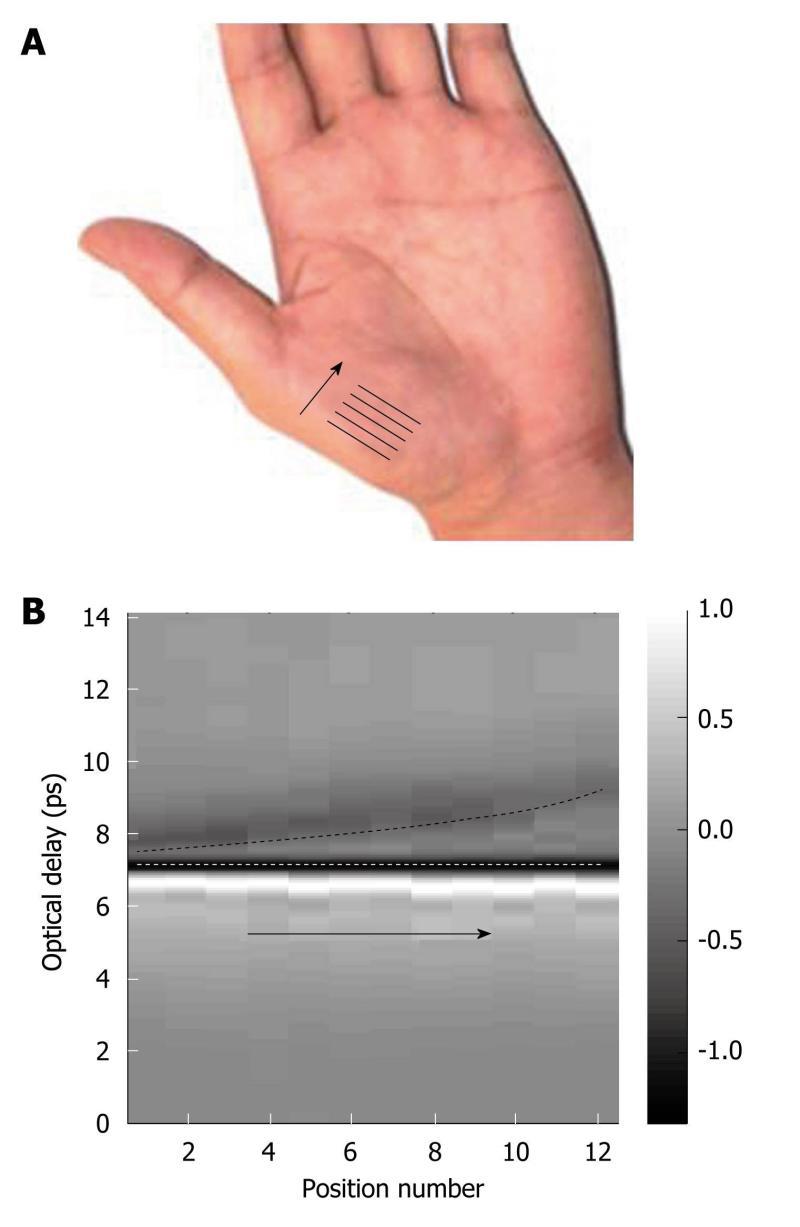
Figure 12 In vivo measurement of the variation in stratum corneum thickness of the palm.
A: Photograph of the palm, indicating where the THz measurements were taken; B: A b-scan image showing the variation in stratum corneum thickness with palm position. The white dashed line indicates the interface between the quartz window and the stratum corneum; and the black dashed line indicates the interface between the stratum corneum and the epidermis. The grey bar represents the ratio of the electric field at a given optical delay, t, over the maximum electric field [E(t)/Emax].
- Citation: Sun Y, Sy MY, Wang YXJ, Ahuja AT, Zhang YT, Pickwell-MacPherson E. A promising diagnostic method: Terahertz pulsed imaging and spectroscopy. World J Radiol 2011; 3(3): 55-65
- URL: https://www.wjgnet.com/1949-8470/full/v3/i3/55.htm
- DOI: https://dx.doi.org/10.4329/wjr.v3.i3.55


