Copyright
©2011 Baishideng Publishing Group Co.
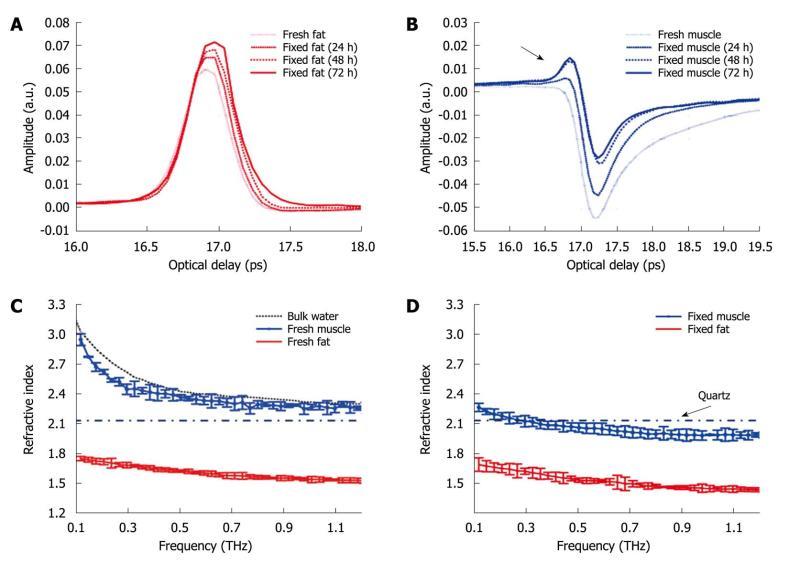
Figure 8 The deconvolved mean waveforms for adipose tissue (A) and skeletal muscle (B) as the fixing time progressed and the mean refractive index for fresh (C) and fixed samples (D) of adipose tissue and skeletal muscle.
The dot-dash line indicates the refractive index of the quartz window on which the sample was measured. Error bars represent 95% CI. The water data were acquired in transmission and the error bars are too small to be seen on this graph.
- Citation: Sun Y, Sy MY, Wang YXJ, Ahuja AT, Zhang YT, Pickwell-MacPherson E. A promising diagnostic method: Terahertz pulsed imaging and spectroscopy. World J Radiol 2011; 3(3): 55-65
- URL: https://www.wjgnet.com/1949-8470/full/v3/i3/55.htm
- DOI: https://dx.doi.org/10.4329/wjr.v3.i3.55


