Copyright
©2010 Baishideng Publishing Group Co.
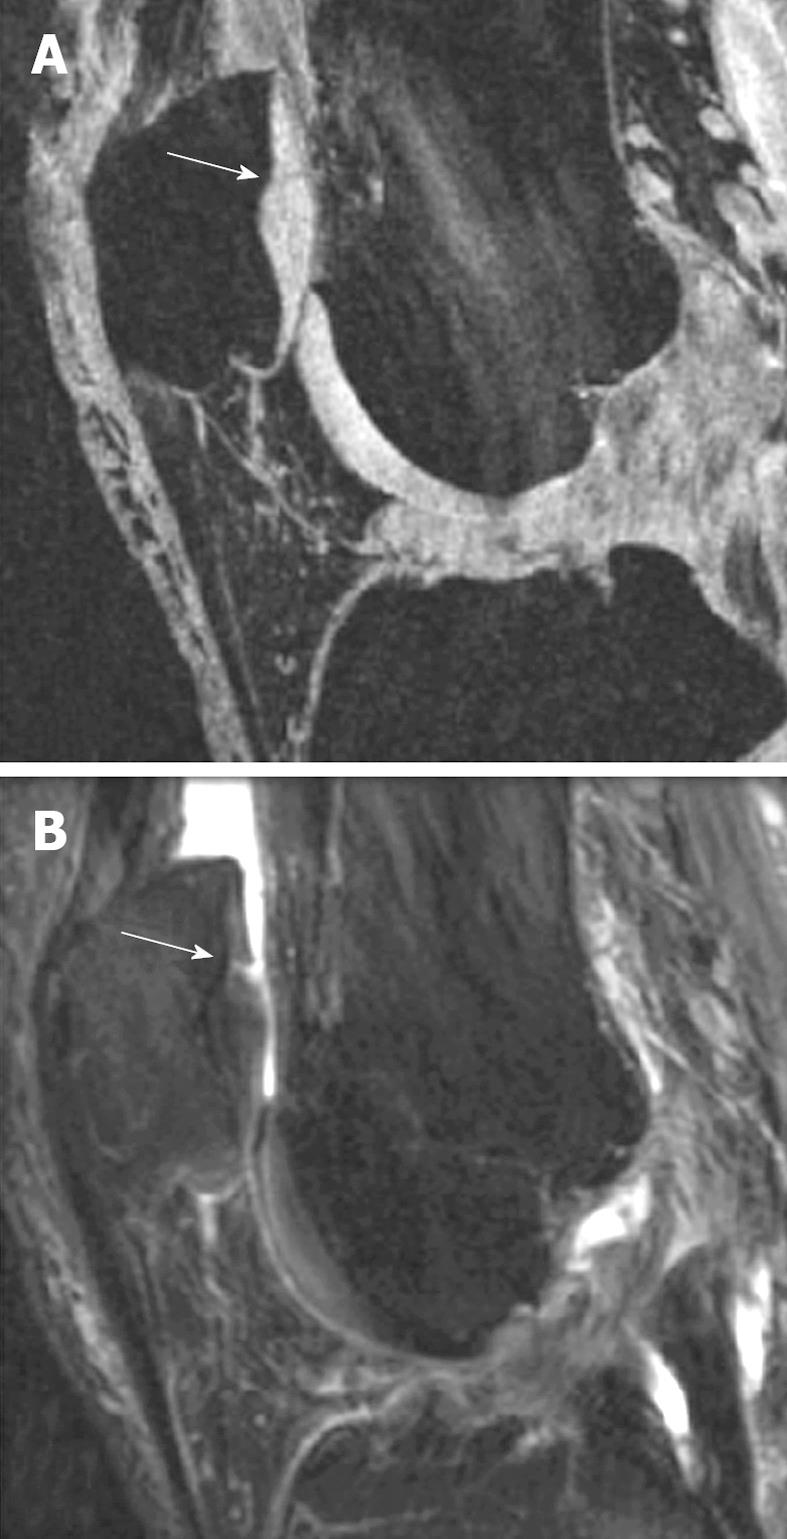
Figure 1 Comparison of gradient echo (GE) sequence and fat-suppressed (FS) sequence in depicting intra-cartilage lesion.
A: Sagittal fat saturated spoiled GE image of the knee in a patient with early OA and a cartilage fissure (arrow); B: Sagittal FS intermediate weighted image of the same patient with the fissure (arrow). Note the difference in contrast with bright cartilage signal in (A) and intermediate cartilage signal in (B). Joint effusion in (B) with bright signal improves visualization of the cartilage fissure (Reproduced by permission of John Wiley & Sons, Ltd from Reference 8).
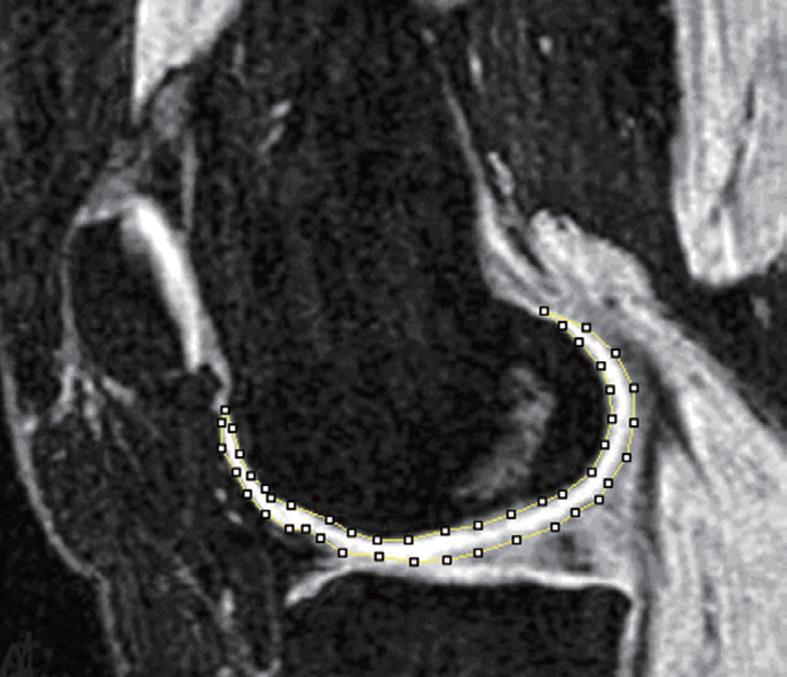
Figure 2 3D GE fat suppressed magnetic resonance imaging (MRI) at the sagittal plane.
Bone cortex, bone marrow, and fat tissue appear to have a dark signal. Muscle appears to have a gray signal and cartilage a bright signal. The femur cartilage has been manually segmented at this slice.
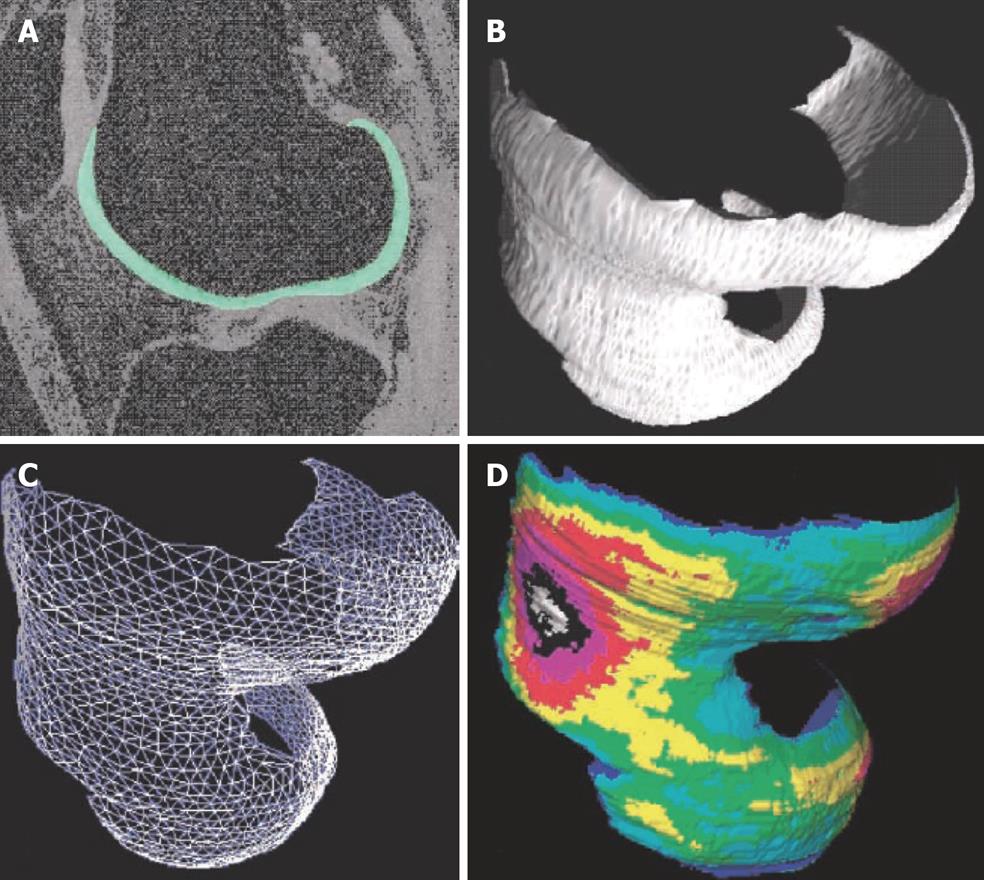
Figure 3 Quantitative 3D analysis of cartilage morphology from MRI.
A: Sagittal MR image of human knee obtained with a fat-suppressed GE sequence, femoral cartilage is segmented; B: 3D volume reconstruction of the femoral cartilage; C: Analysis of joint surface area by a triangulation technique; D: Computation of 3D thickness distribution, independent of section orientation. (Reproduced from reference 6, with kind permission of Springer Science and Business Media).
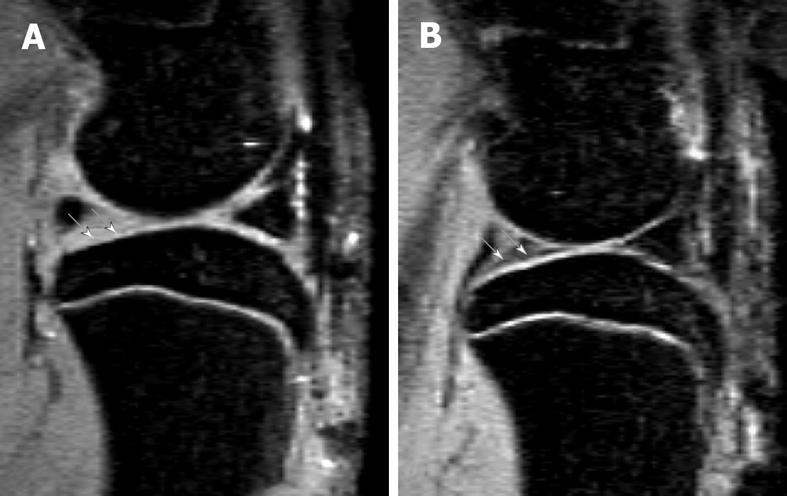
Figure 4 Sagittal view MRI at 4.
7T of a rat knee with medial meniscal tear (A) and a rat with sham operation (B). A: Parts of the tibia cartilage become much thinner (white arrows). B: Normal tibia cartilage (white arrows). This animal model has been described in reference 22 (Wang et al[22] 2006).
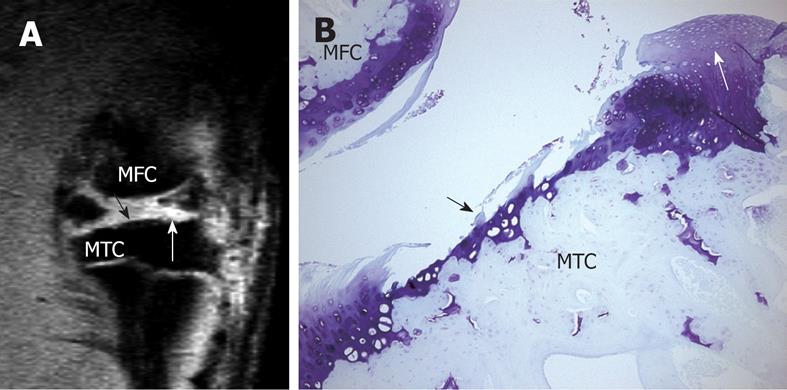
Figure 5 High resolution MRI demonstrates cartilage erosion and proliferation in rat knee joint.
A: Sagittal view MRI of a rat knee with a medial meniscal tear. White arrow shows neo-cartilage proliferation and black arrow shows articular cartilage loss; B: Histology section of the medial tibial condyle stained with Toluidine blue (× 100), 28 d after meniscal tear. Cartilage erosion (black arrow) and neo-cartilage proliferation (white arrow) are seen in the tibia cartilage. MTC: Medial tibia condyle; MFC: Media femur condyle. This animal model has been described in reference 22 (Wang et al[22] 2006).
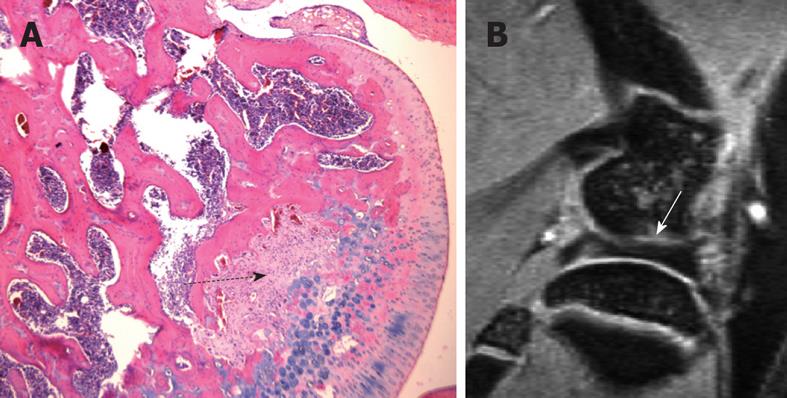
Figure 6 One example of the pitfalls in interpreting normal rat knee high resolution MR images.
A: H&E-stained sections of a normal 3 mo rat knee, a mid-section through the femur. Dotted black arrow denotes the area of fibrous components together with their matrix, which are continuous with the cartilaginous component of the joint surface, and there is no bony component seen within this region. This region may appear as a notch or a cyst on MR images due to its higher signal; B: Sagittal MR image of a normal 3 mo old rat knee. White arrow in B denotes a gray area possibly composed of a mixture of cartilage and bone components.
- Citation: Wang YXJ, Griffith JF, Ahuja AT. Non-invasive MRI assessment of the articular cartilage in clinical studies and experimental settings. World J Radiol 2010; 2(1): 44-54
- URL: https://www.wjgnet.com/1949-8470/full/v2/i1/44.htm
- DOI: https://dx.doi.org/10.4329/wjr.v2.i1.44


