Copyright
©2010 Baishideng Publishing Group Co.
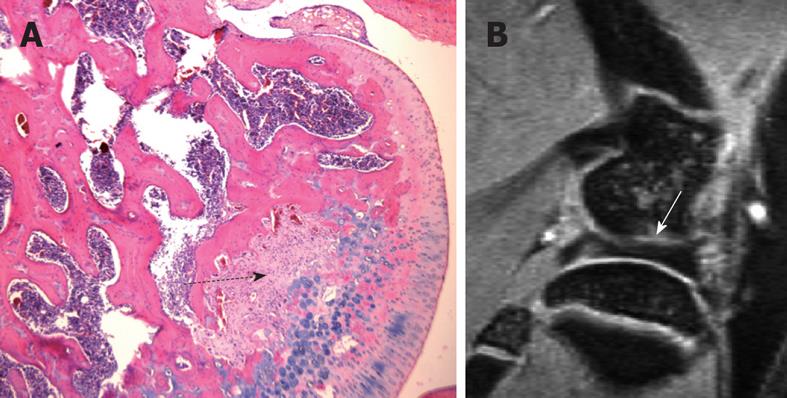
Figure 6 One example of the pitfalls in interpreting normal rat knee high resolution MR images.
A: H&E-stained sections of a normal 3 mo rat knee, a mid-section through the femur. Dotted black arrow denotes the area of fibrous components together with their matrix, which are continuous with the cartilaginous component of the joint surface, and there is no bony component seen within this region. This region may appear as a notch or a cyst on MR images due to its higher signal; B: Sagittal MR image of a normal 3 mo old rat knee. White arrow in B denotes a gray area possibly composed of a mixture of cartilage and bone components.
- Citation: Wang YXJ, Griffith JF, Ahuja AT. Non-invasive MRI assessment of the articular cartilage in clinical studies and experimental settings. World J Radiol 2010; 2(1): 44-54
- URL: https://www.wjgnet.com/1949-8470/full/v2/i1/44.htm
- DOI: https://dx.doi.org/10.4329/wjr.v2.i1.44


