Copyright
©2010 Baishideng Publishing Group Co.
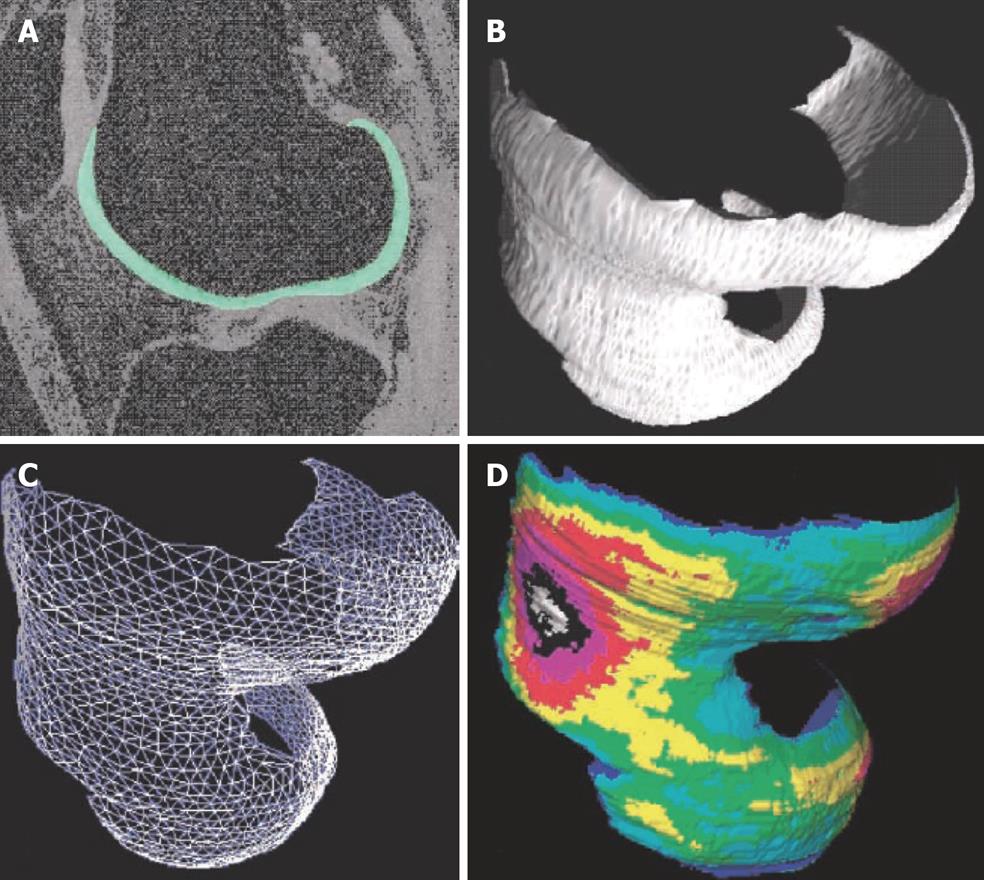
Figure 3 Quantitative 3D analysis of cartilage morphology from MRI.
A: Sagittal MR image of human knee obtained with a fat-suppressed GE sequence, femoral cartilage is segmented; B: 3D volume reconstruction of the femoral cartilage; C: Analysis of joint surface area by a triangulation technique; D: Computation of 3D thickness distribution, independent of section orientation. (Reproduced from reference 6, with kind permission of Springer Science and Business Media).
- Citation: Wang YXJ, Griffith JF, Ahuja AT. Non-invasive MRI assessment of the articular cartilage in clinical studies and experimental settings. World J Radiol 2010; 2(1): 44-54
- URL: https://www.wjgnet.com/1949-8470/full/v2/i1/44.htm
- DOI: https://dx.doi.org/10.4329/wjr.v2.i1.44


