Copyright
©The Author(s) 2020.
World J Radiol. Aug 28, 2020; 12(8): 156-171
Published online Aug 28, 2020. doi: 10.4329/wjr.v12.i8.156
Published online Aug 28, 2020. doi: 10.4329/wjr.v12.i8.156
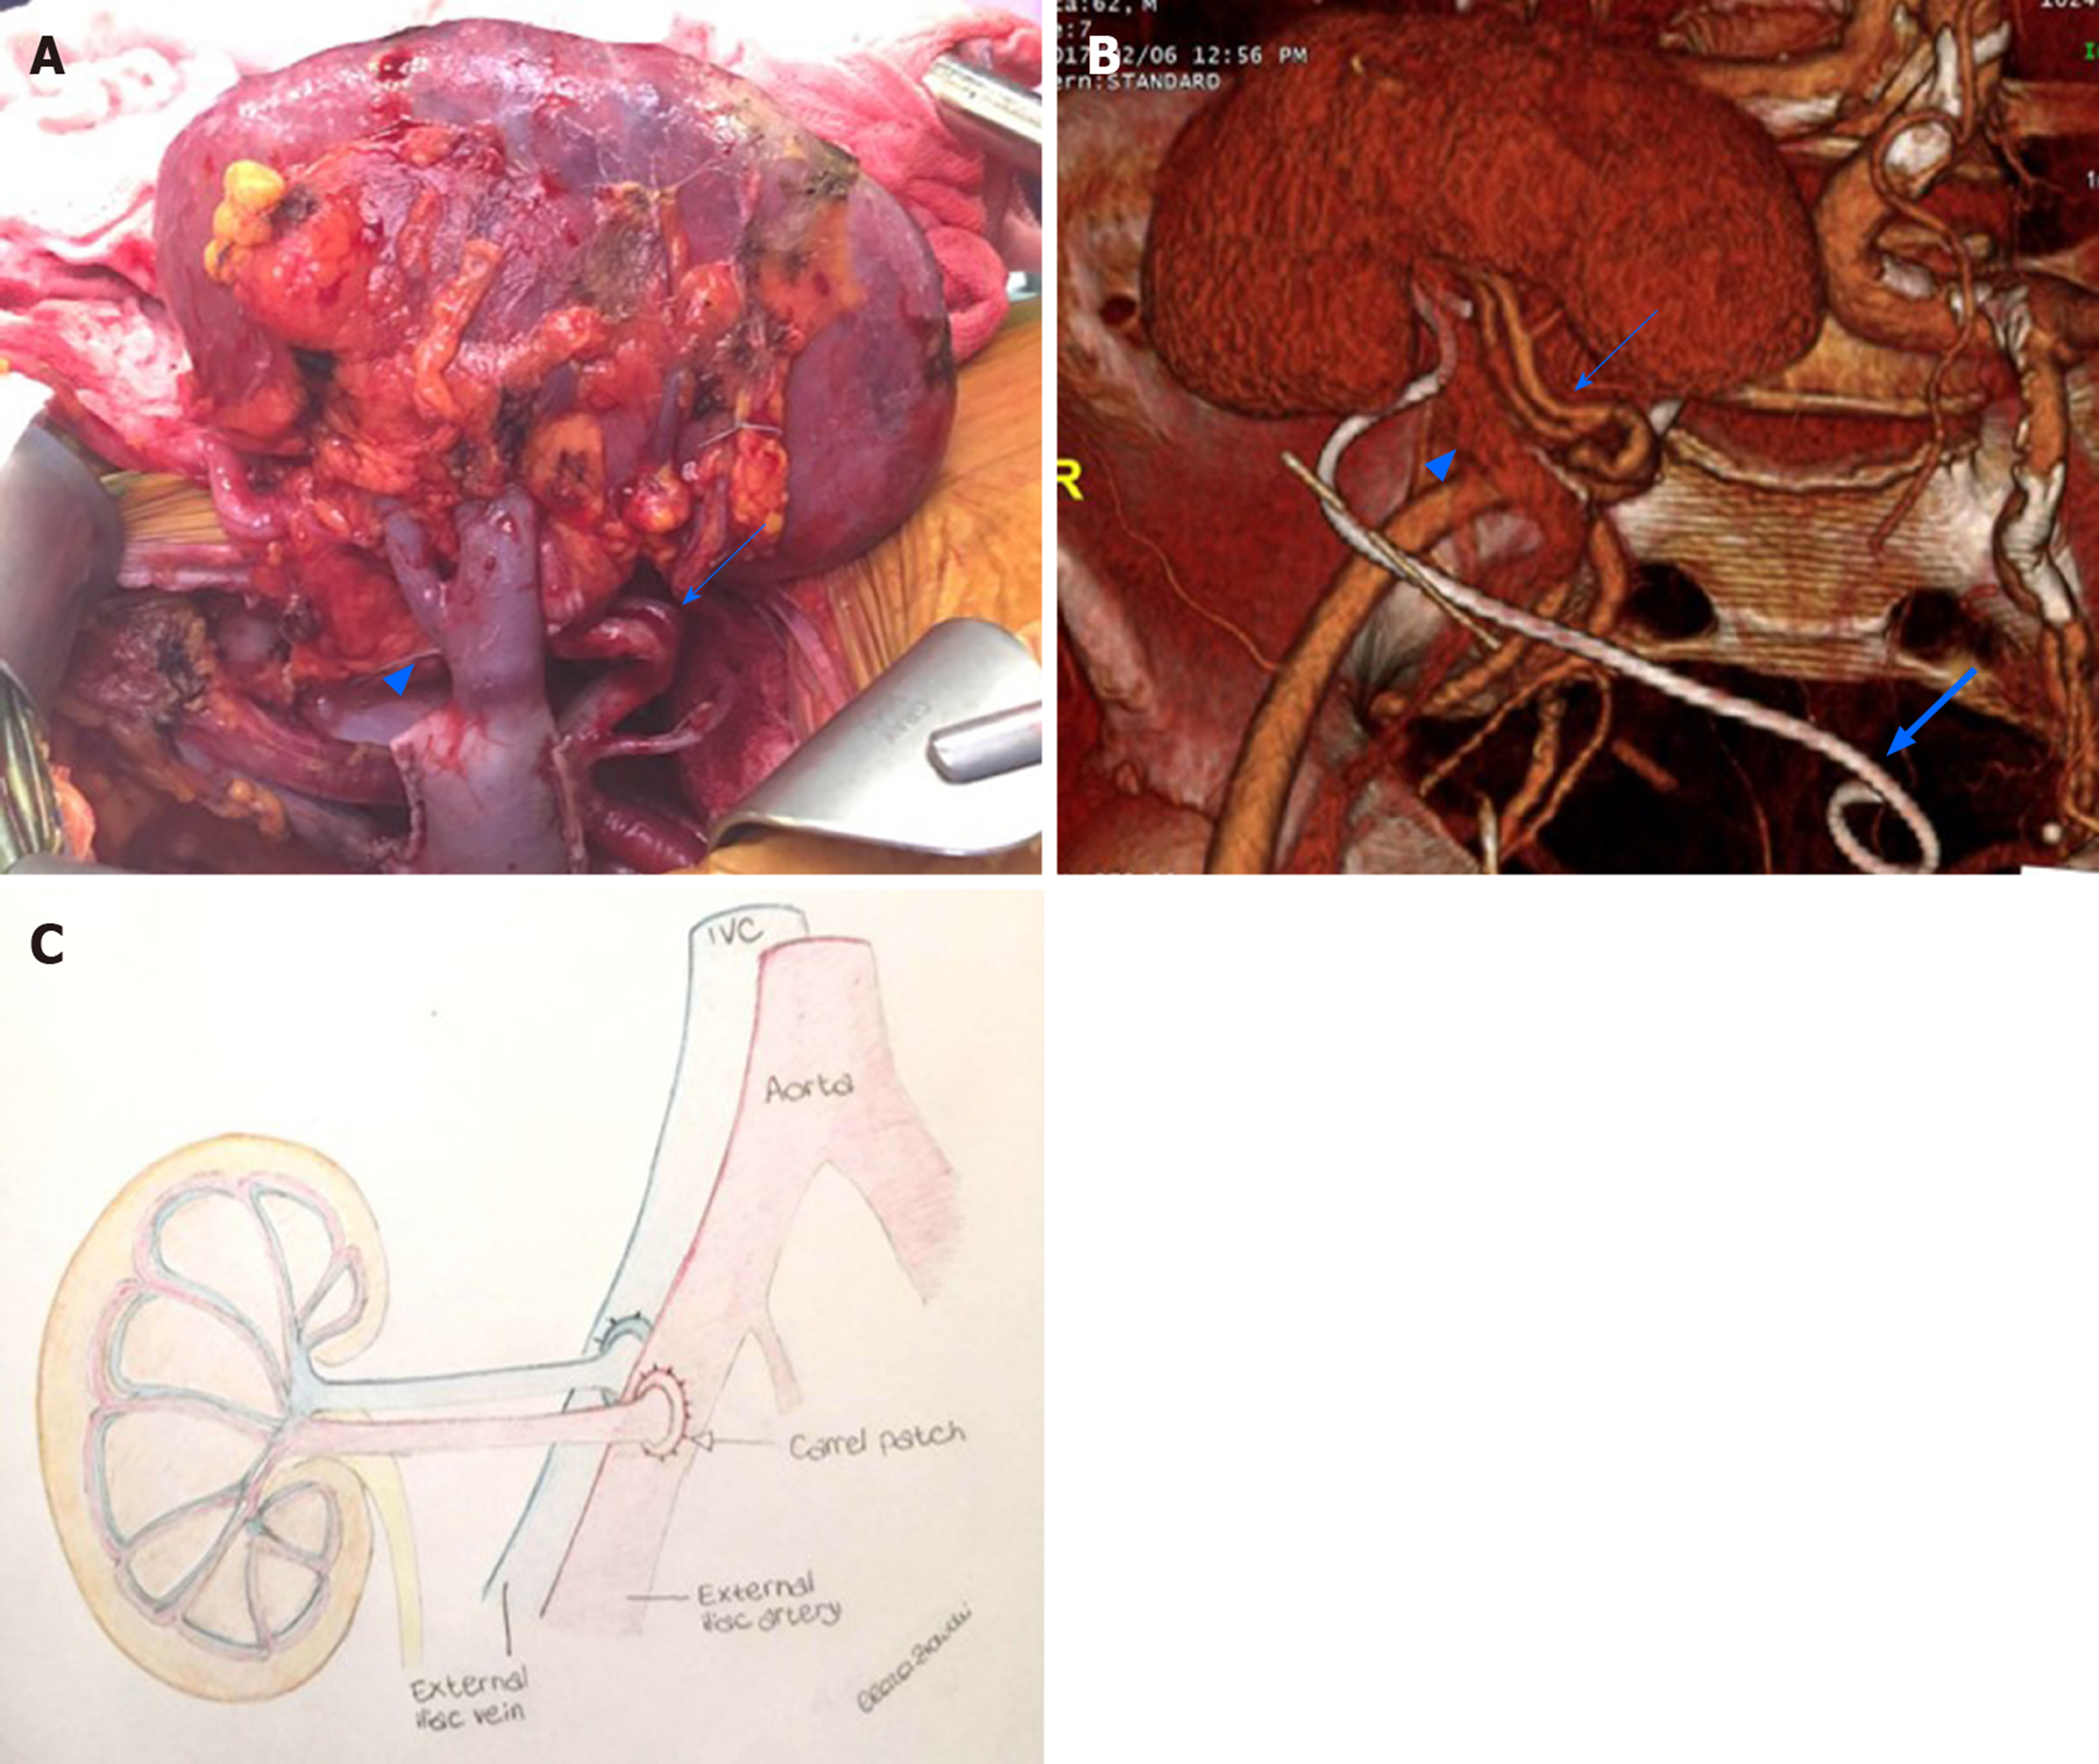
Figure 1 Renal allograft anatomy.
A: In the graft photo there is clear visualization of the transplanted renal vein (arrowhead) and transplanted renal artery (arrow); B: The corresponding volume rendering reconstruction from a computed tomography post-transplant scan shows the graft position in the right iliac fossa, transplanted renal vein (arrowhead), transplanted renal artery (arrow), and an ureteral stent temporarily left in place to favor urine output (large arrow); C: The drawing illustrates the end-to-end arterial anastomosis performed with a carrel patch (donor’s aortic patch attached to the transplanted renal artery) (arrow).
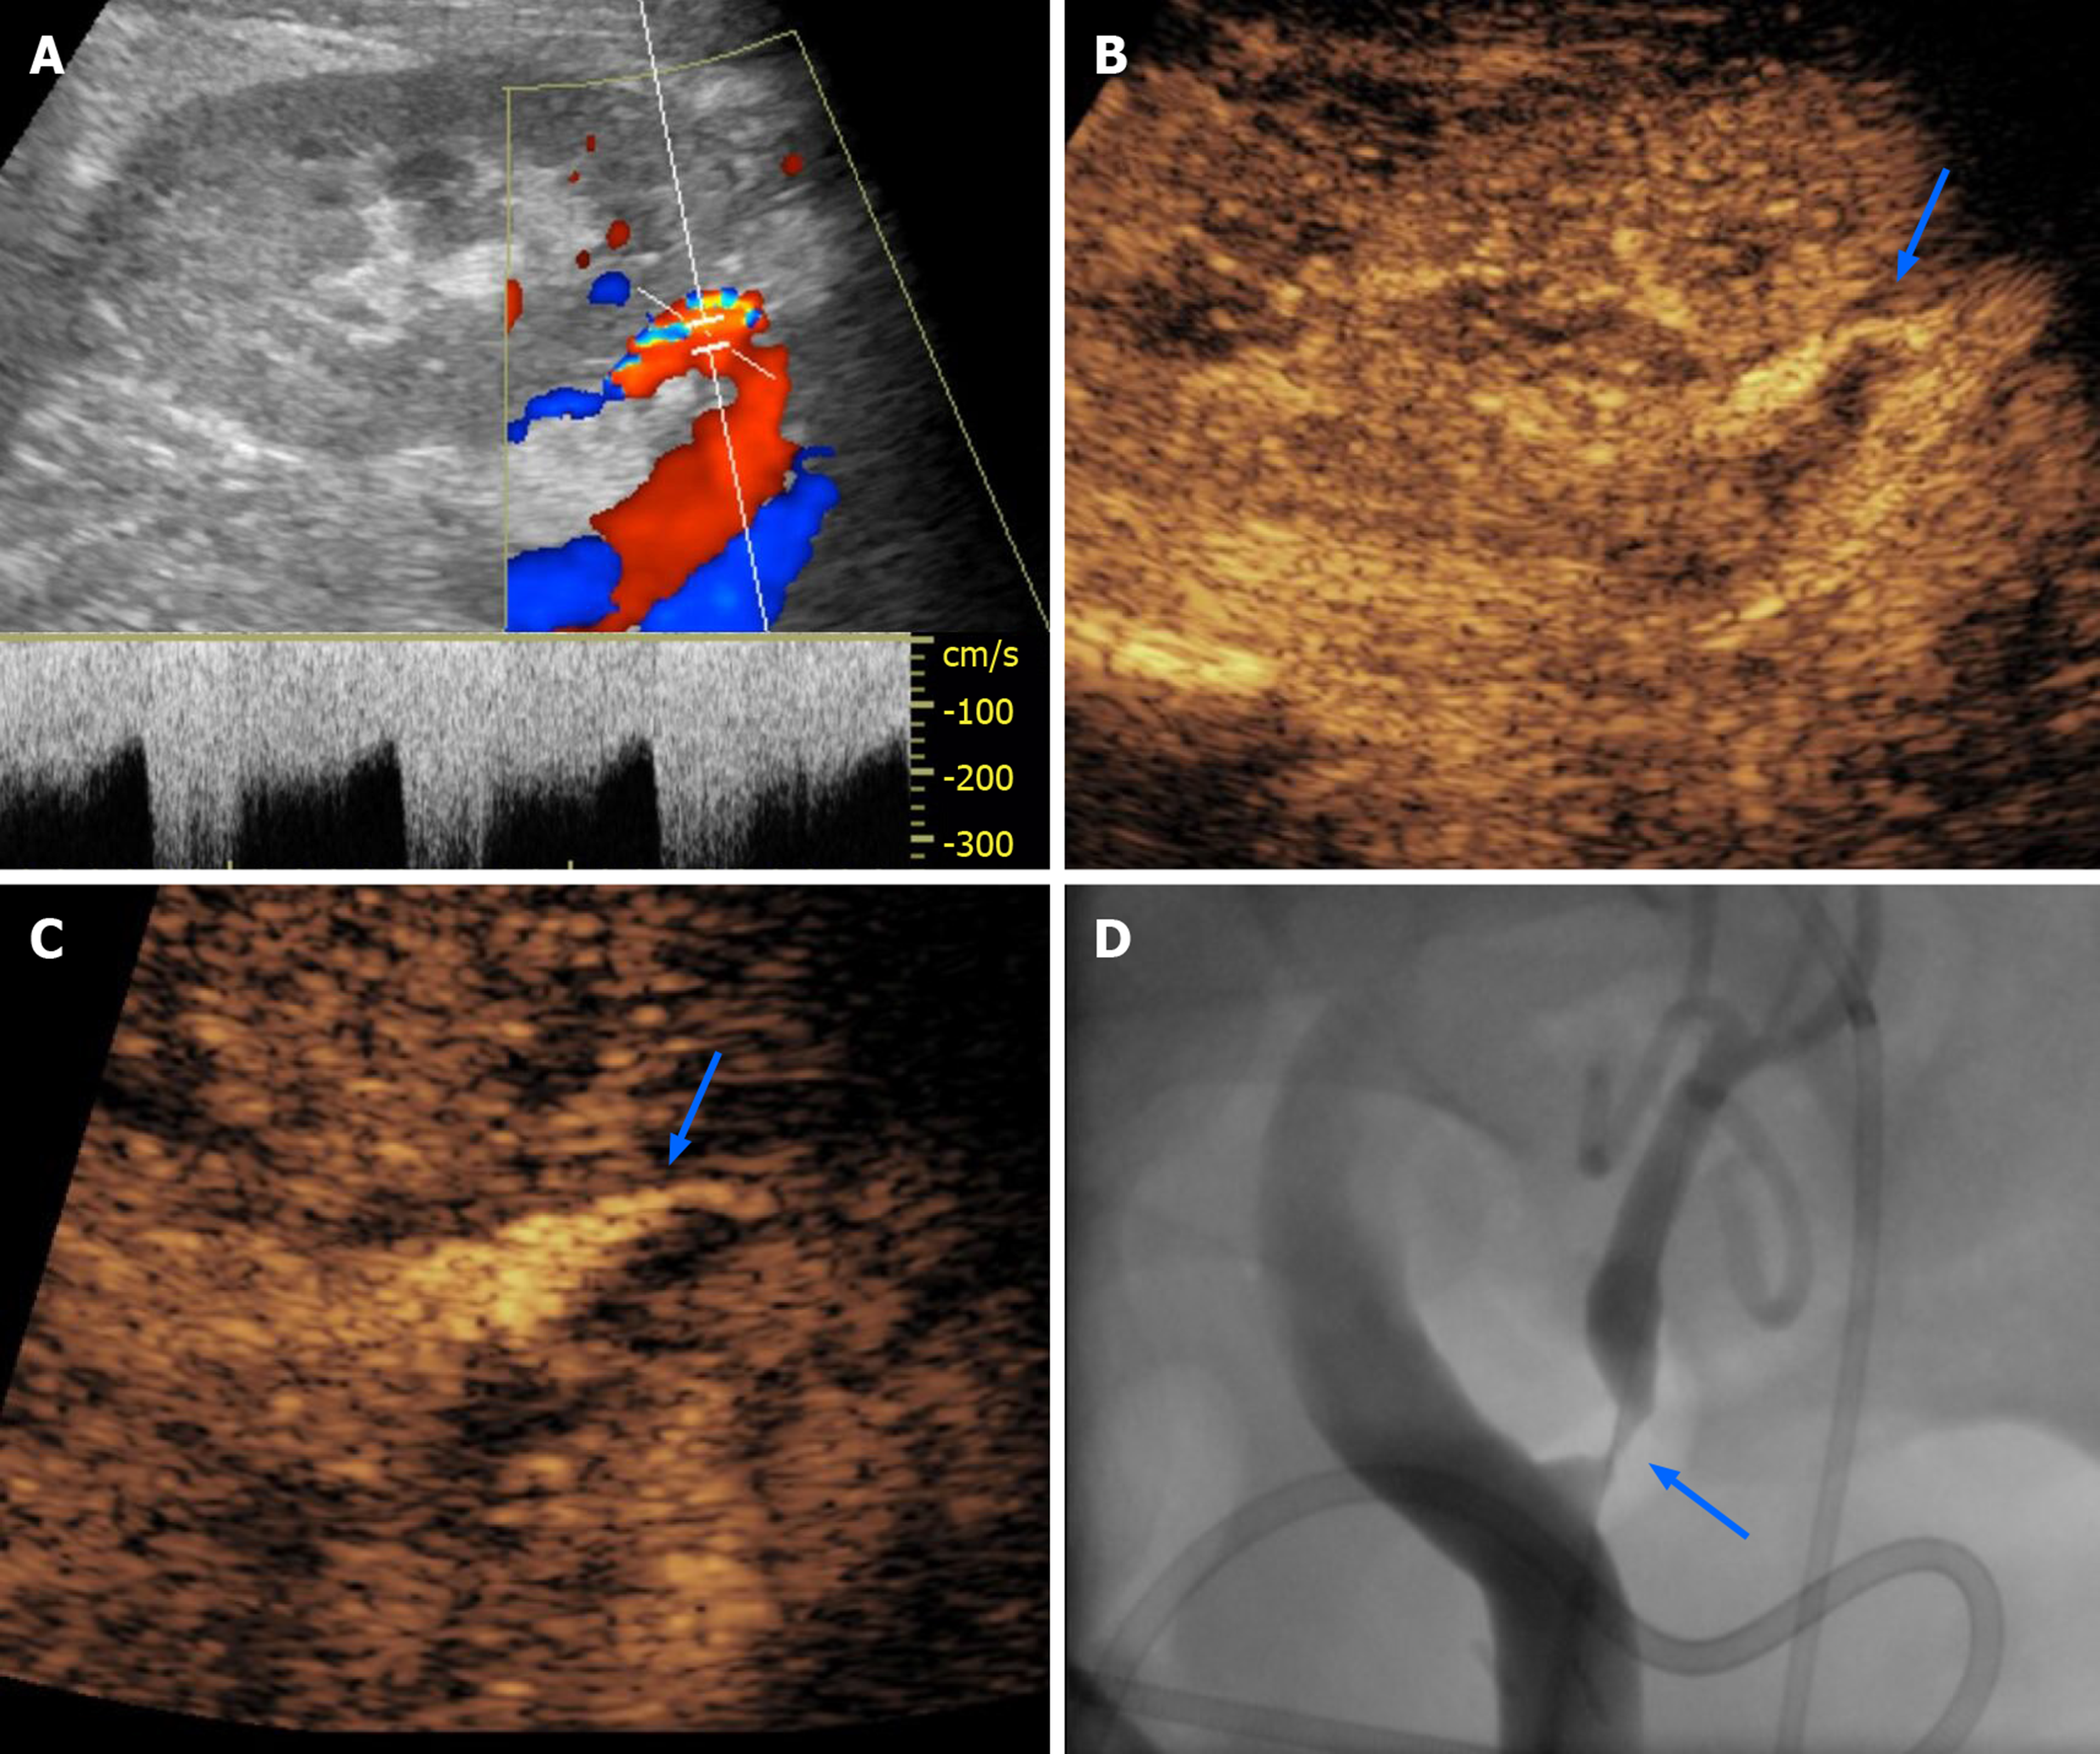
Figure 2 Transplant renal artery stenosis in a 30-year-old man with graft dysfunction, 1 year after cadaveric kidney transplantation.
A: Color Doppler analysis of transplant renal artery (TRA) showed aliasing artifact and increased systolic pick velocity (300 cm/s); B-D: After the administration of an ultrasound contrast agent, there was better evidence of focal thinning of the TRA lumen (arrow in B), as evident on a magnified image (arrow in C) and subsequent digital subtraction angiography (arrow in D) performed for interventional purposes.
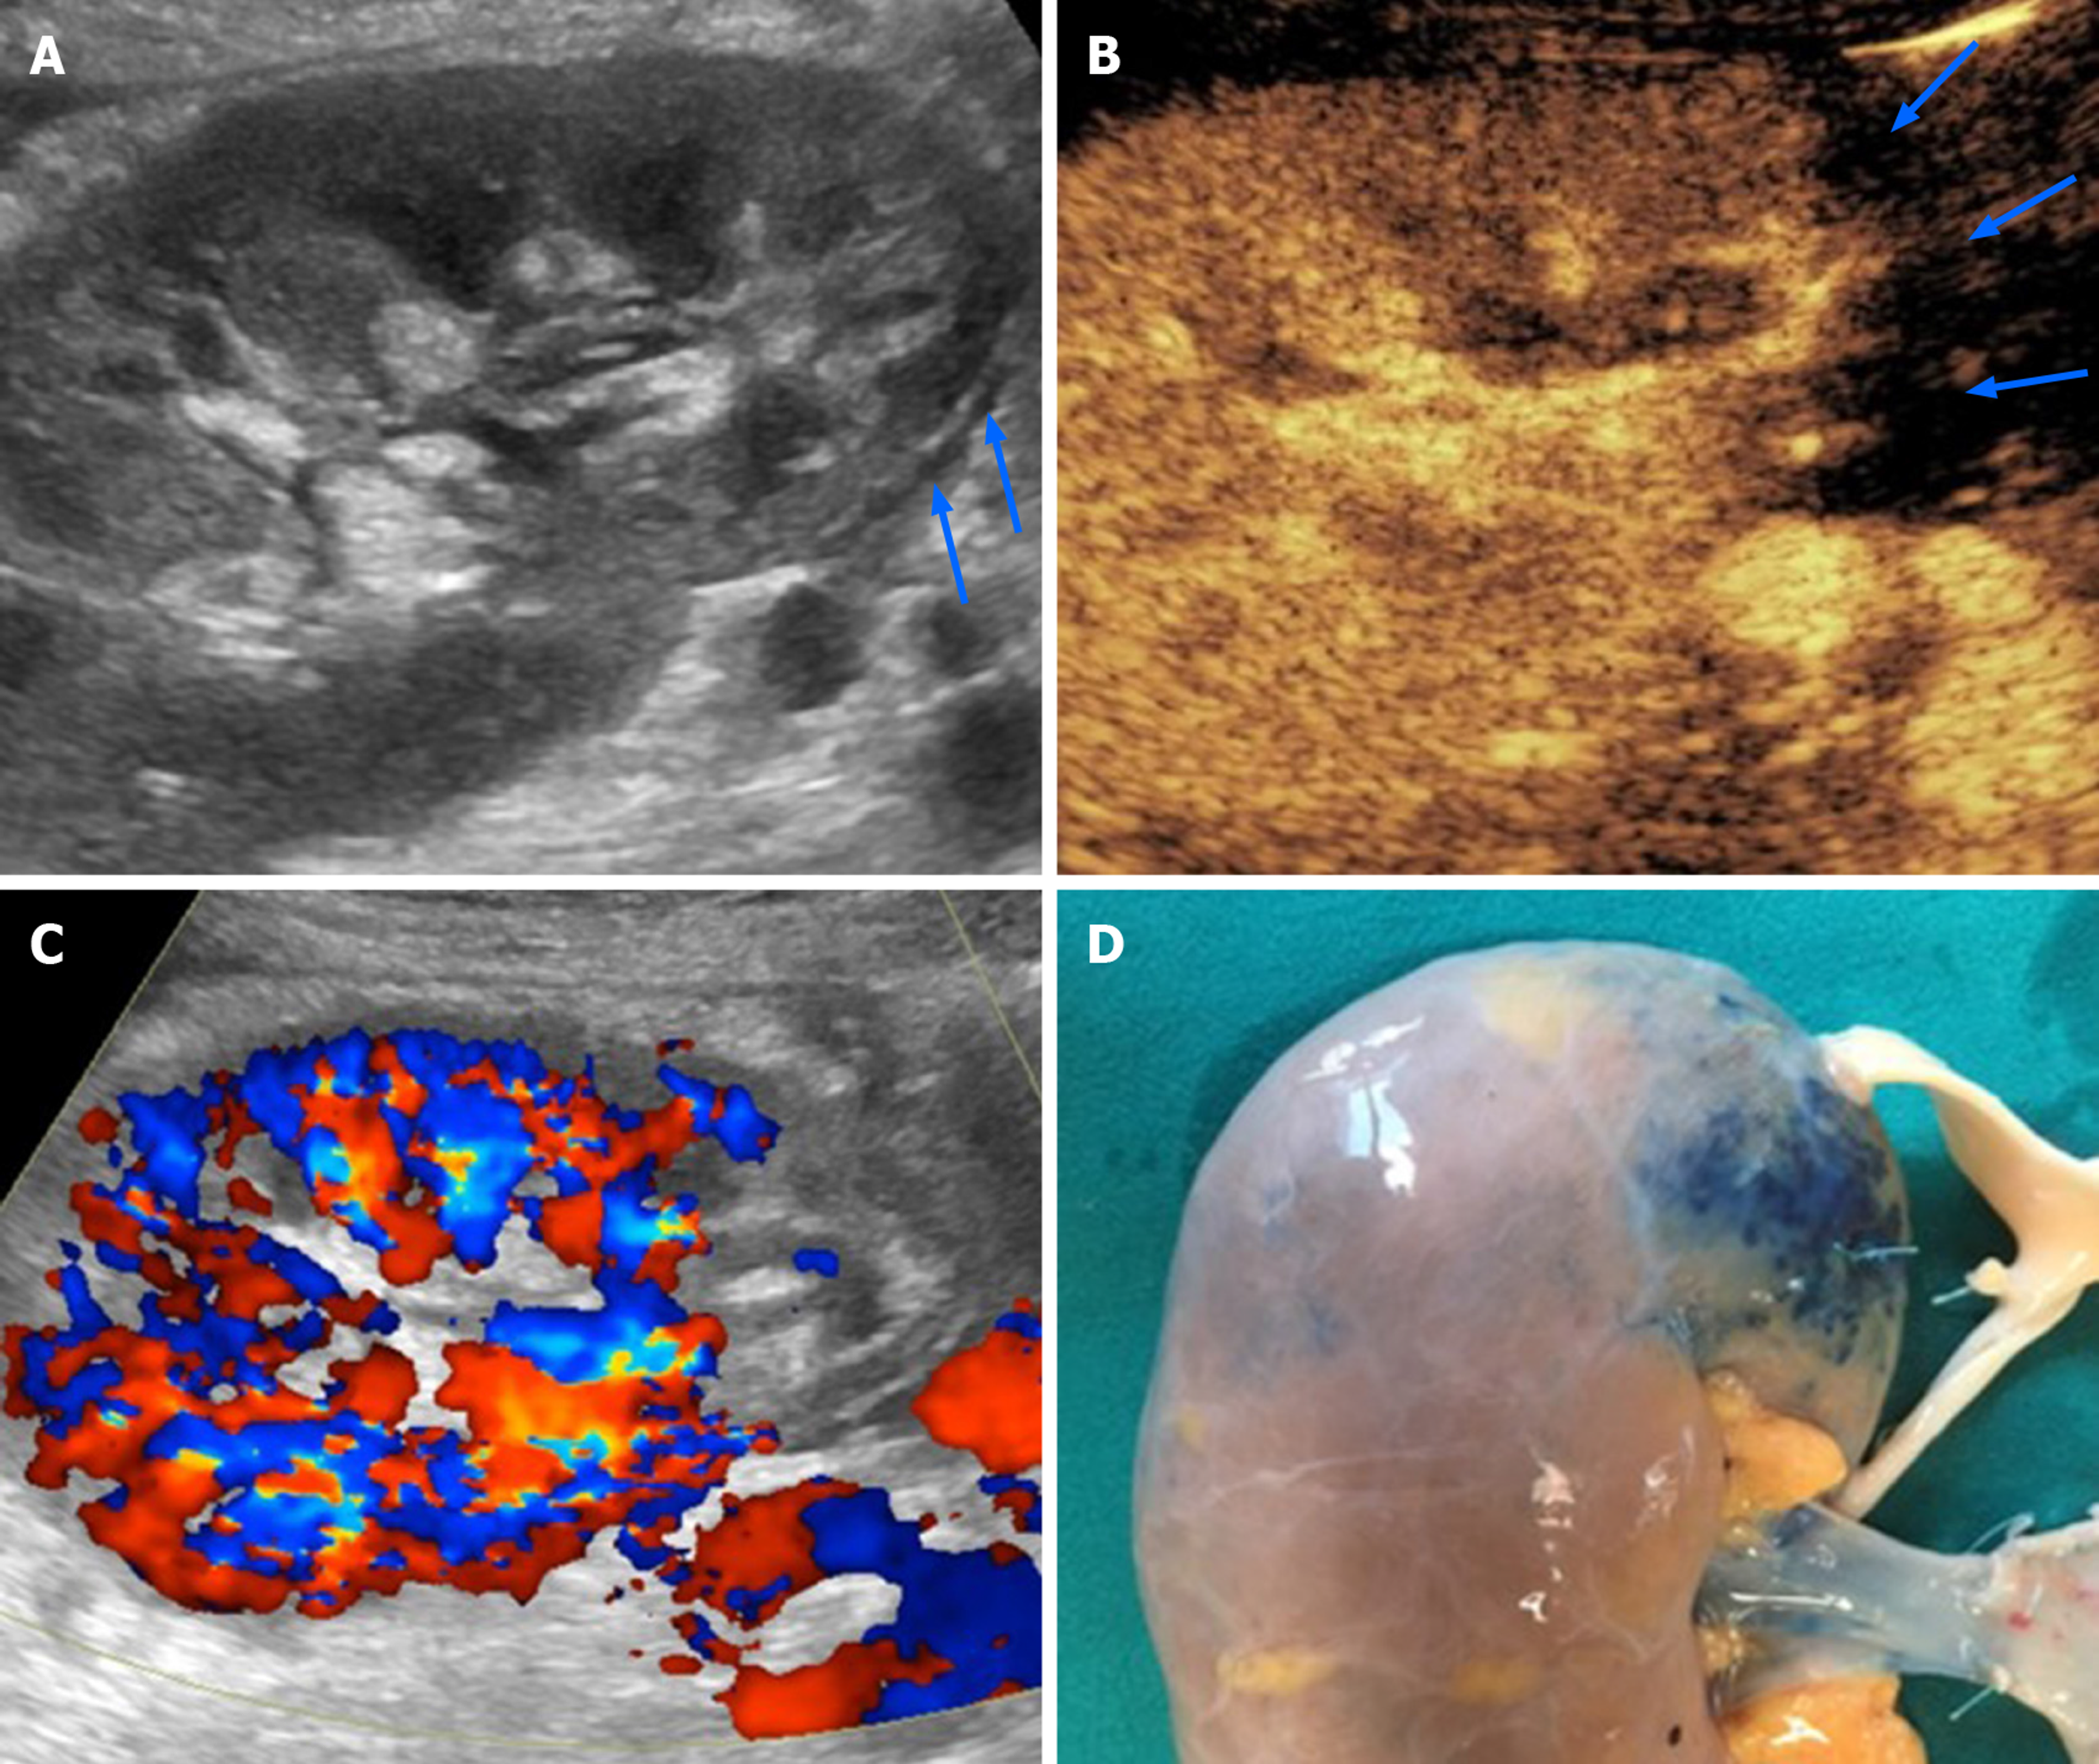
Figure 3 Renal infarction occurring 4 d after cadaveric kidney transplantation in a 53-year-old patient with early renal graft dysfunction.
A and B: Grayscale ultrasound found an area of patchy echotexture (arrows in A) showing absent perfusion on contrast-enhanced ultrasound pulse inversion mode (arrows in B); C: Of note, contrast administration enhanced color signal, thus making this area clearly visible even with this technique; D: Infarction reasonably occurred in the blue-marked area in the pre-transplant image of the graft. This area was served by a small polar artery for which anastomosis was impossible.
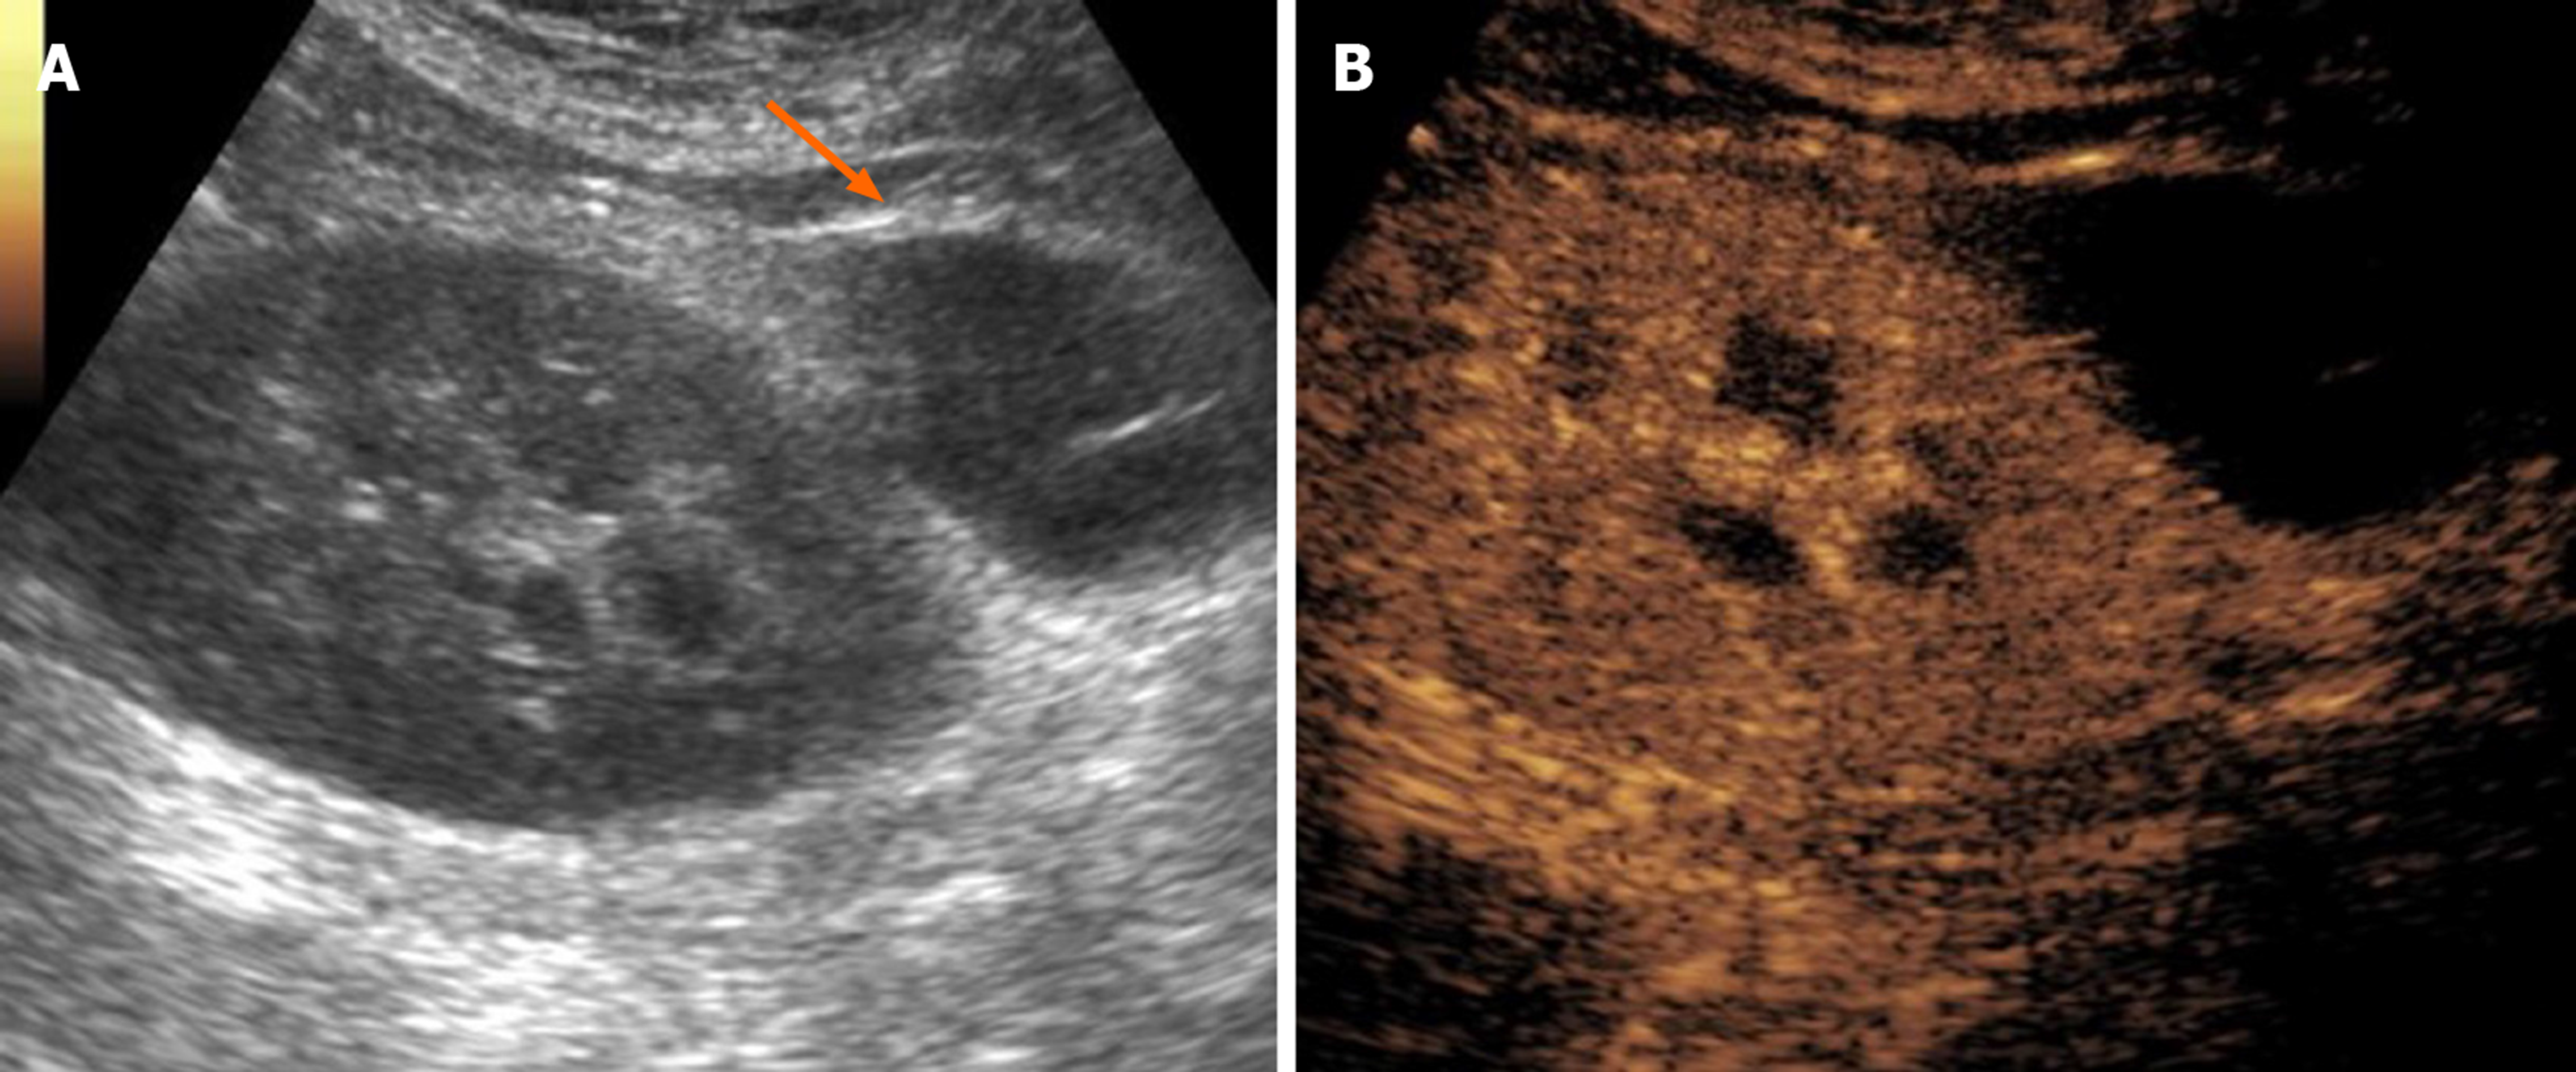
Figure 4 Postoperative lymphocele in a 62-year-old patient who underwent cadaveric kidney transplantation for end-stage renal disease.
A: On B-mode ultrasound, lymphocele was visible as an anechoic collection in the perirenal space (arrow), close to the external iliac vessels of the donor; B: Contrast injection reinforced diagnosis by showing absent vascularization and improved conspicuity with better delineation of the collection size and anatomical relationships.
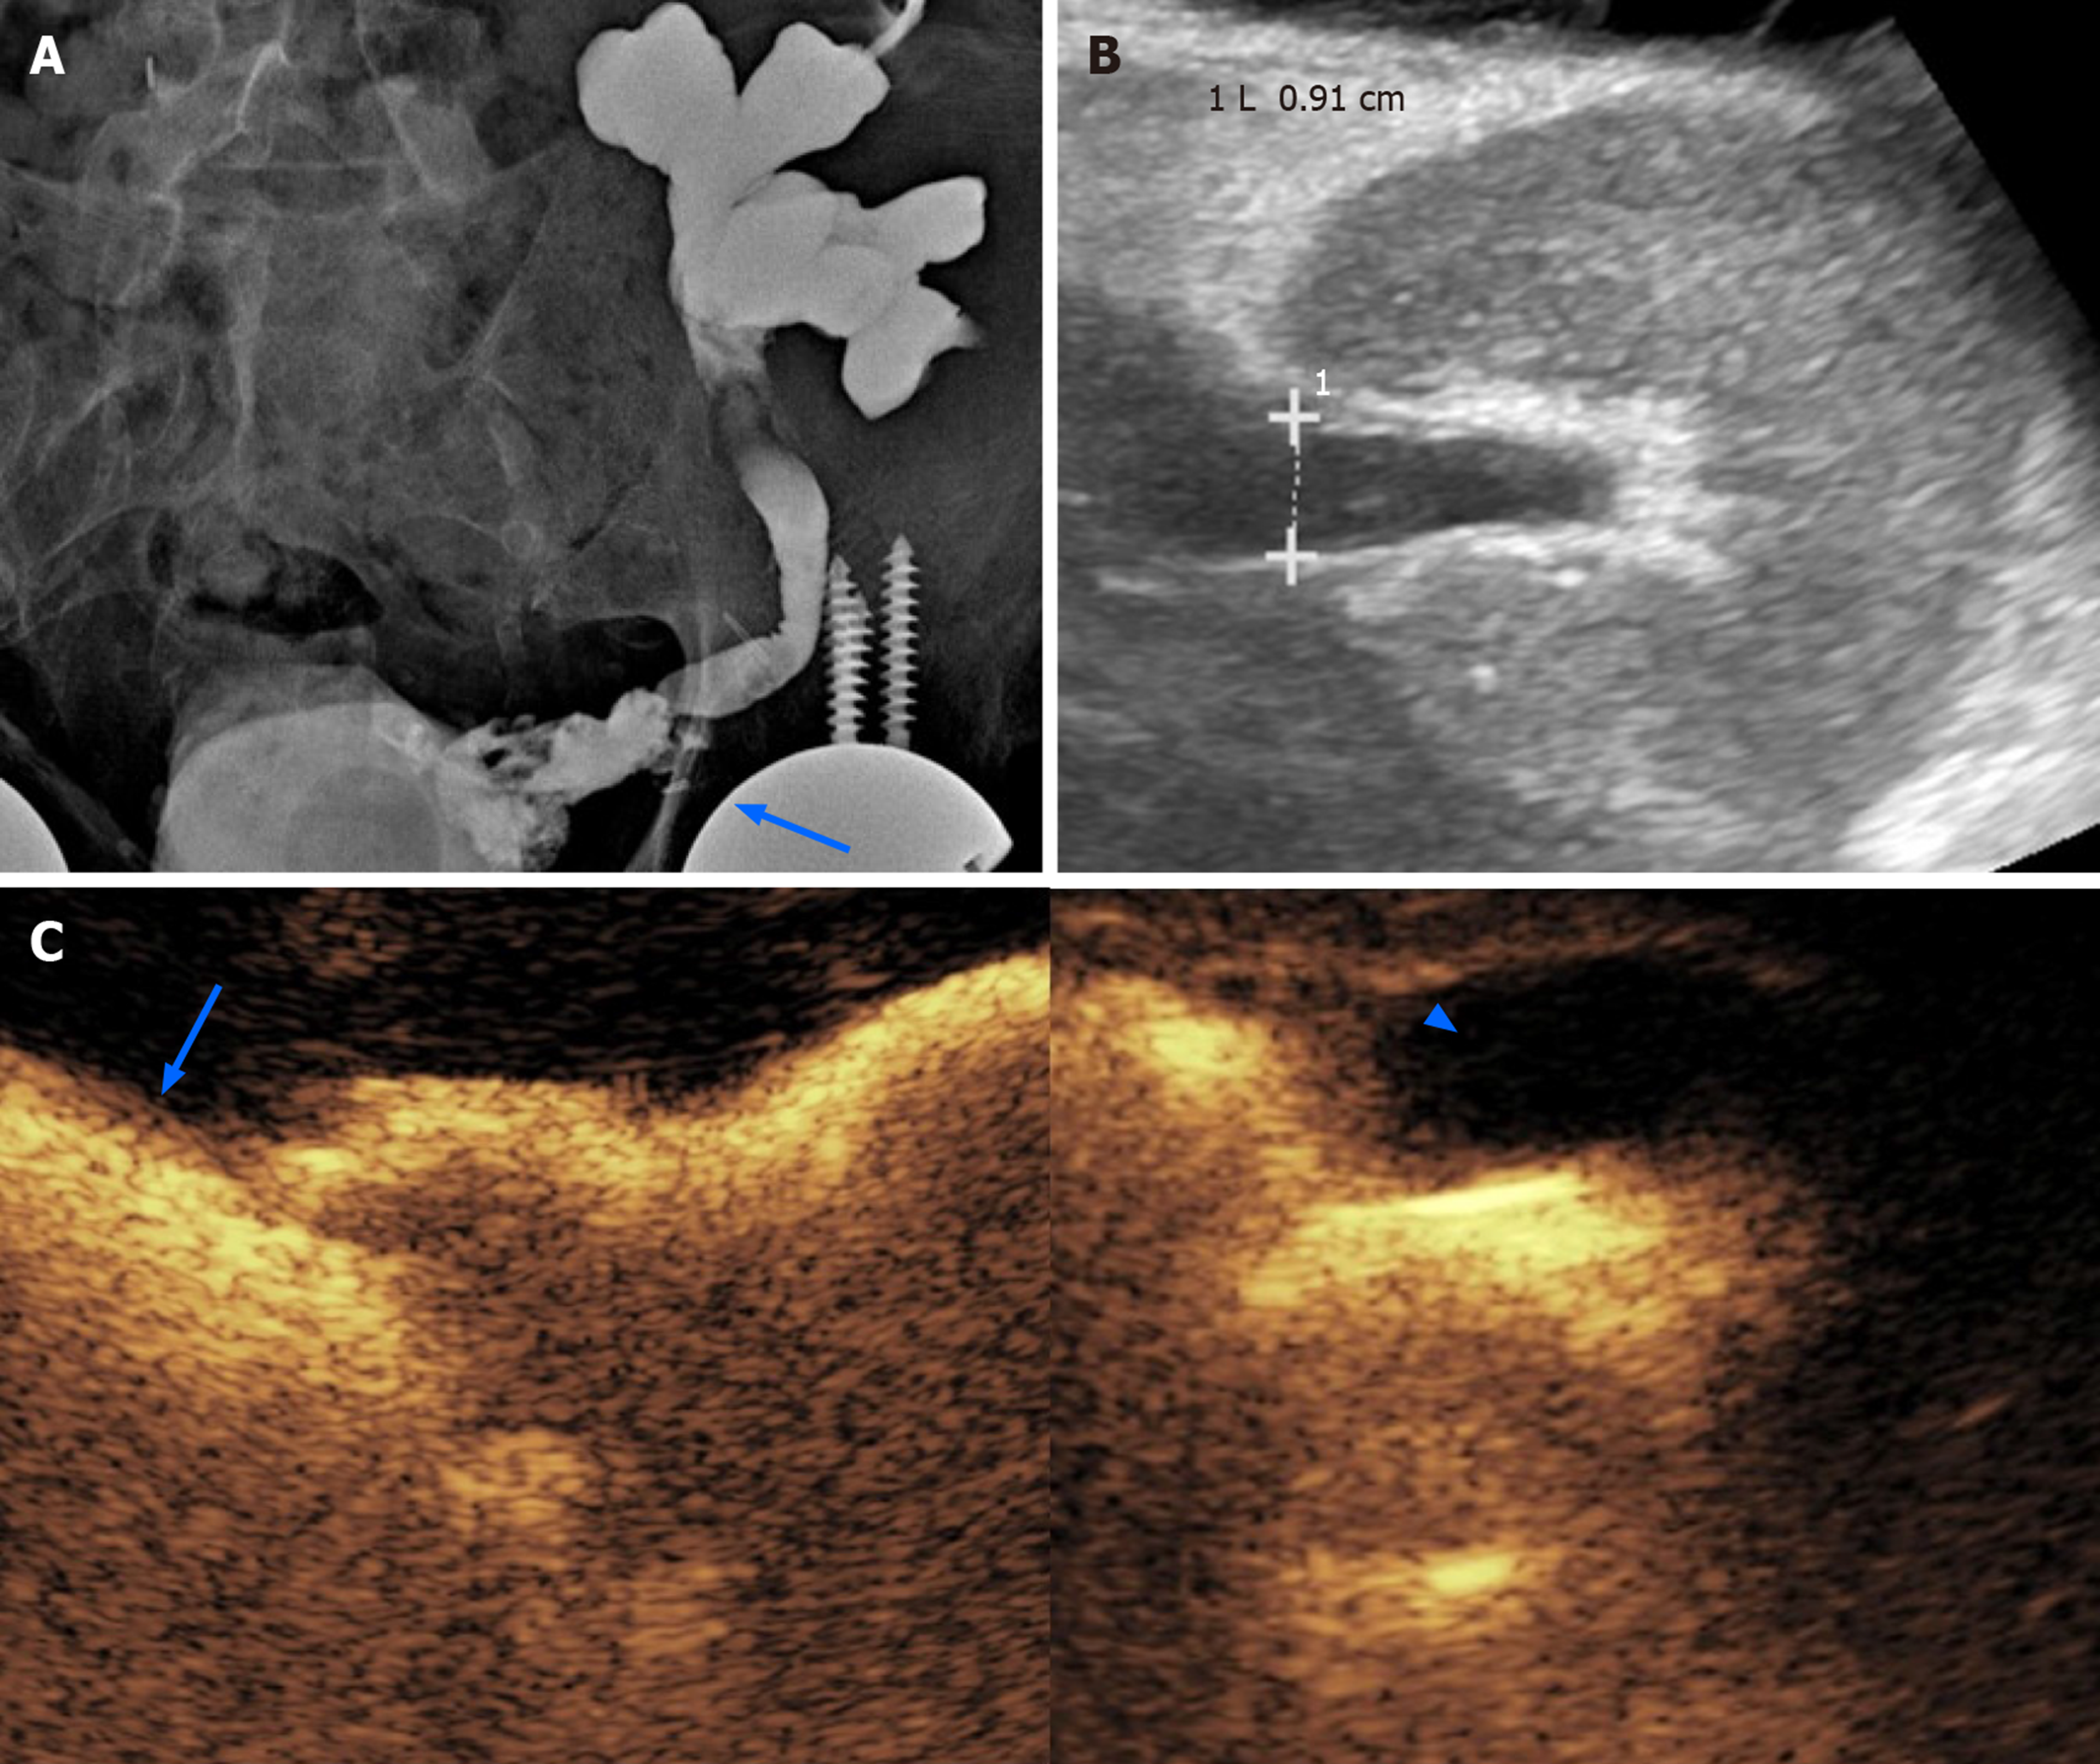
Figure 5 Obstructive renal failure occurring 3 mo after the transplantation in a 62-year-old male patient.
A: A preliminary X-ray nephrostogram showed hydronephrosis with a suspicious urinary leakage at the vesico-ureteral anastomosis (arrow); B: After a conservative management of a few days, the patient was revaluated with grayscale ultrasound, showing reduced hydronephrosis; C: Subsequent contrast-enhanced ultrasound (CEUS)-nephrostogram allowed a panoramic representation of the non-dilated excretory system from the graft (arrowhead) to the bladder (arrow). Based on the resolution of dilation found on CEUS, nephrostomy was successfully removed.
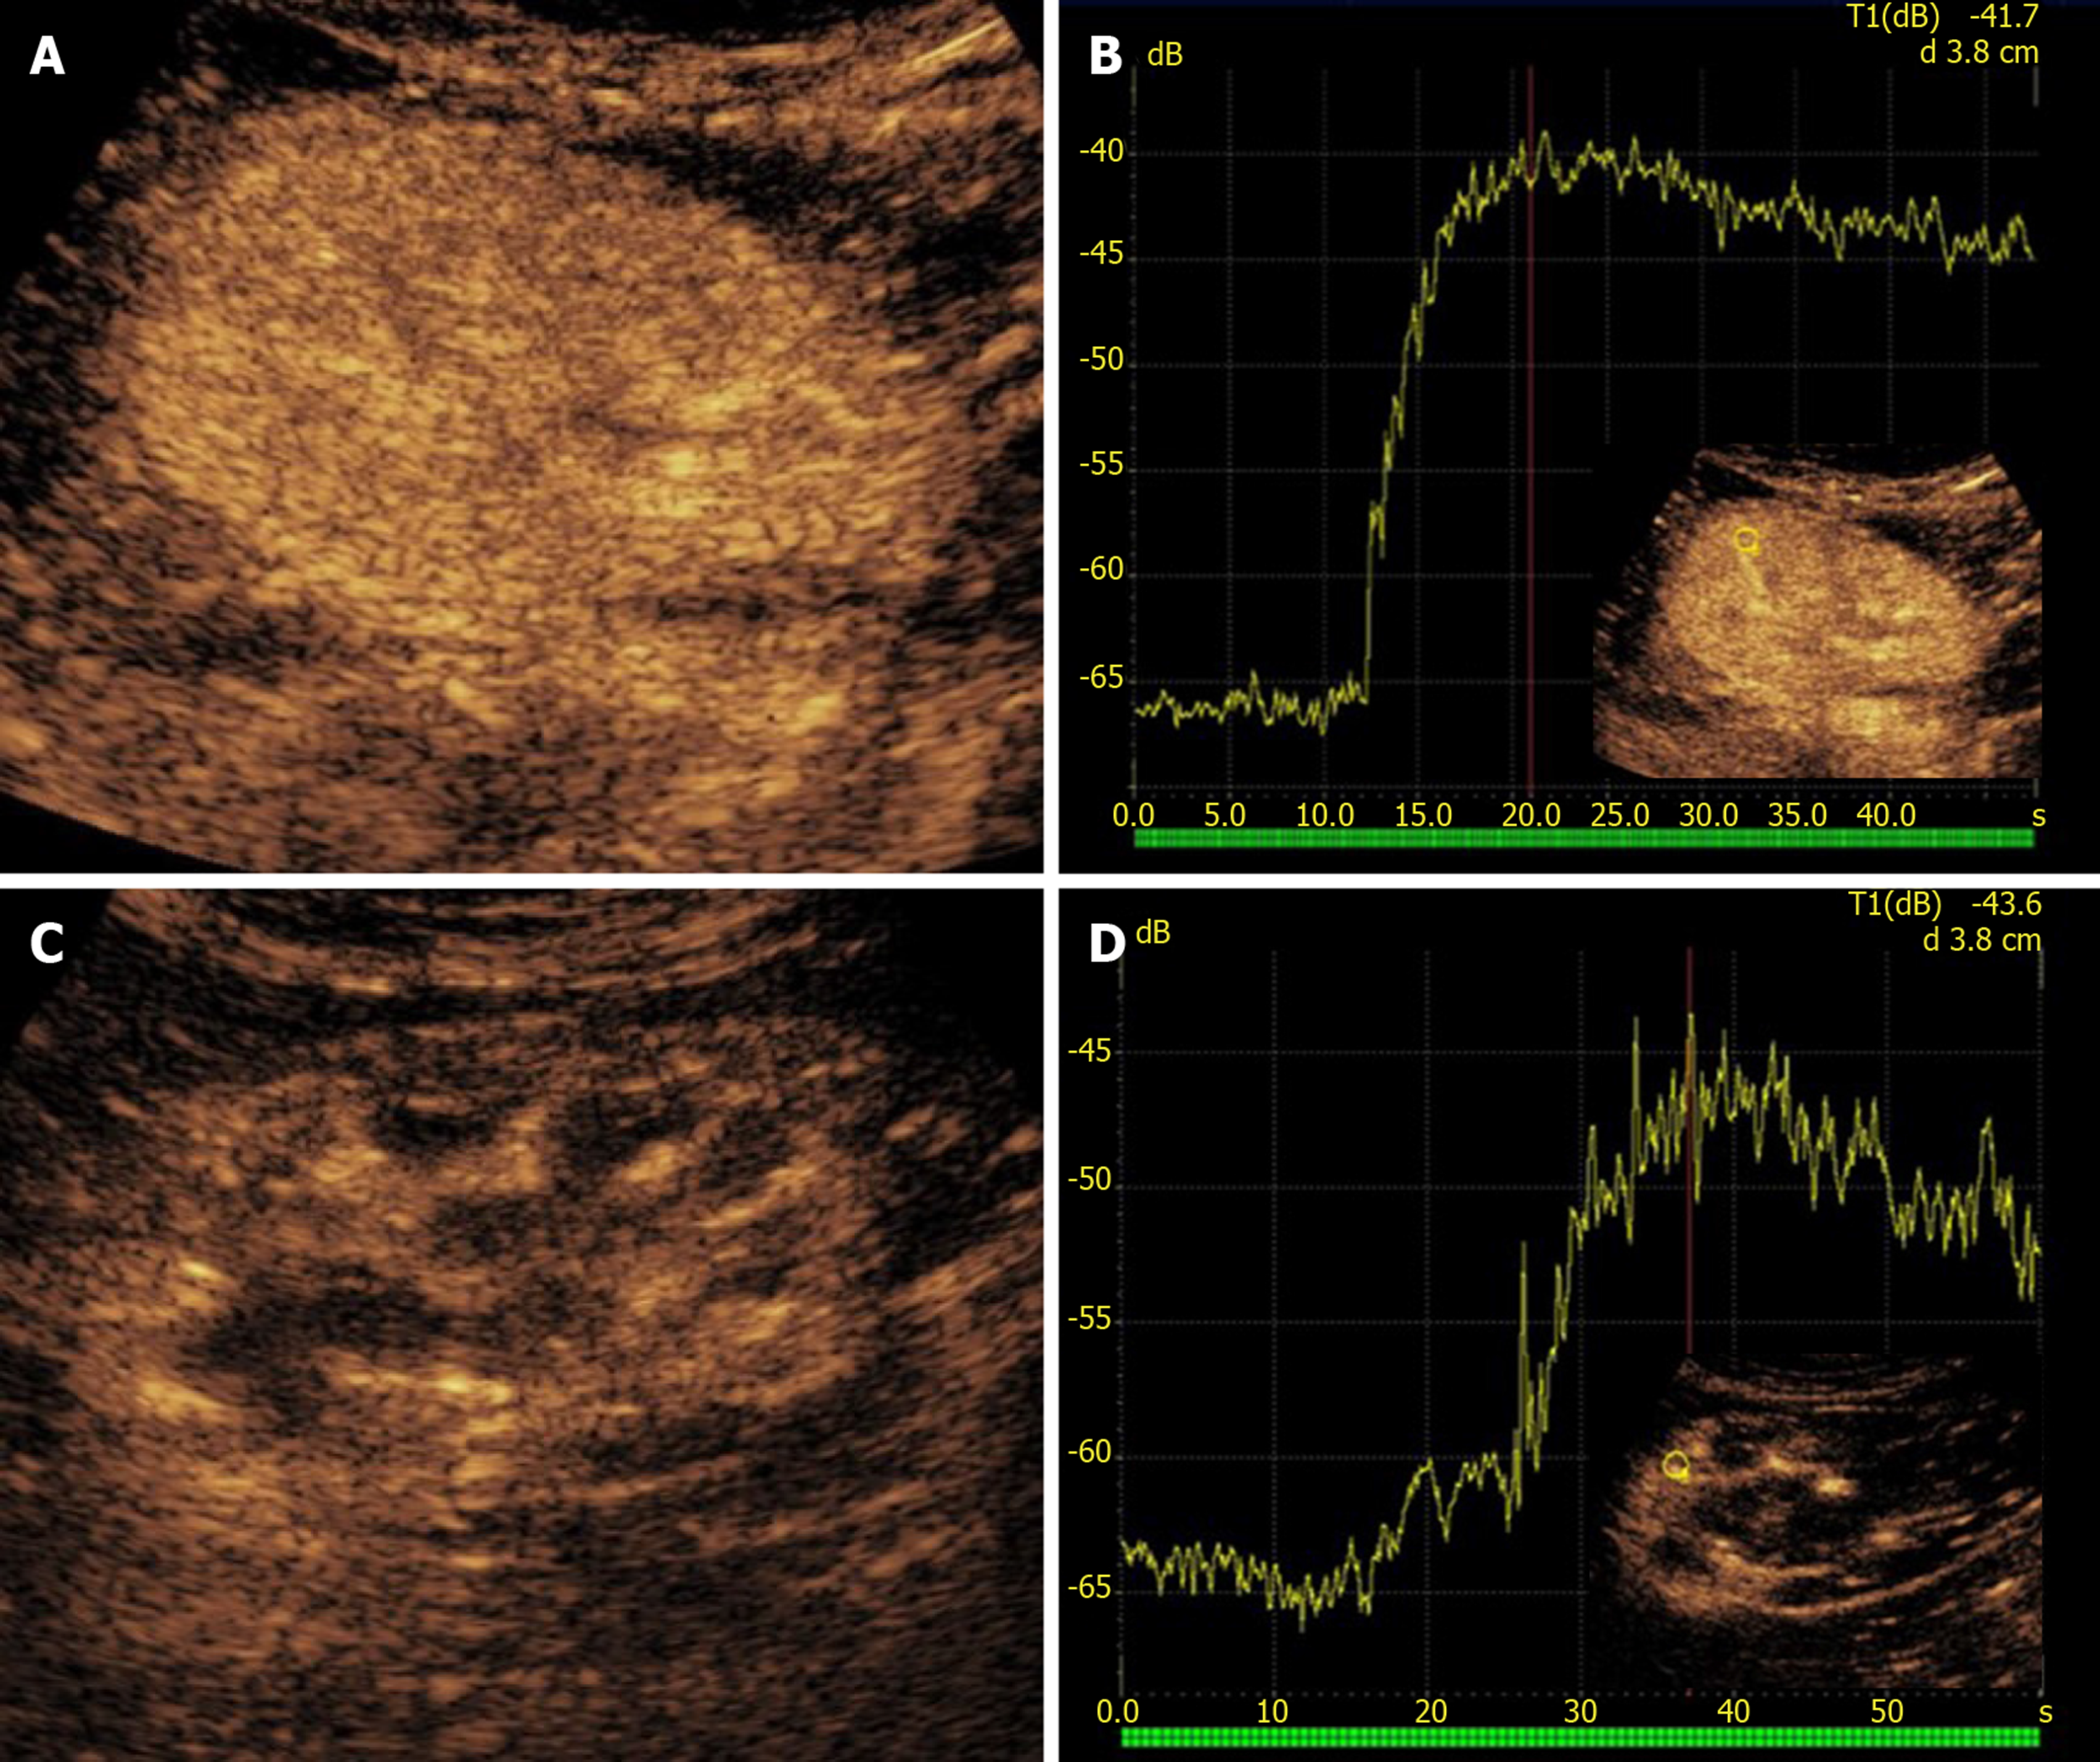
Figure 6 Rejection in a 58-year-old man who underwent two different renal transplants with a 4-year interval.
A and B: After 1 mo from kidney transplantation, the left-sided retransplanted kidney showed homogeneous parenchymal enhancement on contrast-enhanced ultrasound (CEUS) examination (A), with rapid time-to-peak on the corresponding time-intensity curve (B); C: The contralateral first kidney in the right iliac fossa was affected by chronic rejection. D: CEUS showed weaker and inhomogeneous contrast enhancement as compared to the left-sided graft, with lower and delayed peak of contrast enhancement.
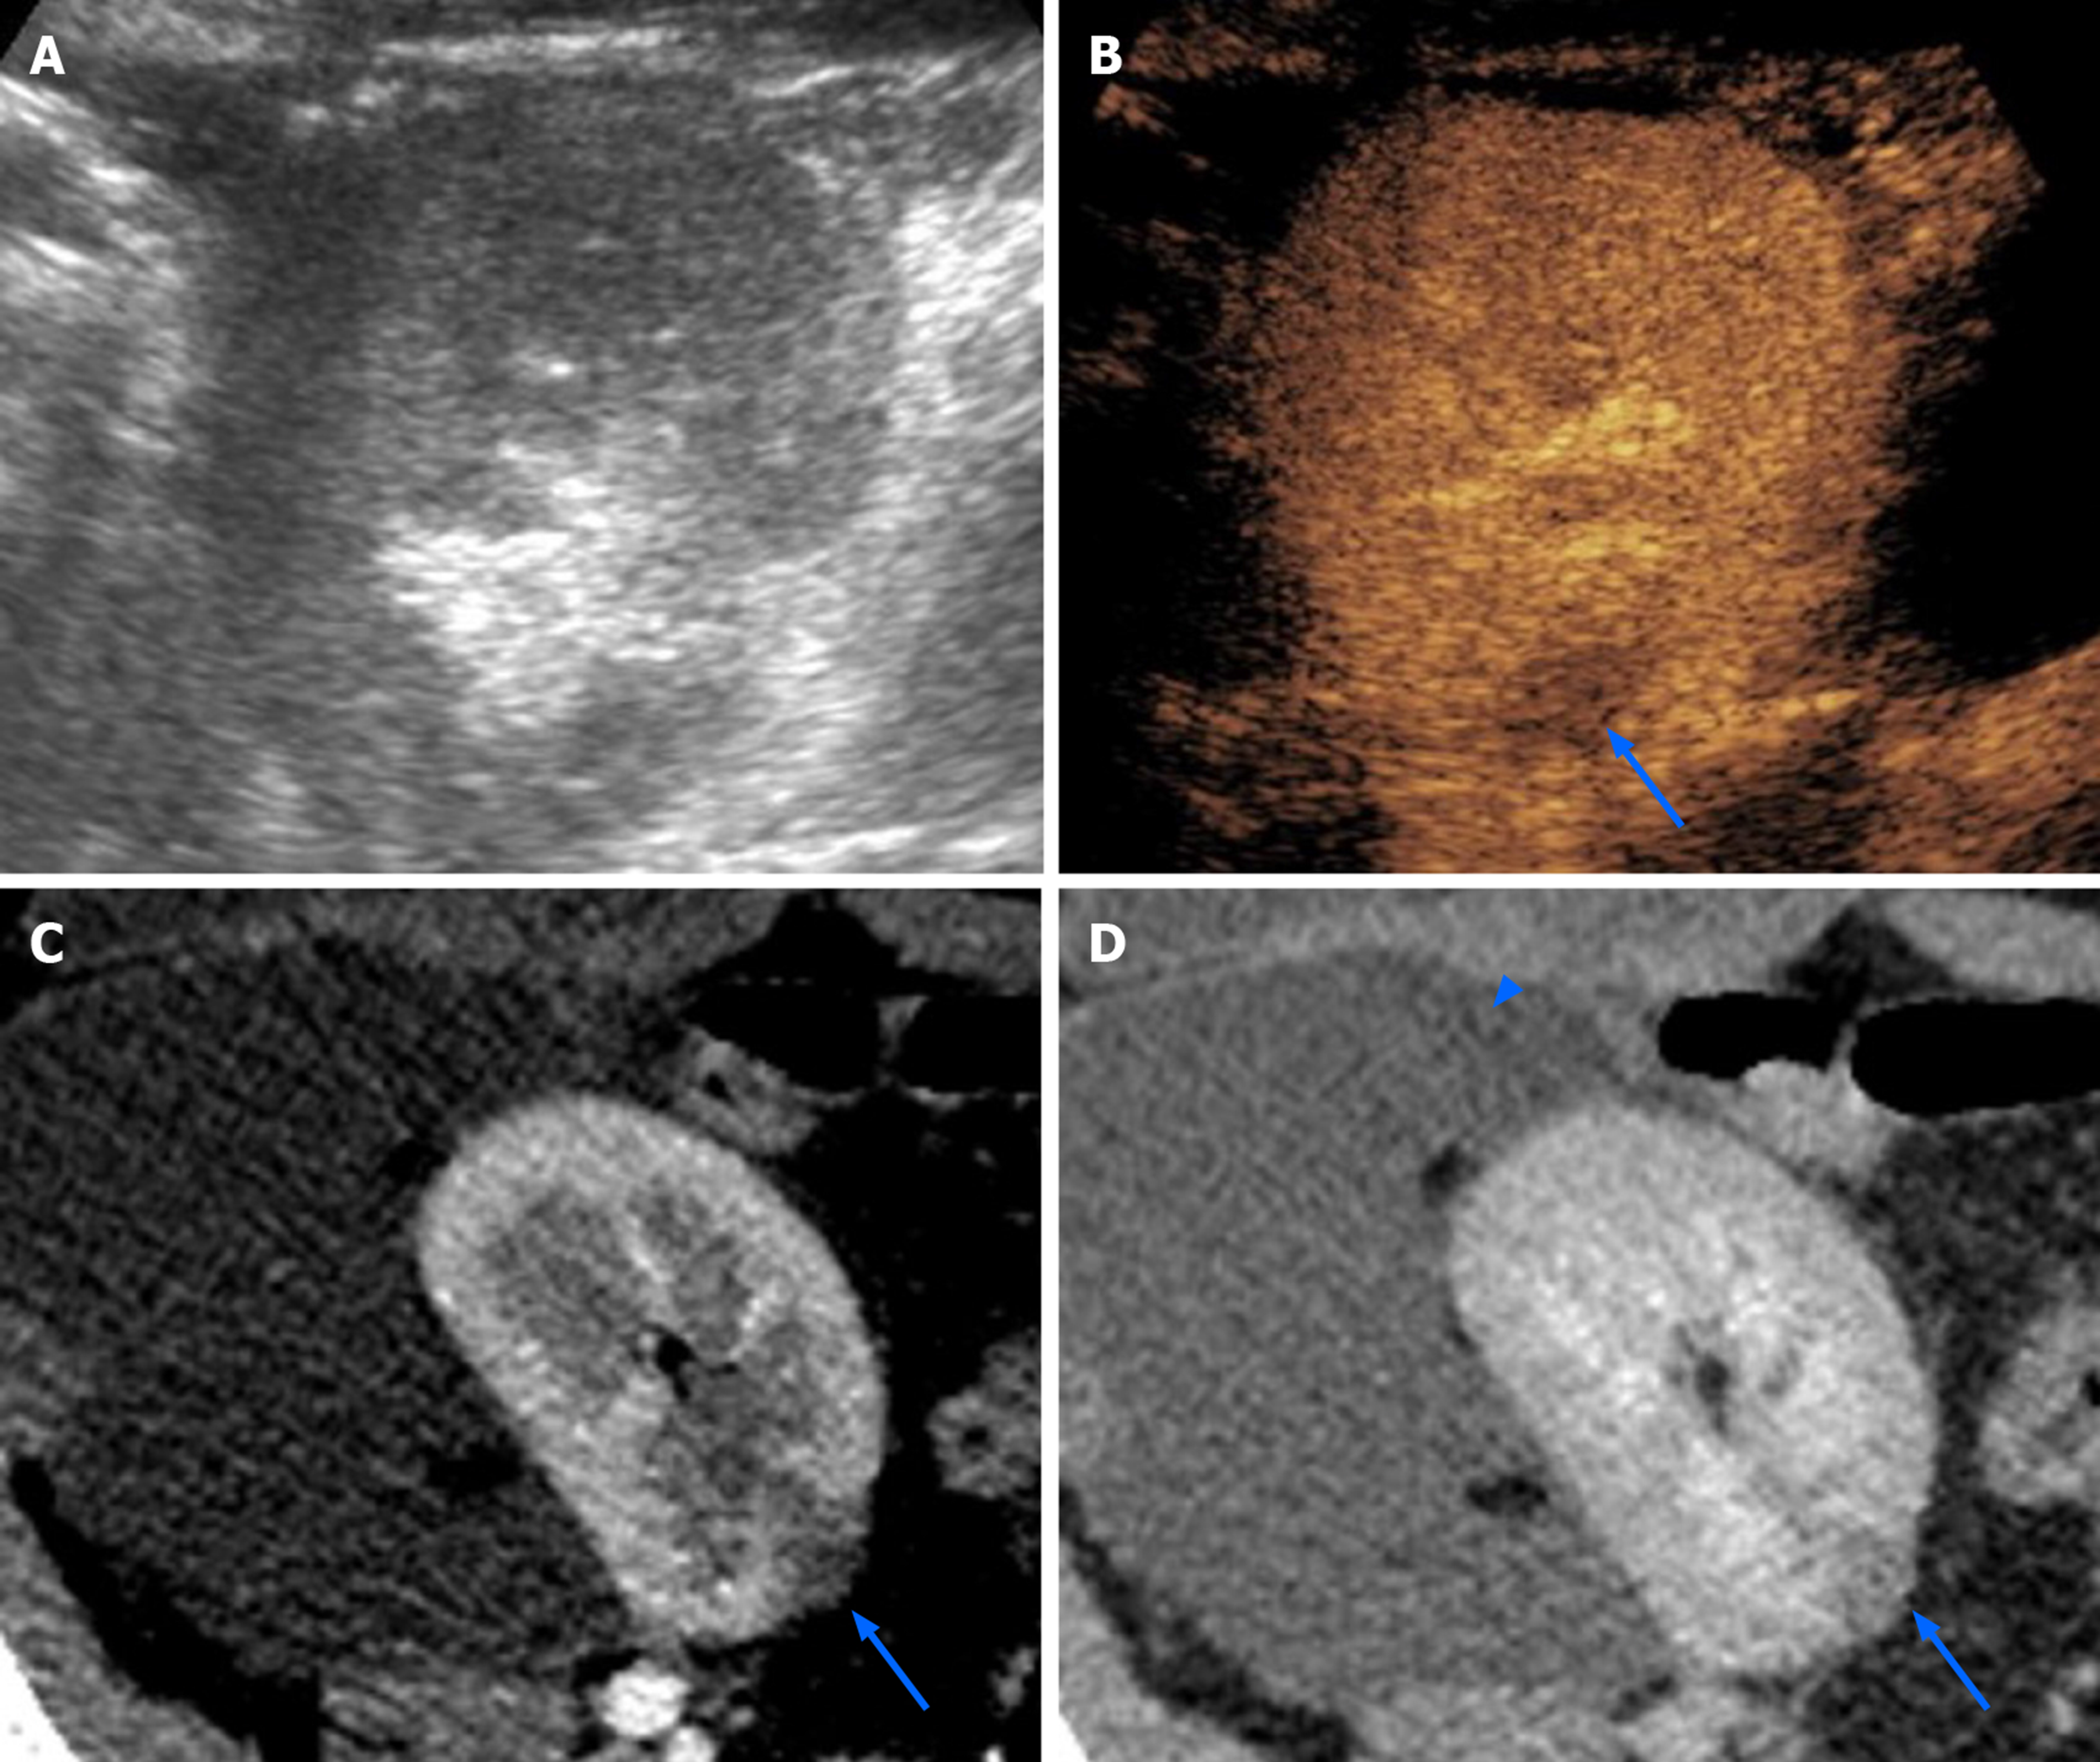
Figure 7 Focal pyelonephritis occurring 50 d after kidney transplantation in a 34-year-old female patient.
While grayscale ultrasound found no abnormalities (A), contrast-enhanced ultrasound revealed a focal hypoperfused area (arrow in B) that was subsequently confirmed on both corticomedullary phase (arrow in C) and nephrographic phase (arrow in D) of a computed tomography performed to assess a large symptomatic perirenal collection (arrowhead in D).
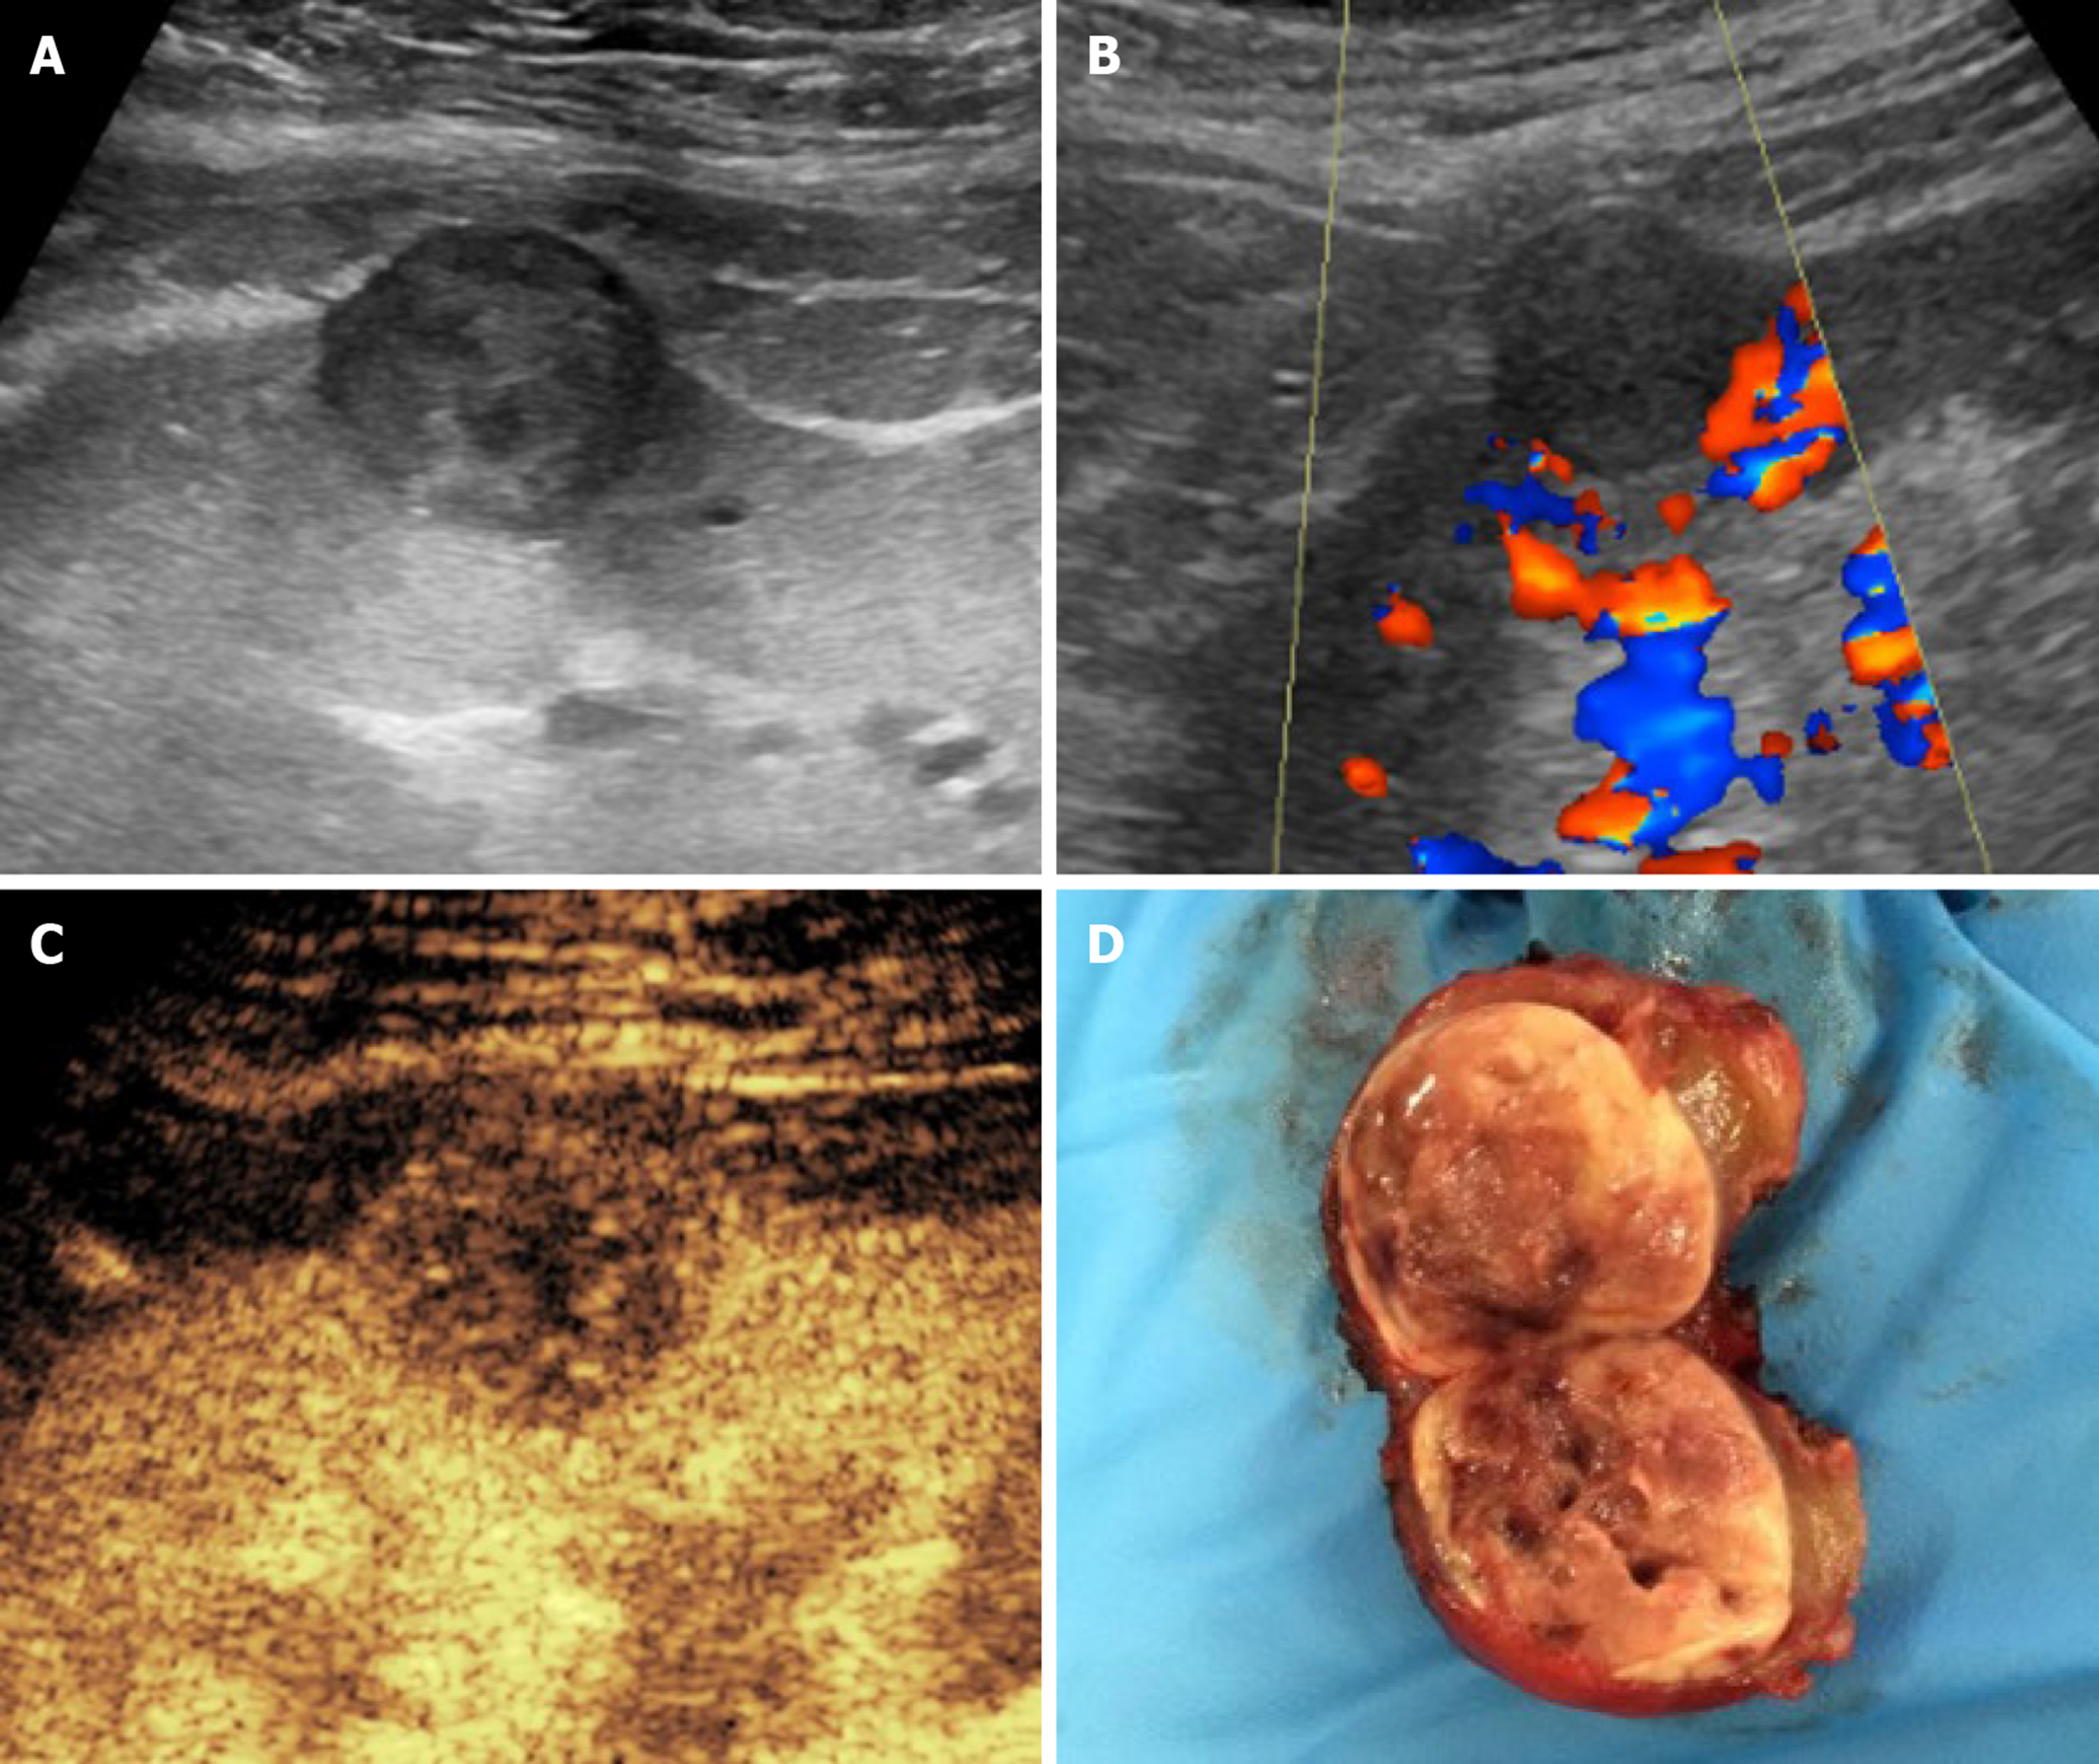
Figure 8 Histologically-proven papillary carcinoma in a 57-year-old male patient with previous kidney transplantation and impaired renal function.
A and B: On grayscale ultrasound (A) the lesion appeared as a hypoechoic cortical mass with absent vascular signal at color analysis (B); C: Contrast-enhanced ultrasound better assessed the solid nature of the mass by showing lower lesion vascularization as compared to normal graft parenchyma; D: The patient was referred to surgery without the need of performing computed tomography or magnetic resonance imaging.
- Citation: Como G, Da Re J, Adani GL, Zuiani C, Girometti R. Role for contrast-enhanced ultrasound in assessing complications after kidney transplant. World J Radiol 2020; 12(8): 156-171
- URL: https://www.wjgnet.com/1949-8470/full/v12/i8/156.htm
- DOI: https://dx.doi.org/10.4329/wjr.v12.i8.156


