Copyright
©The Author(s) 2020.
World J Radiology. Mar 28, 2020; 12(3): 18-28
Published online Mar 28, 2020. doi: 10.4329/wjr.v12.i3.18
Published online Mar 28, 2020. doi: 10.4329/wjr.v12.i3.18
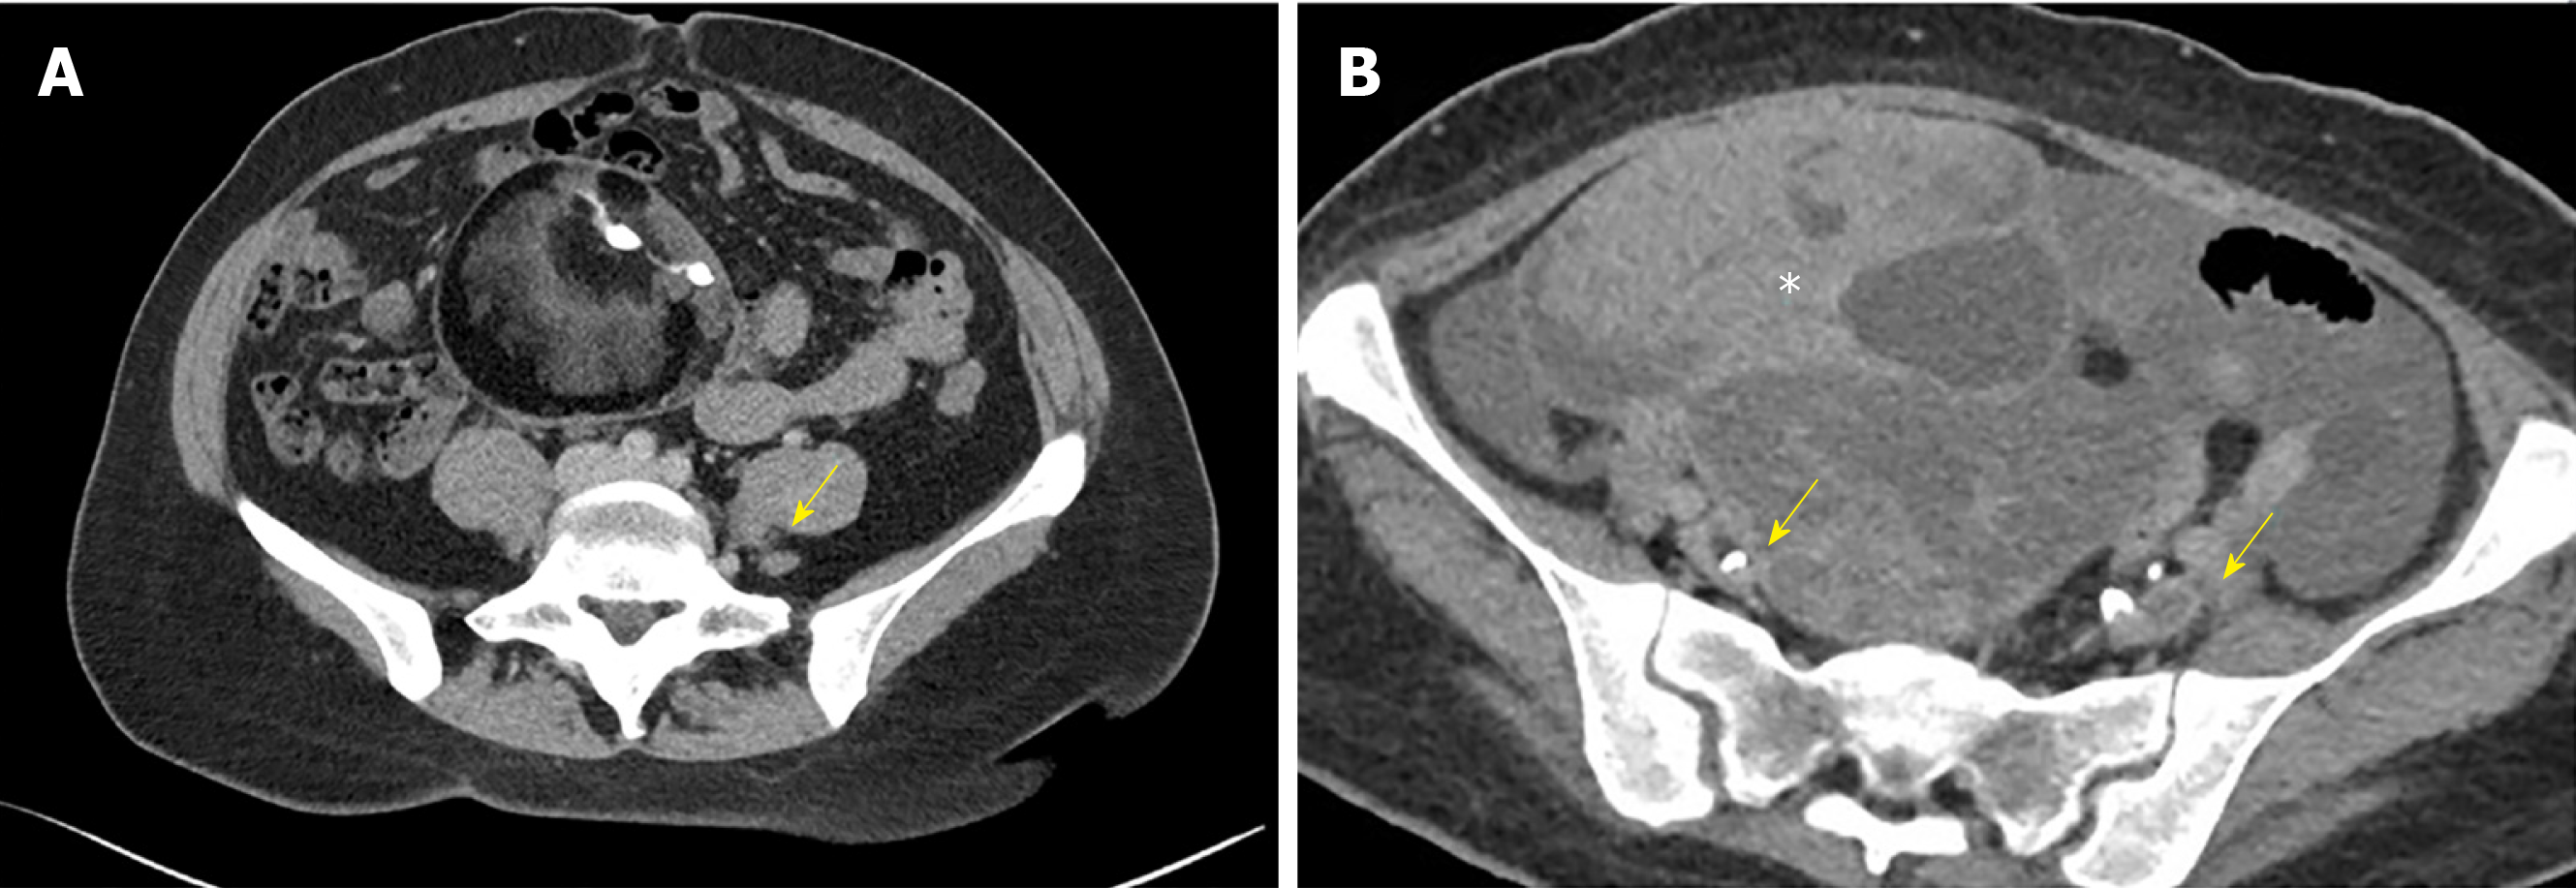
Figure 1 Axial Computed tomography venography image.
A: Axial computed tomography venography image showing compression of the left common iliac vein (arrow) between the right common iliac artery and the lumbar vertebral body; B: Extraluminal compression of the external iliac veins (arrows) from an ovarian tumor (asterixis).
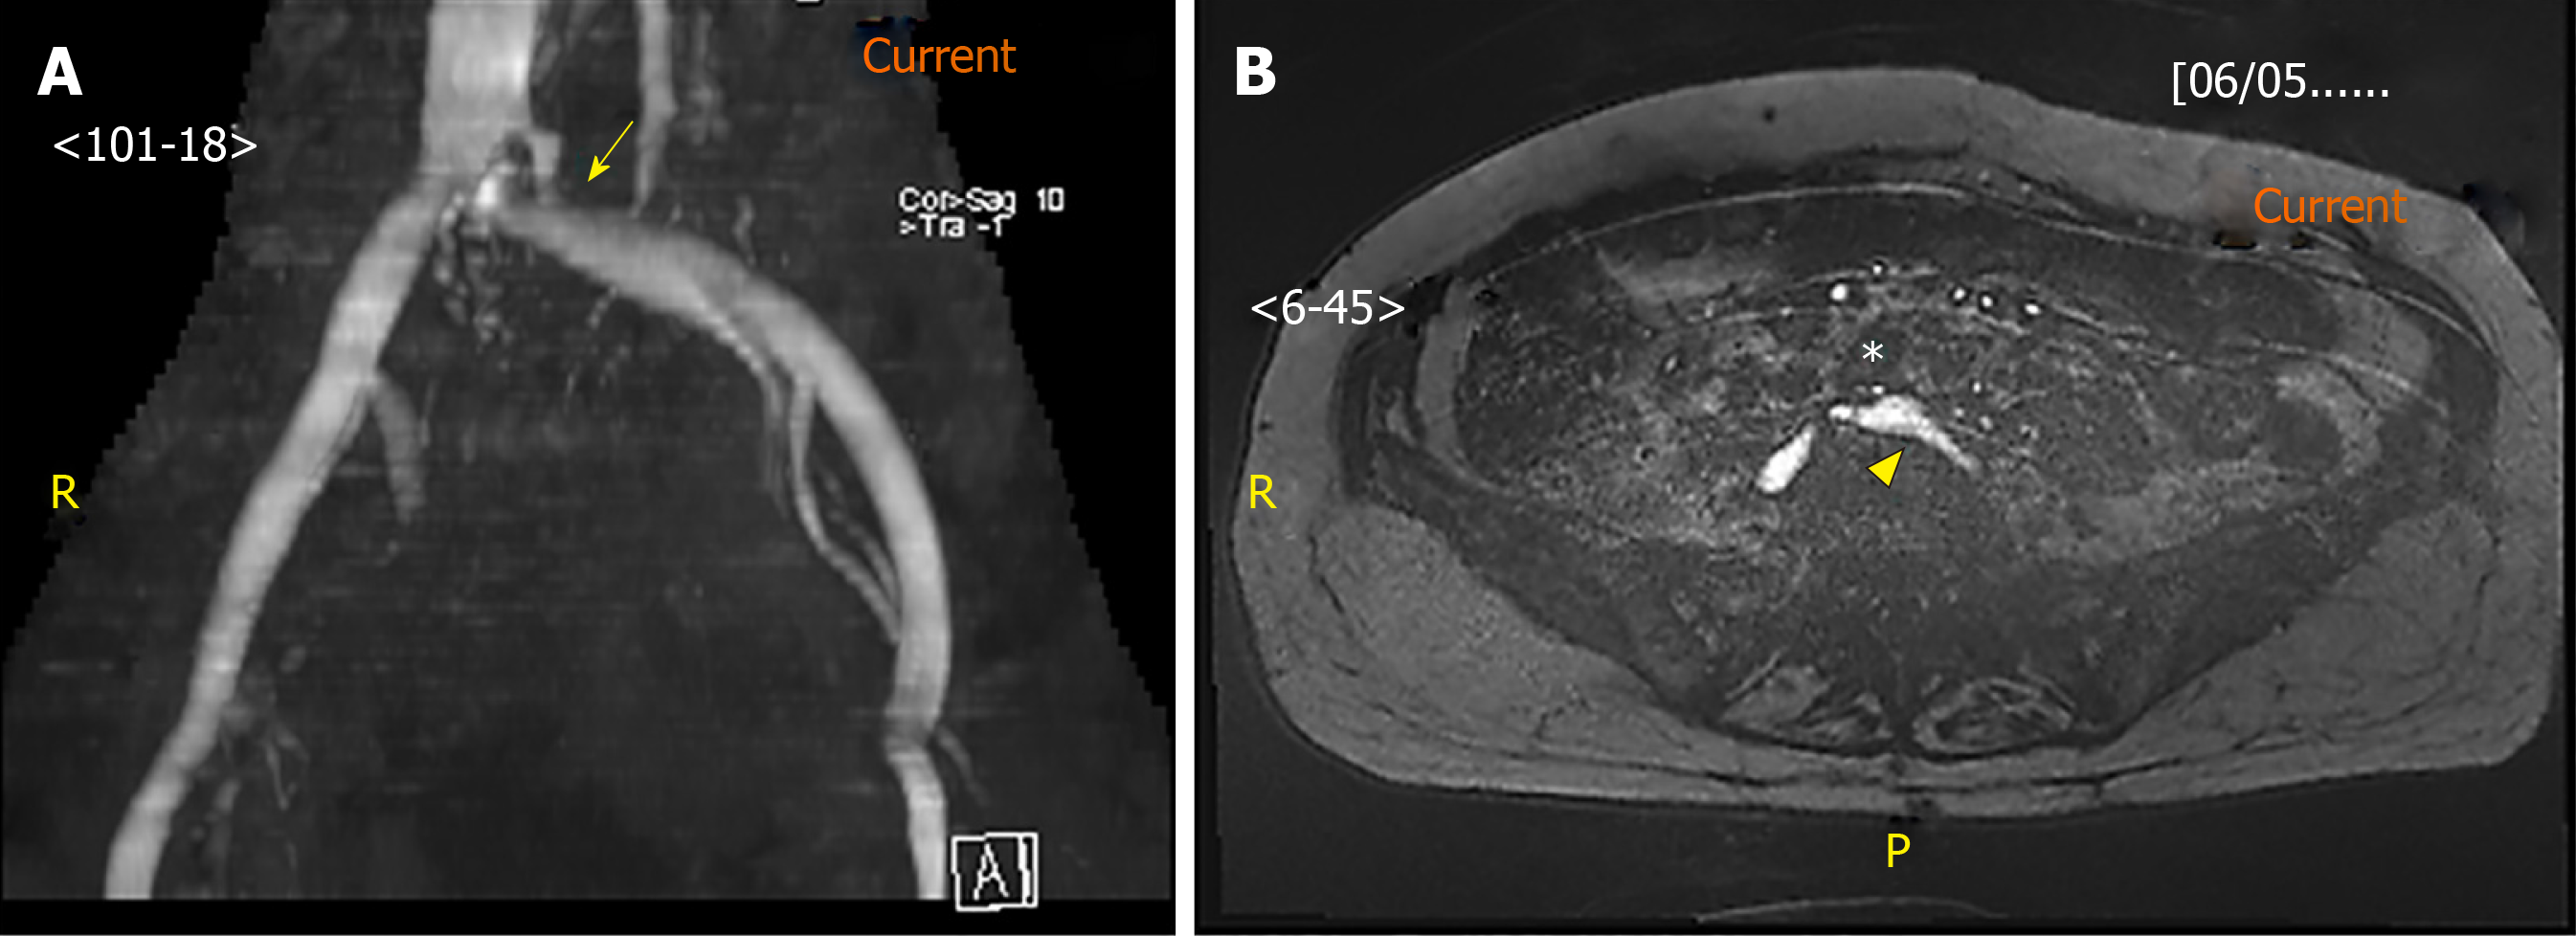
Figure 2 Magnetic resonance venography image.
A: Magnetic resonance venography image of the stenosed left common iliac vein (arrow); B: Axial image of the left common iliac artery (asterisk) compressing against the left common iliac vein (arrowhead). Under magnetic resonance venography, venous blood generates high signal intensity (hyperintense) while arterial blood is suppressed (hypointense).
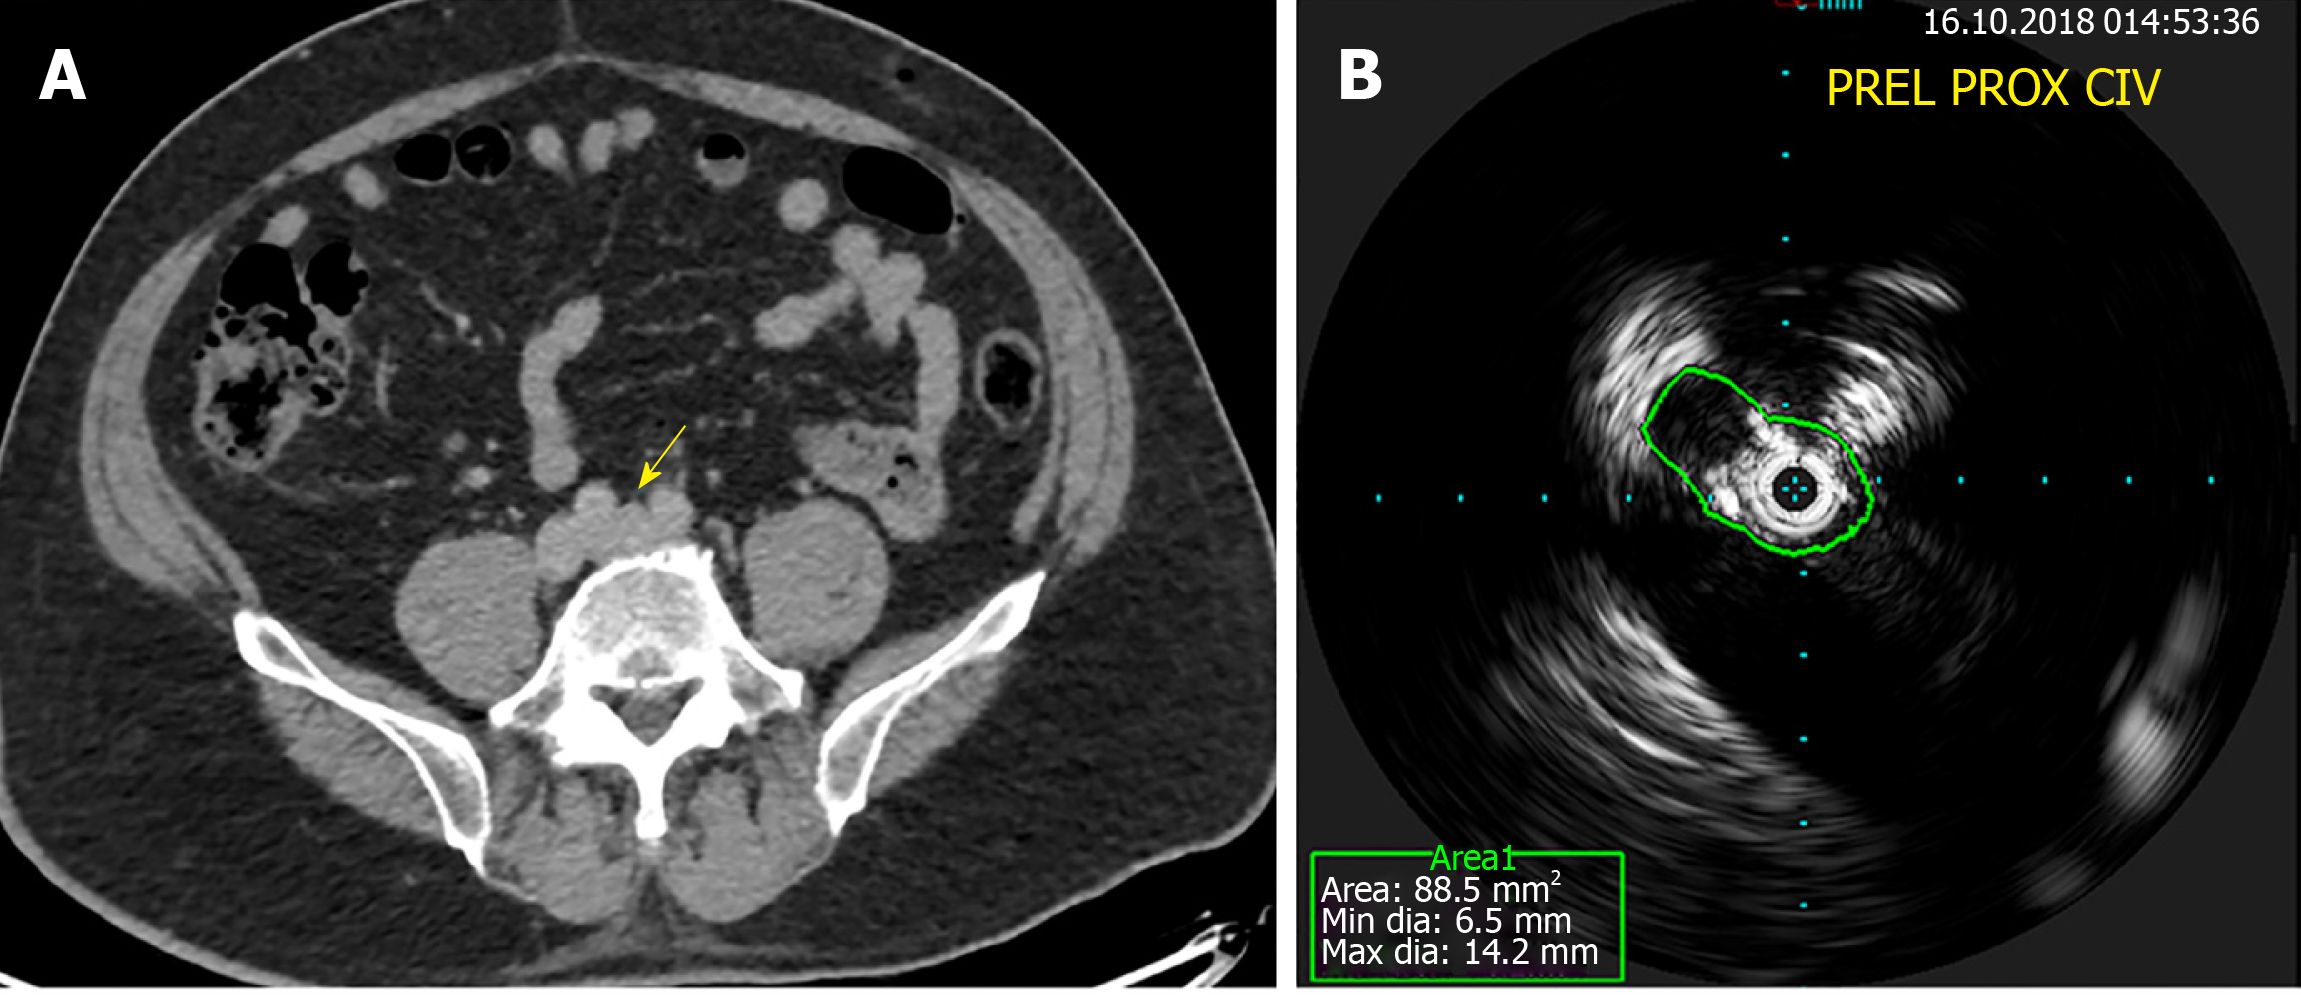
Figure 3 Computed tomography venography and intravascular ultrasound.
A: Normal filling of the left common iliac vein (arrow) on computed tomography venography; B: Obvious stenosis on intravascular ultrasound for a patient with May-Thurner syndrome.
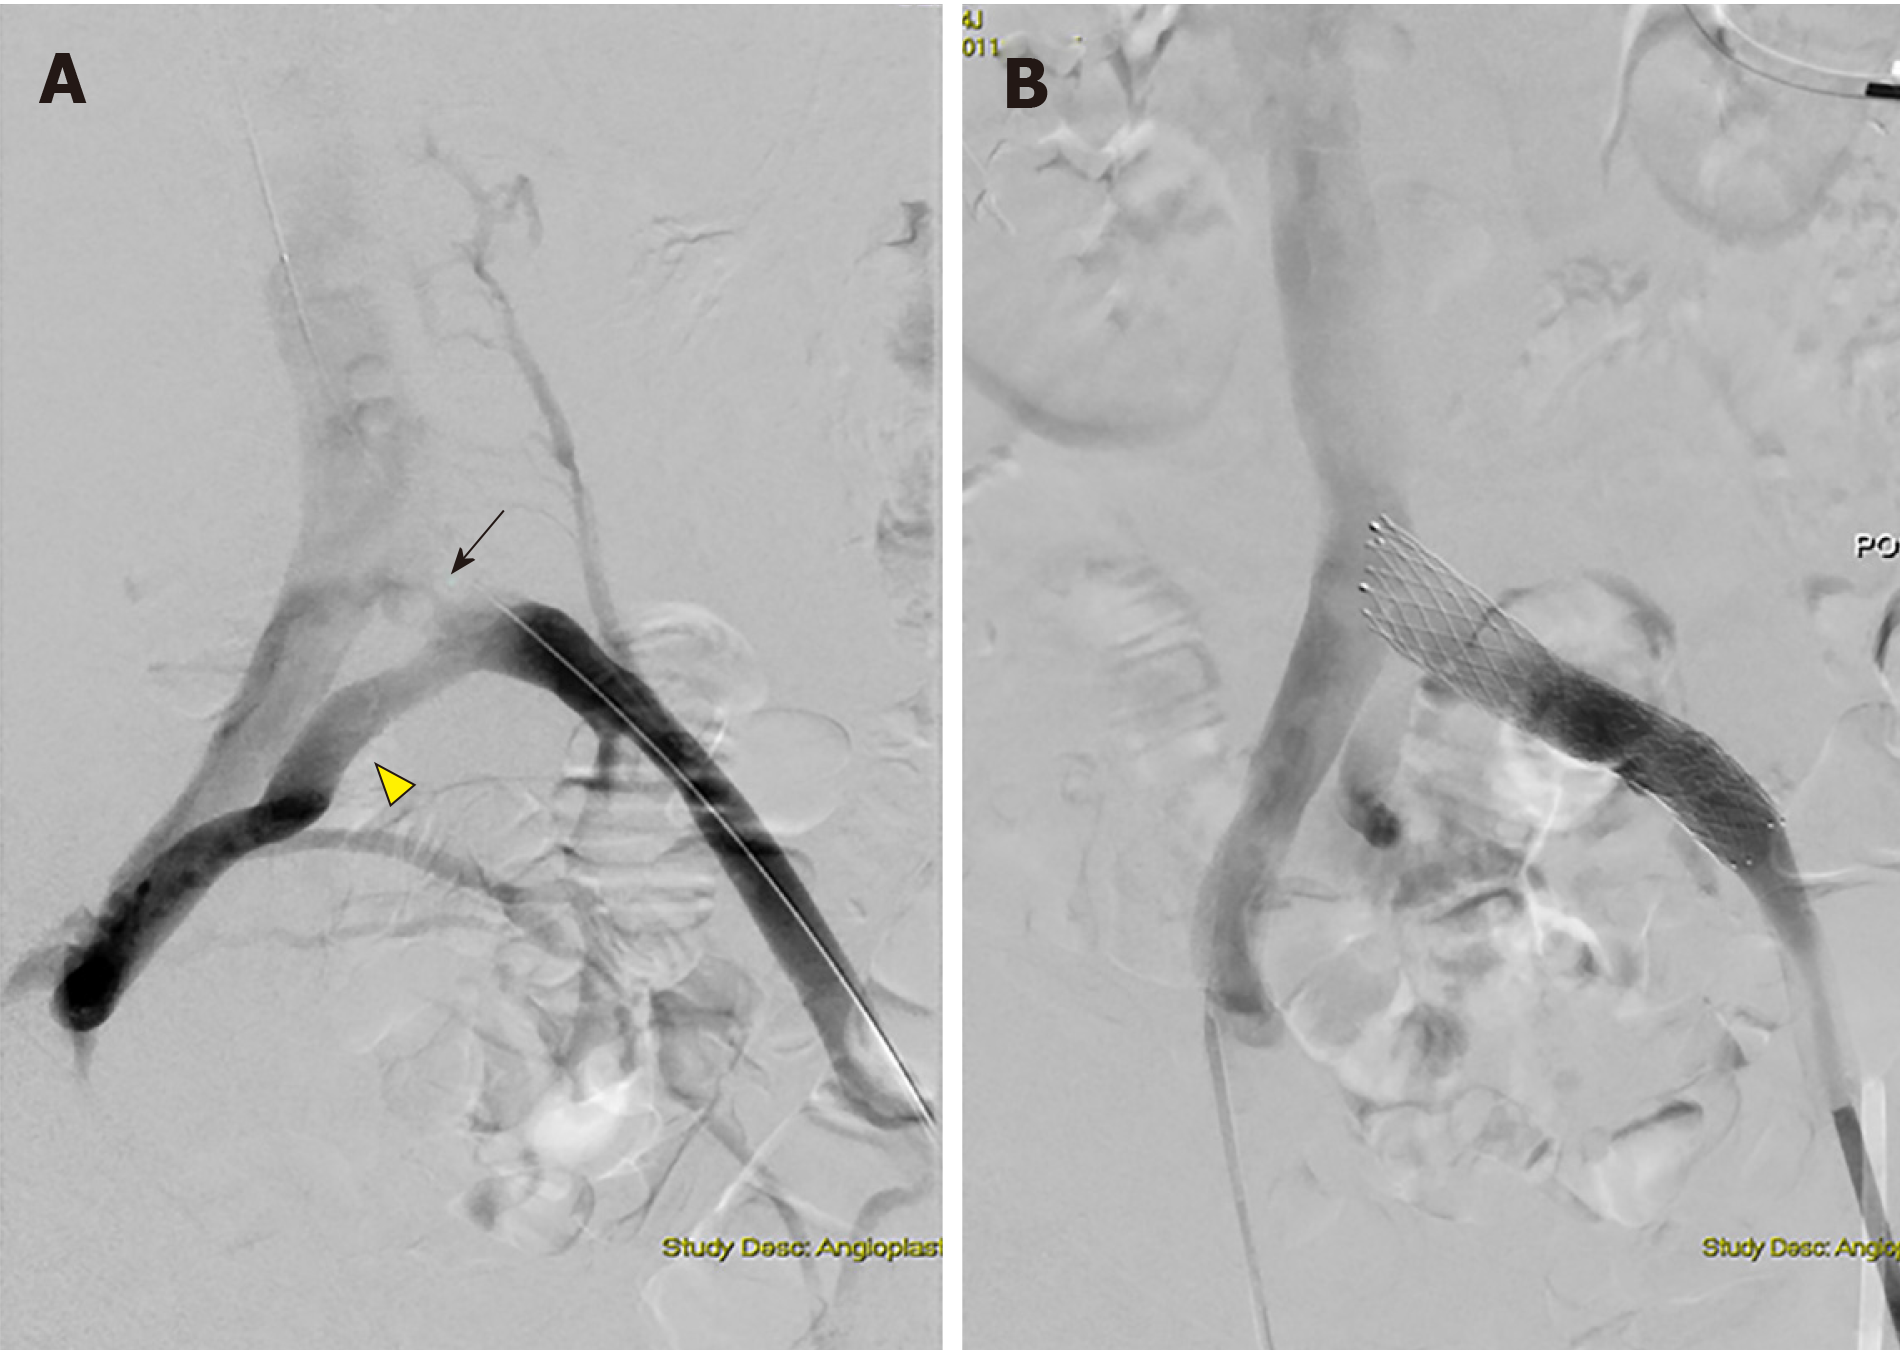
Figure 4 Digital subtraction angiography images.
A: Digital subtraction angiography images obtained during revascularization showing left proximal common iliac vein stenosis (arrow) with formation of collaterals (arrowhead); B: Digital subtraction angiography images obtained during revascularization showing dilation post-stenting.
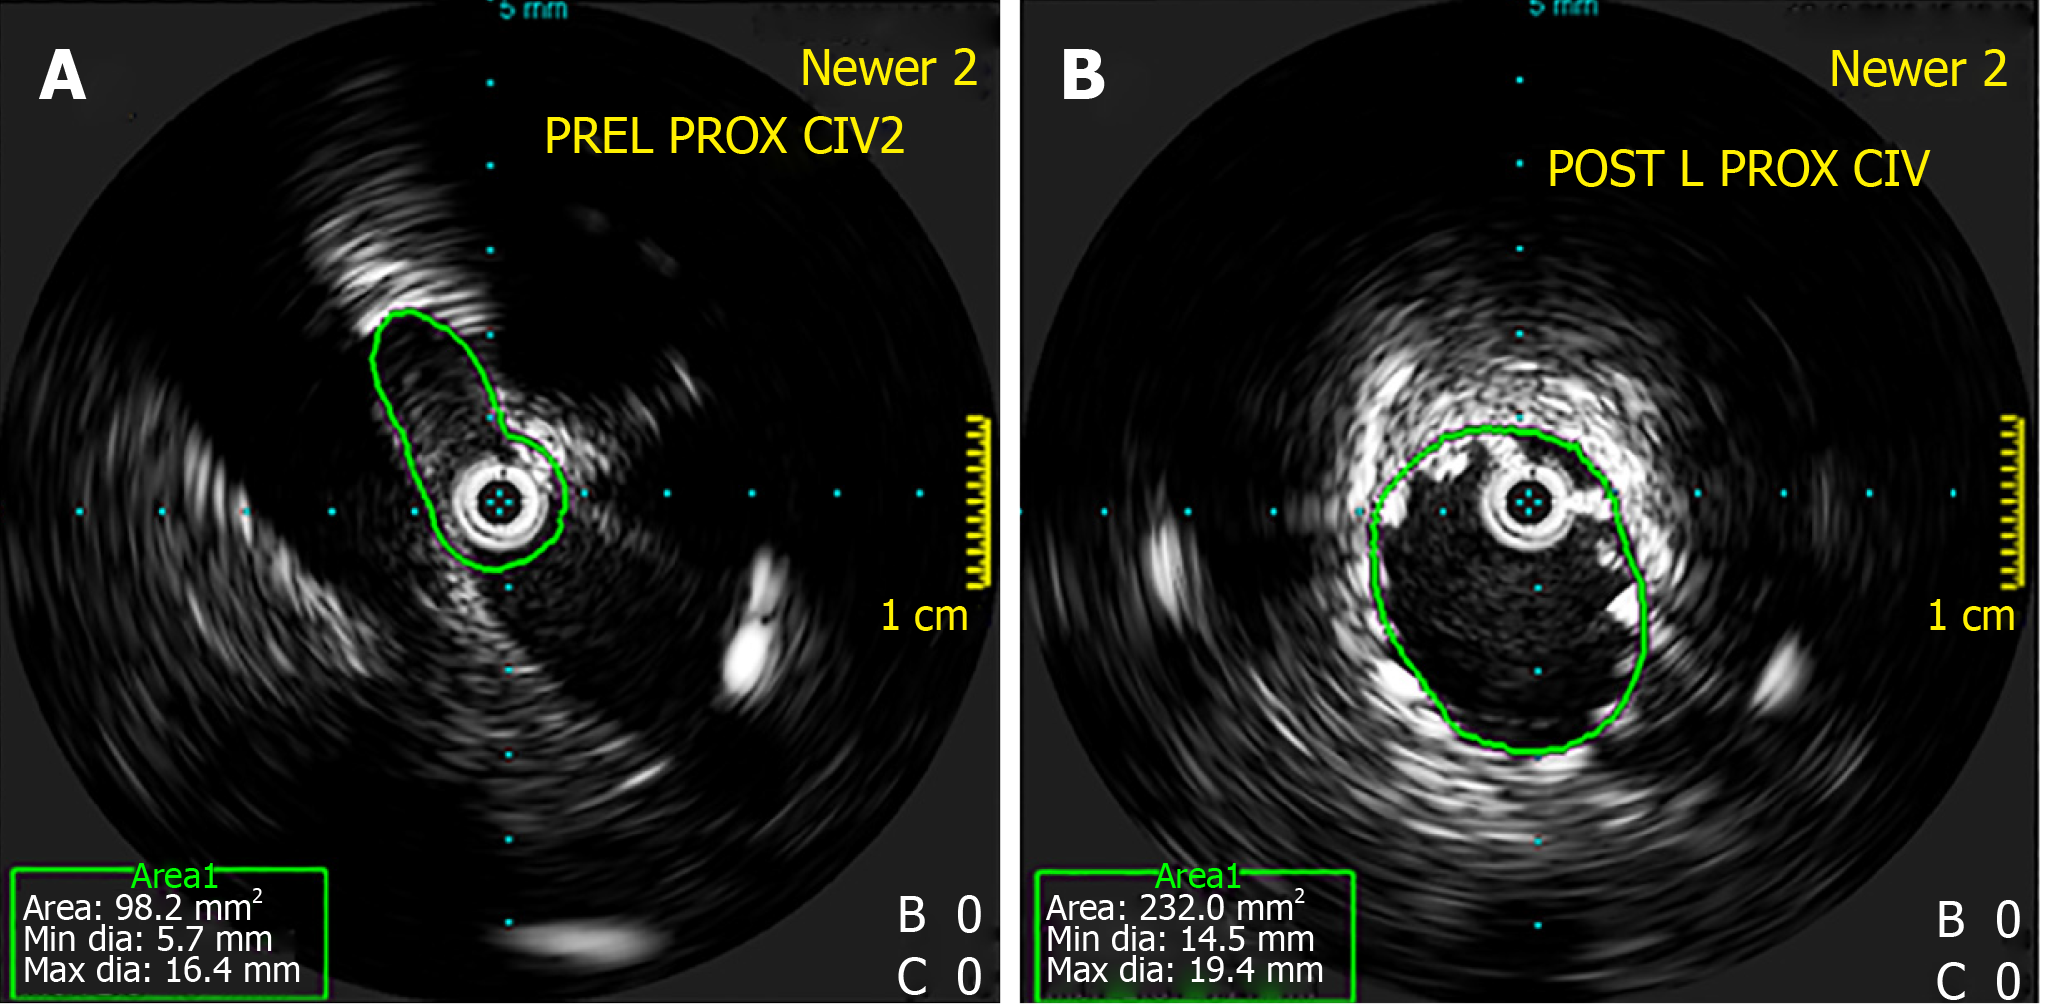
Figure 5 Intravascular ultrasound.
A: Intravascular ultrasound showing stenosis at the left proximal common iliac vein; B: Intravascular ultrasound showing dilatation post-stenting. Intravascular ultrasound allows for direct imaging of the stenosis and evaluation of post-stenting vein diameter.
Figure 6 Marked hyperpigmentation and swelling of the legs in a patient with May-Thurner syndrome which showed significant resolution as early as three months after endovascular stenting was performed.
A: Pre-Stenting; B: Three months post-stenting.
- Citation: Toh MR, Tang TY, Lim HHMN, Venkatanarasimha N, Damodharan K. Review of imaging and endovascular intervention of iliocaval venous compression syndrome. World J Radiology 2020; 12(3): 18-28
- URL: https://www.wjgnet.com/1949-8470/full/v12/i3/18.htm
- DOI: https://dx.doi.org/10.4329/wjr.v12.i3.18


