Published online Jul 26, 2010. doi: 10.4330/wjc.v2.i7.163
Revised: May 7, 2010
Accepted: May 14, 2010
Published online: July 26, 2010
Echocardiography is the most common diagnostic method for assessing atrial function but the technique has some limitations. Traditionally, assessment of left atrial function has been performed by measuring volumes with 2D echocardiography. Additionally, it can be assessed with transmitral Doppler and pulmonary vein Doppler. Recently, an alternative method has been incorporated, namely, measurement of myocardial deformation with color tissue Doppler-derived strain. However, this method has several limitations, such as suboptimal reproducibility, angle-dependence, signal artifacts and the fact that it only measures regional strain and does not obtain information about the curved portion of the atrial roof. To overcome these limitations in the quantification of atrial function, the use of speckle tracking echocardiography (STE) strain has been proposed. This technique is not derived from Doppler but rather from 2D echocardiography; it is angle-independent and allows one to measure global as well as regional atrial strain. In this editorial, we describe the physical and pathophysiological concepts of STE and underline the clinical usefulness of this new technique.
- Citation: Cianciulli TF, Saccheri MC, Lax JA, Bermann AM, Ferreiro DE. Two-dimensional speckle tracking echocardiography for the assessment of atrial function. World J Cardiol 2010; 2(7): 163-170
- URL: https://www.wjgnet.com/1949-8462/full/v2/i7/163.htm
- DOI: https://dx.doi.org/10.4330/wjc.v2.i7.163
Echocardiography is a simple and widely available tool for the diagnosis of cardiovascular diseases, which provides information about cardiovascular structure, function and hemodynamics. Since its first clinical application, at the end of the 1970s, the technique has evolved and expanded, improving its diagnostic capabilities, including the spectrum of: M-mode and 2D echocardiography; pulsed, continuous wave and color Doppler; transesophageal and stress echocardiography; contrast myocardial perfusion; second harmonic imaging; and 3D and 4D echocardiography.
In recent years, the magnitude and speed of such changes have continued to increase, with the advent of techniques that quantify myocardial velocity and deformation, thus allowing better assessment of ventricular function (pulsed tissue Doppler, color tissue Doppler, strain, strain rate (SR), tissue tracking, tissue synchronization imaging, speckle tracking, rotation and torsion). Additionally, digital storage techniques have allowed quantification regional myocardial function off-line.
During the past decade, numerous research studies have been published, which have described the usefulness of 2D strain obtained with speckle tracking, for the assessment of left ventricular function. However, there have been few studies describing the use of this new technique in the assessment of atrial function. The purpose of this editorial is to review the methodology and its usefulness in various clinical scenarios.
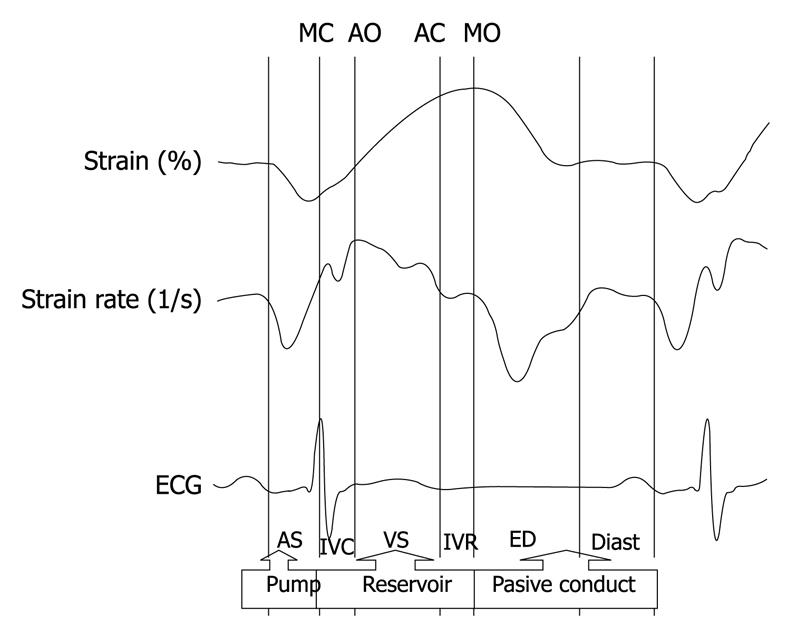
The left atrial function contributes to left ventricular filling by means of its three components: a reservoir component, which receives blood from the pulmonary veins during ventricular systole; a passive conduit component during early diastole and diastasis; and a pump component, with active contraction during late diastole[1].
Changes in atrial function during the different phases of the cardiac cycle can be assessed non-invasively with echocardiography, using conventional methods such as changes in atrial area and volume. Currently, the new 2D strain and SR techniques, derived from speckle tracking allow us to identify these three components of atrial function (Figure 1).
The reservoir phase begins with ventricular systole. During that phase, as it receives blood from the pulmonary veins, the atrial chamber distends in early diastole, atrial blood is suctioned by the ventricle, and the atrium acts as a passive conduit. In late diastole, the atrial muscles contract actively, and perform a pump function that completes ventricular filling.
In normal subjects, the atrial contribution as a reservoir, passive conduit and pump is approximately 40%, 35% and 25%, respectively. The reservoir function of the atrium is particularly relevant because 40% of the systolic volume is stored in the atrium during ventricular systole.
In cases of diastolic dysfunction, changes in ventricular filling occur, and the relative contributions of each of these components vary in order to maintain systolic ventricular volume. Prolonged ventricular relaxation, for example, leads to a decrease in conduit function, while the reservoir and pump functions increase. As diastolic dysfunction progresses, and the patient exhibits a pseudonormal or restrictive mitral flow, the passive conduit function increases, while the reservoir and active pump functions decrease significantly[2].
Traditionally, assessment of left atrial function has been performed by measuring volume with 2D echocardiography. Additionally, it can be assessed with transmitral Doppler and pulmonary vein Doppler. Recently, an alternative method has been incorporated, namely, measurement of myocardial deformation with color tissue Doppler-derived strain[3,4]. However, this method has several limitations, such as suboptimal reproducibility, angle-dependence, signal artifacts and the fact that it only measures regional strain and does not obtain information about the curved portion of the atrial roof.
To overcome these limitations in the quantification of atrial function, the use of speckle tracking echocardiography (STE) strain has been proposed. This technique is not derived from Doppler but rather from 2D echocardiography, it is angle-independent, and allows us to measure global as well as regional atrial strain[5-7].
STE is a new technique of 2D echocardiography image analysis that allows the study of regional atrial myocardial deformation expressed by a dimensionless parameter, the strain (ε), which is defined as the percentage change from the original dimension. Deformation of atrial tissue occurs over time during the cardiac cycle, and the rate of this deformation, the SR, measures the velocity with which this myocardial deformation occurs.
STE allows accurate assessment of segmental strain deformation by grey-scale-based image analysis, frame by frame. The lack of angle-dependency is a great advantage because atrial strain can be tracked in 2D echocardiography imaging, along the direction of the wall and not along the ultrasound beam.
This new technique has a few limitations, namely, it is frame-dependent, cannot be used in patients whose 2D image quality is suboptimal (STE needs high quality grey-scale images with an optimal frame rate between 50 and 70 frames/s), and requires a learning curve for the off-line analysis with the software used. Nonetheless, it is a very promising tool for the assessment of regional and global atrial function.
Global longitudinal left atrial strain and SR parameters determined by STE are feasible and reproducible indices for the evaluation of left atrial function.
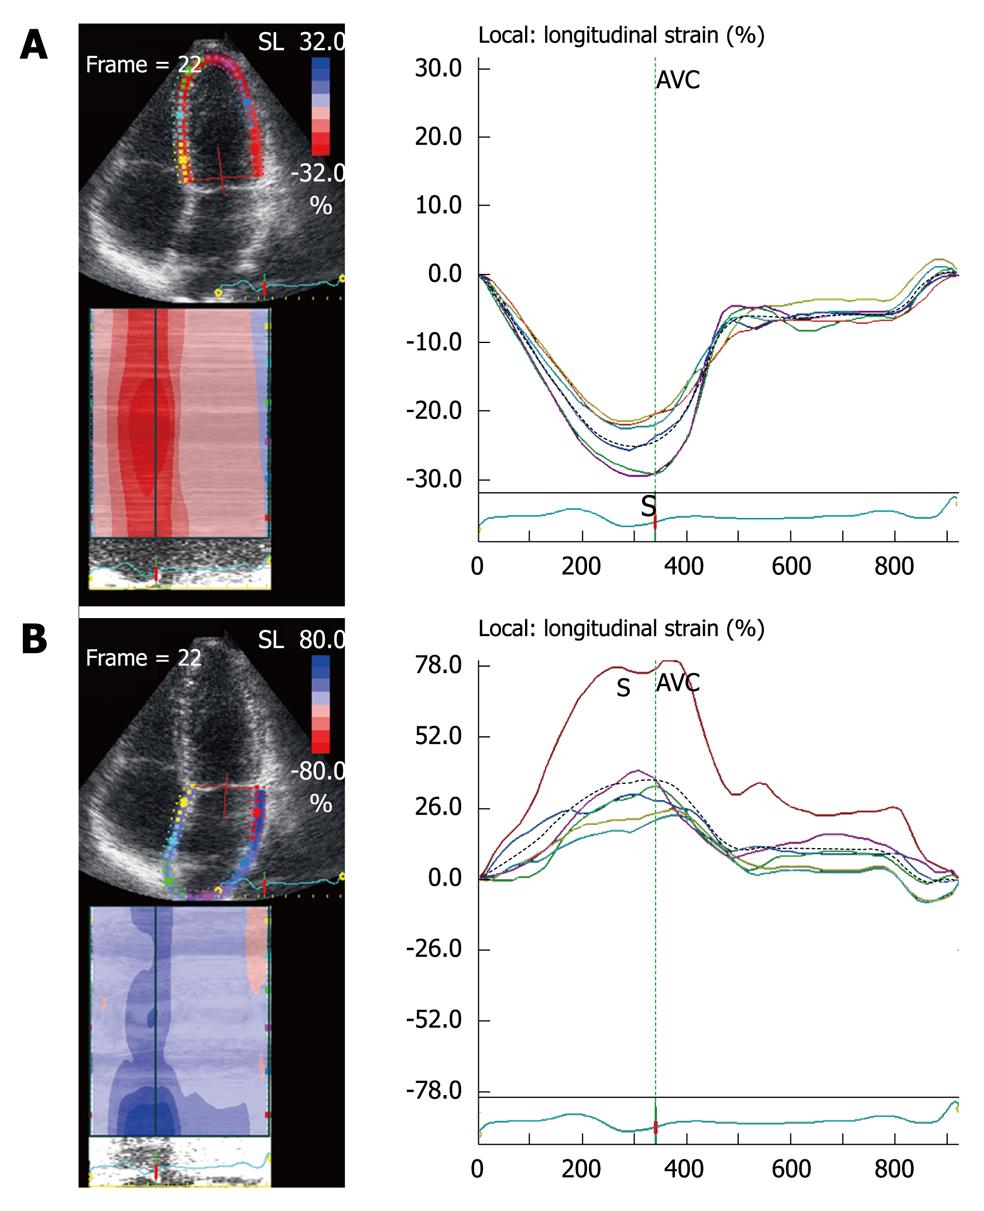
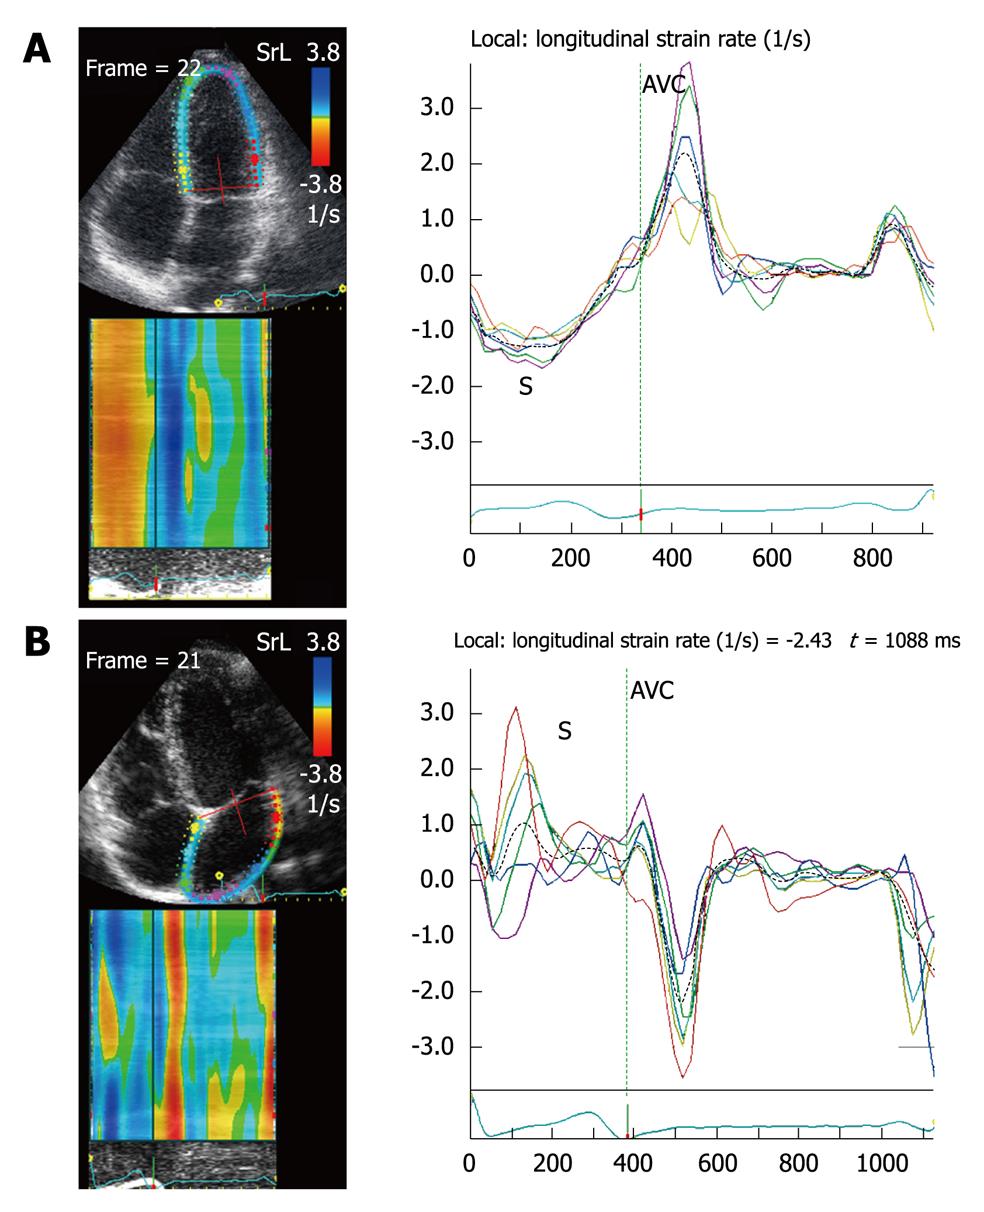
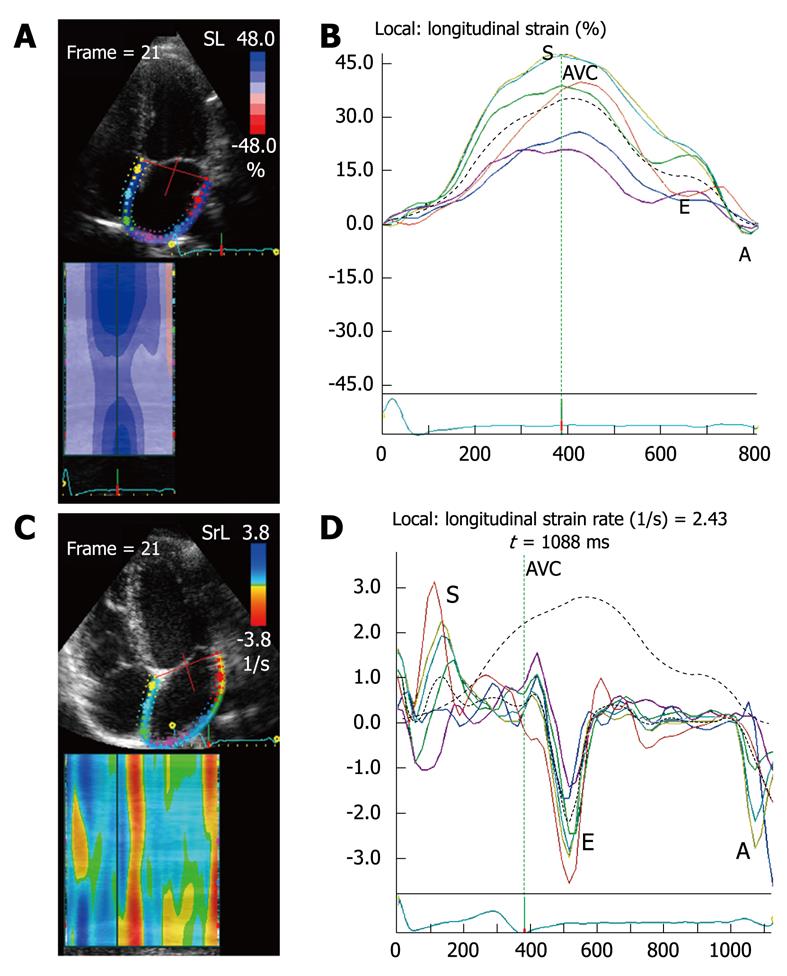
The ventricular strain is different from atrial strain (Figure 2). The atria and ventricles move in opposite directions during the cardiac cycle, so the atrial myocardium lengthens during ventricular systole (positive strain), while the ventricular myocardium shortens during ventricular systole (negative strain). Ventricular SR curves are also opposite to atrial SR curves (Figure 3).
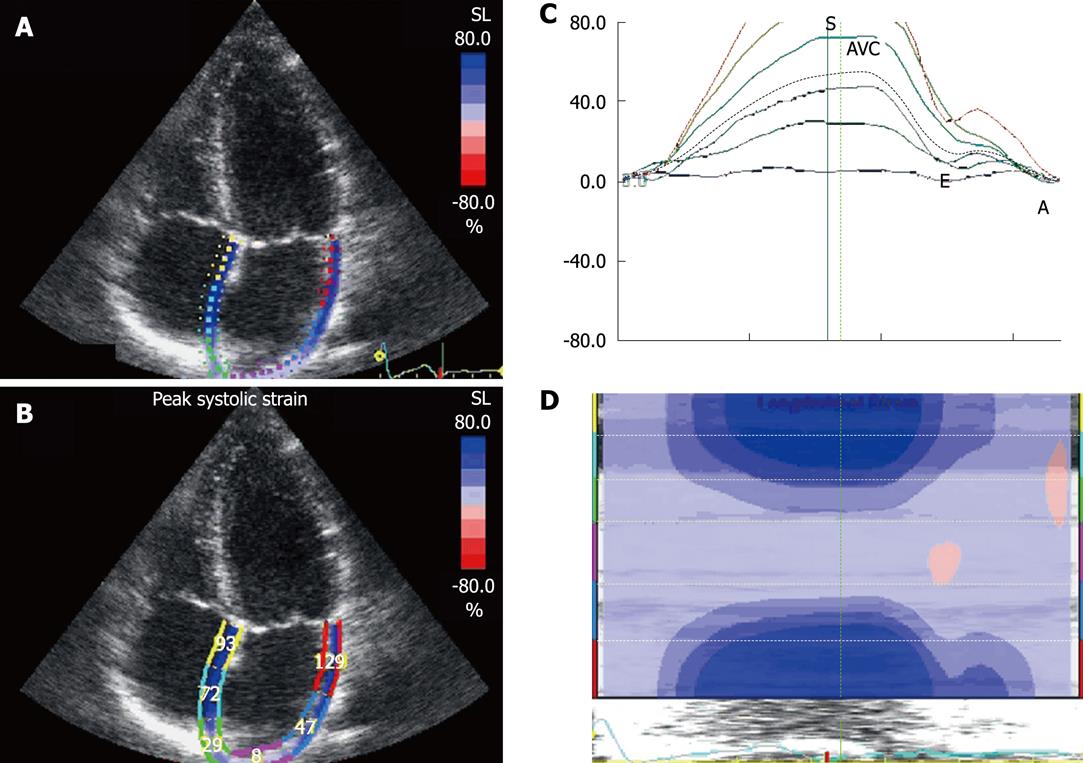
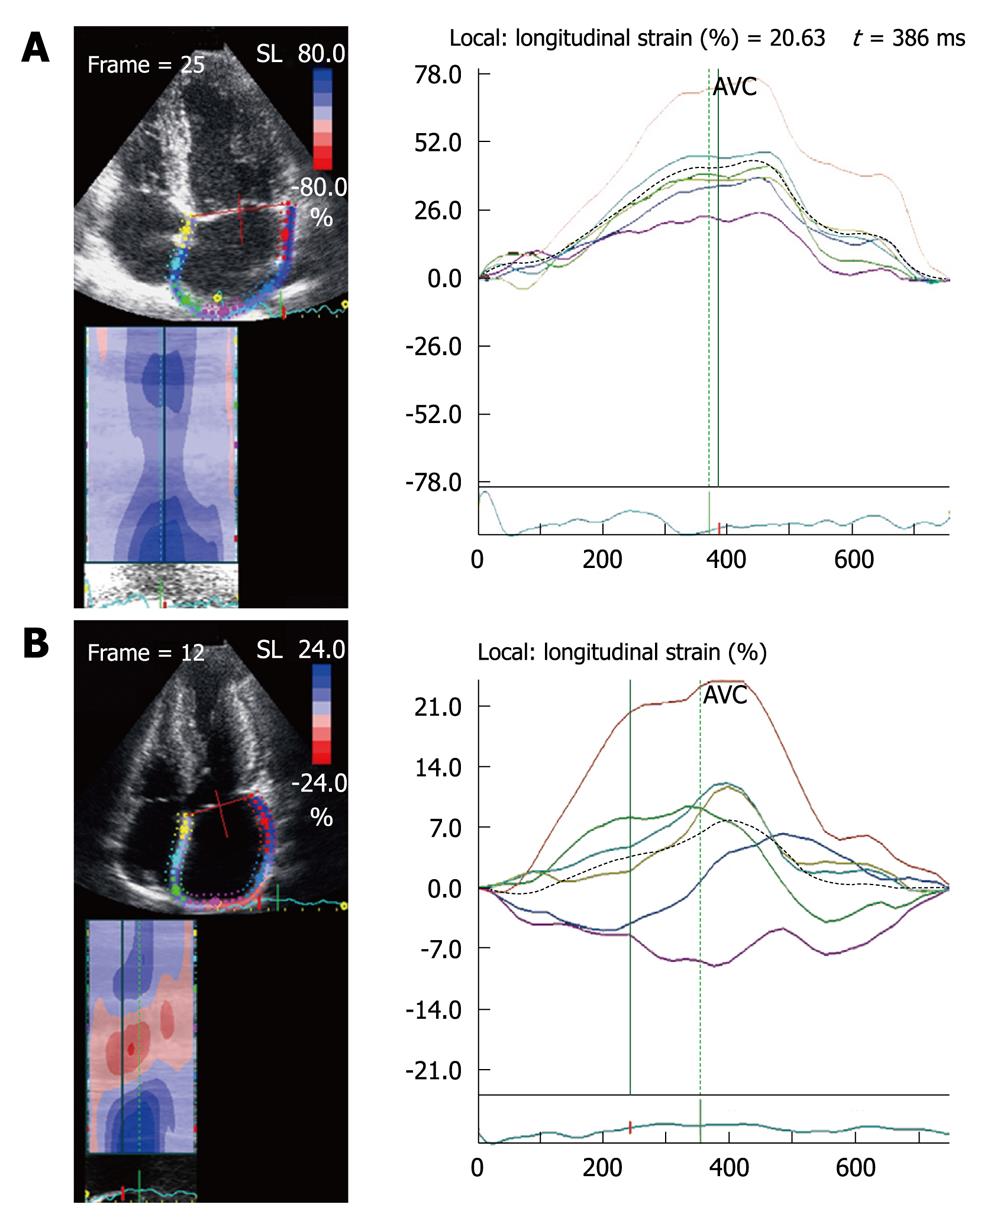
The apical four-chamber view permits 2D strain measurements of both atria. To calculate atrial strain, the atrial endocardium is first traced manually. The epicardial surface is calculated automatically, and after manually reducing the region of interest to the atrial thickness, the software automatically divides the atrial wall into six segments, two correspond to the interatrial septum, two to the lateral wall, and two to the roof of the left atrium (Figure 4).
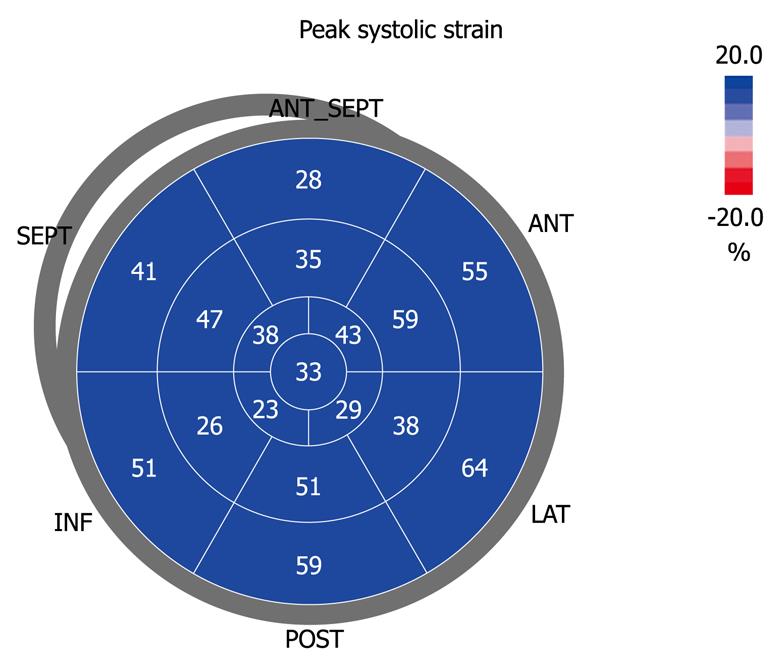
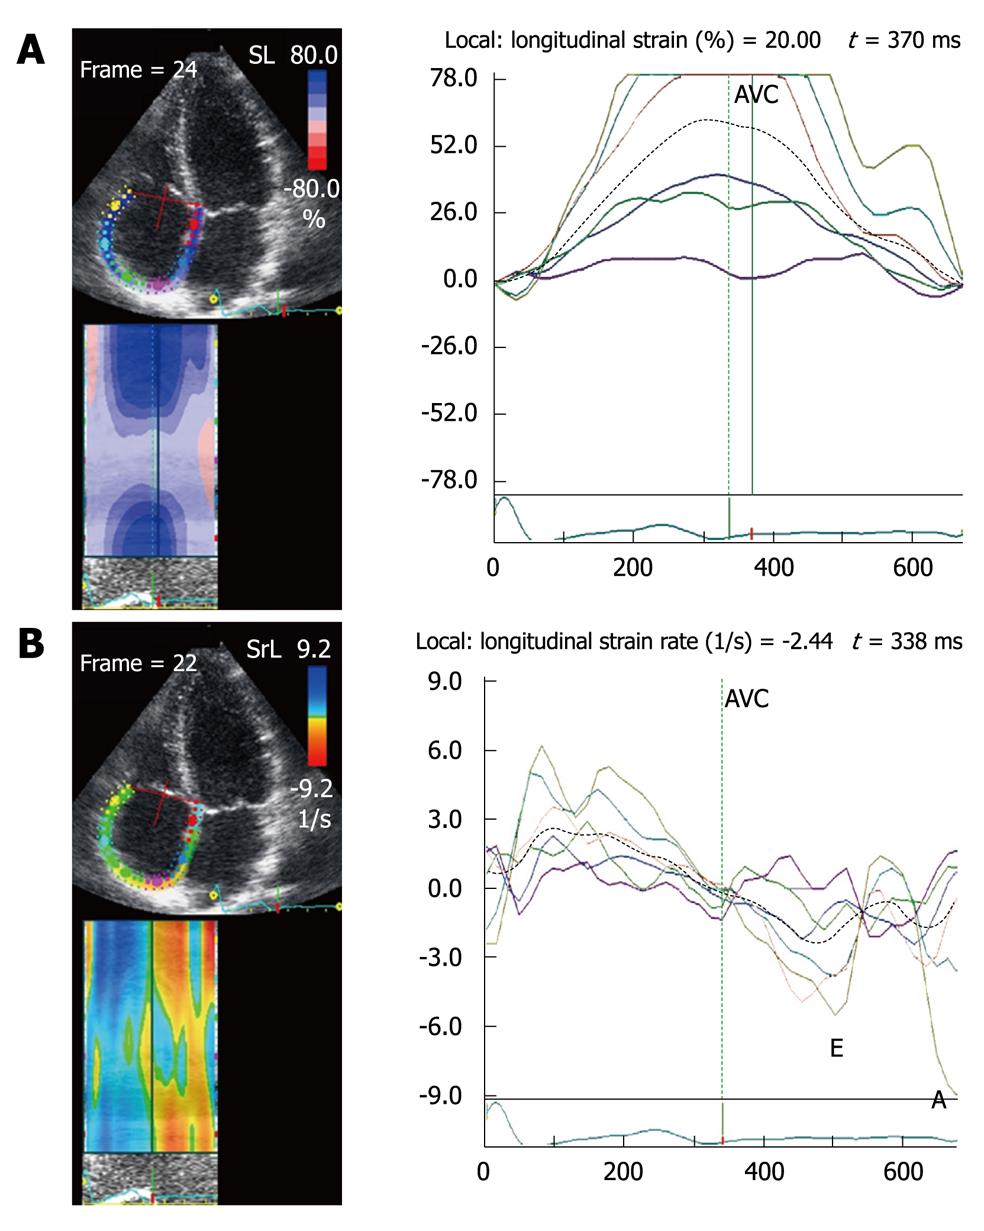
Before acquiring the atrial strain from the apical four-chamber view, if speckle tracking is not adequate, the region of interest is manually adjusted to include only the atrial wall. If these steps are repeated from the apical two- and three-chamber views, strain values of the anterior, inferior and posterior walls of the left atrium are obtained, thus resulting in a bull’s eye rendering of the 17 atrial segments (Figure 5). With this technique, atrial strain can be calculated in less than 3 min. In the apical three-chamber view, we only consider the posterior wall of the left atrium, because the opposite wall includes the ascending aorta. Of note, because there still is no software available to calculate atrial strain, we employ the same software that is used for the analysis of ventricular function. Once the longitudinal atrial strain curves have been obtained, two measurements are performed: peak atrial strain (during the reservoir phase), which is plotted as a positive curve (S) at the time of aortic valve closure; and strain during atrial systole (A), which is plotted as a negative curve with a peak after the P wave of the ECG. From the 2D atrial strain, SR curves are derived, which permits measurement of atrial SR during the three phases (Figure 6). Calculation of right atrial strain and right atrial SR is performed similarly to that of longitudinal 2D strain of the left atrium (Figure 7).
Radial strain of the atria is not obtained from the parasternal views because the atrial wall is thinner than the left ventricle wall, to allow speckle tracking analysis. The atrial reservoir strain is greater in the apical two-chamber view than in the four-chamber view. The cause of this discrepancy could be that there are two areas in which atrial strain is low: the interatrial septum and the area of the pulmonary veins where the heart is anchored to the mediastinum. During atrial contraction and relaxation, a deformation gradient is observed from all views, with higher strain in the atrioventricular junction and lower strain in the atrial roof. Surprisingly, the strain of the atrial roof is not higher than in the atrial base, as occurs with the left ventricle, but this could be because the atrial roof is fixed to the mediastinum by the pulmonary veins. In the assessment of left atrial function, the posterior wall exhibits the lowest strain. This could be because its motion is limited by attachment of the four pulmonary veins. By contrast, the inferior wall exhibits the highest strain and SR values[8], which are attributable to its greater thickness, whereas the anterior wall, adjacent to Theile’s transverse sinus, is thinner. In the assessment of right atrial function, the free wall exhibits the greatest strain and SR, compared to the rest of the atrial segments. This could be because its largest mass is conferred by the pectinate muscles, which could generate its greater mobility.
Considering the limitations of the classic indices used to assess atrial function, 2D atrial strain measured with speckle tracking is a quick and simple technique that can clarify atrial function in several pathophysiological conditions associated with changes in atrial function, such as: mitral valve disease, supraventricular arrhythmias, hypertension, coronary heart disease, heart failure, atrial stunning and cardiomyopathy.
Assessment of atrial function is useful in distinguishing physiological from pathological hypertrophy. During ventricular diastole (passive conduit and pump function phases), the left atrium is exposed to ventricular filling pressures. In healthy subjects, during exercise, the reservoir and pump strains increase to maintain ventricular filling at an optimal level during hemodynamic changes. In patients with hypertrophy secondary to hypertension, atrial pressure rises to maintain an adequate ventricular filling, and the rise in wall tension contributes to its dilatation. As a consequence, pump function increases while the reservoir function drops[9], which leads to an increase in peak strain during atrial contraction and a decrease in the reservoir strain.
In patients with hypertrophic cardiomyopathy (HCM), an atrial reservoir strain < 21% predicts the development of atrial fibrillation (AF) within less than 12 mo[10]. In the rare cases of HCM with right atrial hypertrophy, the atrial reservoir strain is markedly decreased (Figure 8).
The pathophysiology of AF in patients with apparently normal hearts remains unclear. The increase in left atrial volume is one of the most important structural changes in AF. Stretching of the left atrial myocytes increases the intercellular matrix, collagen production and fibrosis. Atrial dilatation reflects not only a remodeling process, but also the effects of the rise in atrial pressure. It has been shown[10] that the left atrium of patients with paroxysmal AF is larger and exhibits higher pressure. Atrial SR is the best predictor of paroxysmal AF, even better than atrial strain, probably because it allows better identification of the three phases of atrial function.
Another predictor of the new development of AF in patients with heart failure is the presence of intra-atrial asynchrony, which can be demonstrated with strain during the reservoir phase[11]. Patients with heart failure exhibit a delay in contraction and in the reservoir relaxation phase of the left atrial free wall.
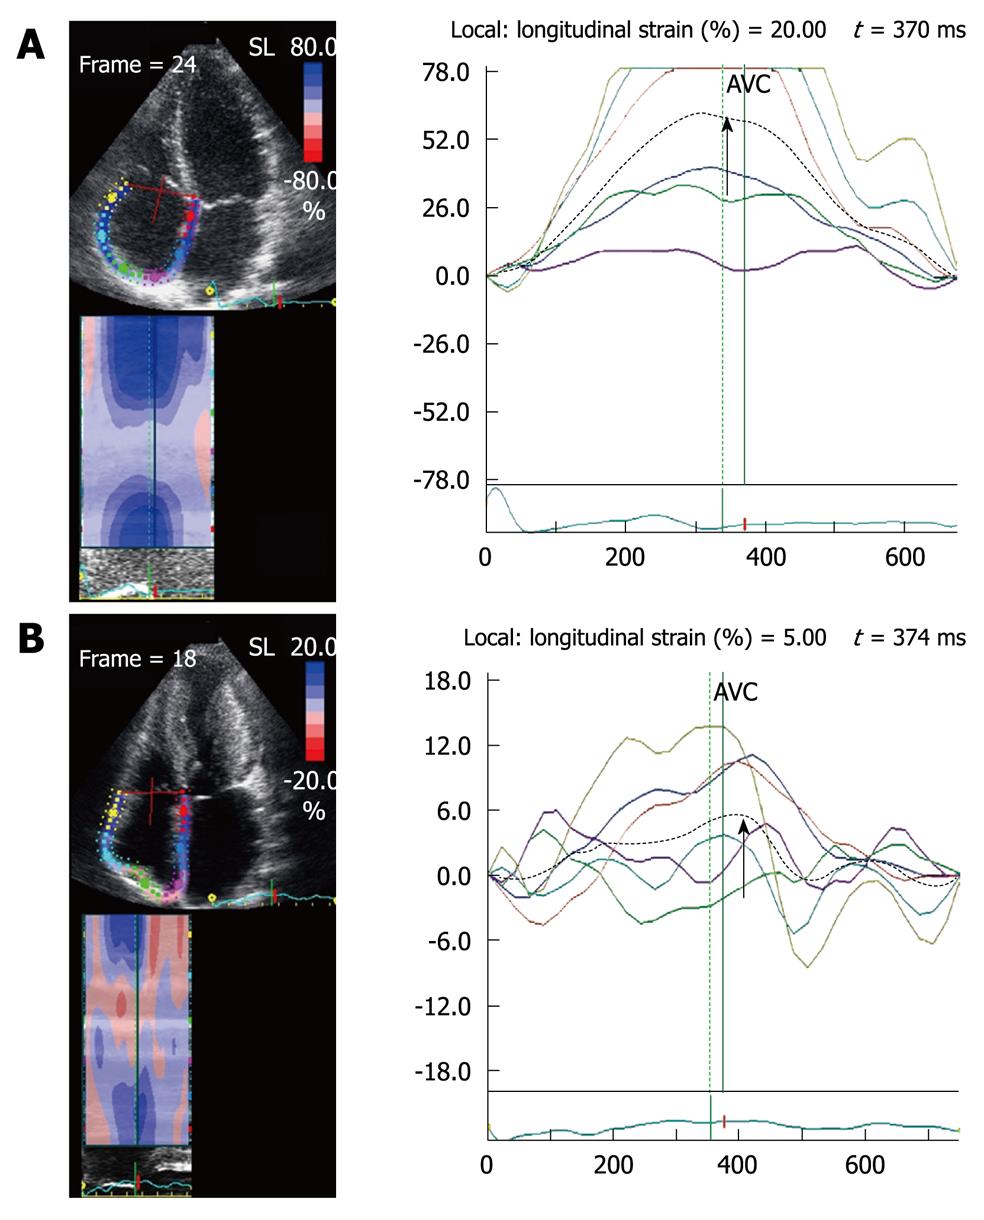
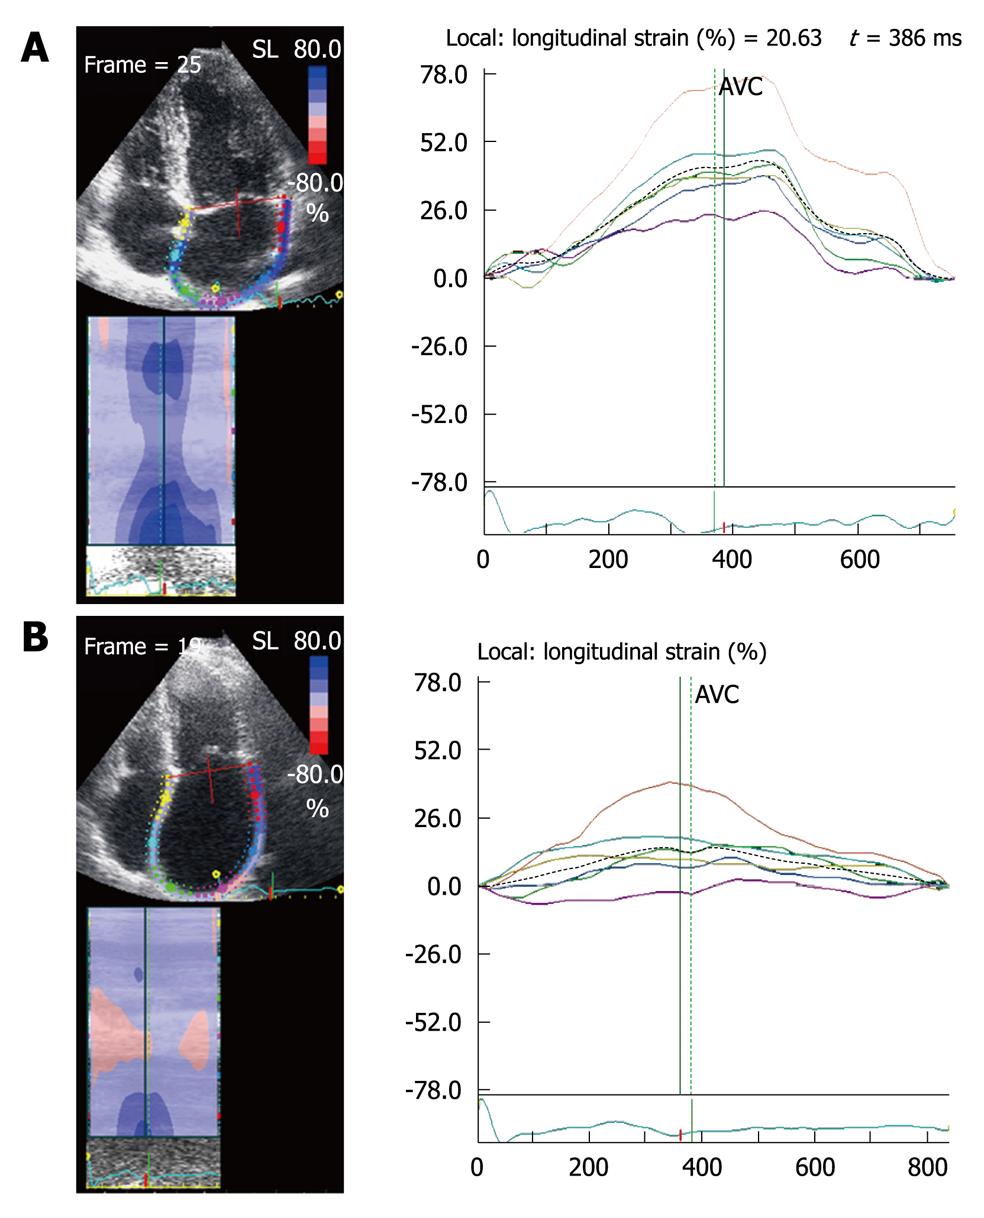
In patients with AF[12], reservoir and conduit atrial strain and SR are decreased and strain and atrial strain are absent during late diastole, compared to patients with sinus rhythm (Figure 9). With restoration of sinus rhythm there is an increase in atrial reservoir and passive conduit strains. In contrast with the increase in peak velocity of the pulsed tissue Doppler A wave, peak atrial SR which reflects atrial pump function (A wave), is not normalized until 6 mo post restoration of sinus rhythm[13].
Patients with AF who undergo electrical cardioversion have higher recurrence rates if they have multiple risk factors, including older age, and recurrence also depends on the cause and duration of the AF, functional capacity, and degree of atrial dilatation. Severity of the impairment in atrial function, assessed by the decrease in 2D strain and SR during the reservoir phase and early diastole[4], is an independent predictor of AF recurrence (Figure 9).
The extent of atrial fibrosis detected with late gadolinium enhancement by magnetic resonance correlates with this reduction in atrial strain and SR measured with speckle tracking[14]. This finding explains why atrial reservoir strain and SR are useful predictors of the development of AF, and predict recurrence in patients with AF who undergo radiofrequency ablation[12]. These findings suggest the usefulness of antiarrhythmic drugs in patients subjected to ablation who exhibit low atrial strain and SR values, which entail a high risk of recurrence.
Atrial stunning is characterized by a reduction in the mechanical function of the left atrium in AF after restoring sinus rhythm; it may last for several weeks and is associated with an increase in thromboembolic risk for the duration of the vulnerable period. Thomas et al[15] have measured telediastolic atrial strain and have shown a gradual recovery of the left atrial pump function following cardioversion.
Patients with class III-IV heart failure, a wide QRS and intraventricular asynchrony benefit from cardiac resynchronization therapy (CRT). In addition to the clinical benefit (increase in functional capacity), there is an improvement in systolic function (ejection fraction increase > 15%), reverse remodeling (end-systolic volume reduction < 15%), and an increase in right ventricular systolic function. These changes are accompanied by reverse atrial remodeling, which is identified by a reduction in left atrial area and volume. The contractile function of the left atrium, assessed by 2D speckle tracking strain and SR also increases at 3 mo after implantation of a biventricular pacemaker. Furthermore, there is an increase in strain values of the atrial reservoir and passive conduit, consistent with a rise in atrial compliance. The changes mentioned are only observed in patients with a good response to CRT[16].
In mitral stenosis, there is a rise in left atrial pressure and volume, proportional to the severity of the stenosis. In spite of this increase in afterload, the left atrial pump function contributes less to ventricular filling, even in the presence of sinus rhythm, because atrial contraction cannot overcome the mechanical obstruction. Hence, atrial strain drops[17] as the left atrium dilates (Figure 10). Patients with mitral stenosis with a greater impairment in the reservoir SR[18] suffer more events (AF, pulmonary hypertension, or need for mitral valve repair or replacement). Future challenges will include defining an atrial strain value that can predict the development of AF and allow us to begin anticoagulation while the patient is still in sinus rhythm, before arrhythmia actually develops, and thus prevent embolic episodes.
In mitral regurgitation, the volume overload of the left atrium is proportional to the severity of regurgitation, but there is much less systolic dysfunction than with mitral stenosis; many patients even exhibit an increase in the reservoir SR, possibly due to a rise in atrial compliance. They also exhibit an increase in the passive conduit atrial SR, which is attributable to the rise in gradient during early diastole, and also shown by the increase in the peak E velocity of the transmitral flow. The left atrial pump function decreases due to the rise in left ventricular diastolic pressure, that is, the rise in atrial afterload. The increase in the reservoir and conduit atrial SR in mitral regurgitation might explain the different time sequence in the development of AF seen in mitral stenosis and mitral regurgitation[17].
In atrial septal defect, atrial strain shows no change compared to healthy subjects, but when patients who underwent surgery were compared to those with percutaneous closure with an occluder, strain in both atria was only decreased in patients undergoing surgical closure[19].
The assessment of atrial function with 2D speckle tracking strain and SR is feasible and reproducible and has several clinical applications. It permits evaluation of the three components of atrial function (pump, passive conduit and reservoir functions) in both atria. These new parameters of atrial function are more sensitive than traditional indices of atrial function and could be incorporated into the routine assessment of various pathophysiological scenarios.
Peer reviewers: Linda Pauliks, MD, MPH, FAAP, FACC, Assistant Professor of Pediatrics, Mail box HP14, Penn State Hershey Children’s Hospital, 500 University Drive, Hershey, PA 17033, United States; Paul Farand, MD, MSc, Assistant Professor, Cardiology Division, Centre hospitalier universitaire de Sherbrooke, Sherbrooke, J1H 5N4, Canada
S- Editor Cheng JX L- Editor Kerr C E- Editor Zheng XM
| 1. | Wang J, Khoury DS, Yue Y, Torre-Amione G, Nagueh SF. Preserved left ventricular twist and circumferential deformation, but depressed longitudinal and radial deformation in patients with diastolic heart failure. Eur Heart J. 2008;29:1283-1289. |
| 2. | Rossi A, Zardini P, Marino P. Modulation of left atrial function by ventricular filling impairment. Heart Fail Rev. 2000;5:325-331. |
| 3. | Pérez-Paredes M, Gonzálvez M, Ruiz Ros JA, Giménez DM, Carnero A, Carrillo A, Cubero T, Martínez-Corbalán FR, García Almagro F. [Assessment of left atrial wall velocities by pulsed wave tissue Doppler imaging. A new approach to the study of atrial function]. Rev Esp Cardiol. 2004;57:1059-1065. |
| 4. | Di Salvo G, Caso P, Lo Piccolo R, Fusco A, Martiniello AR, Russo MG, D'Onofrio A, Severino S, Calabró P, Pacileo G. Atrial myocardial deformation properties predict maintenance of sinus rhythm after external cardioversion of recent-onset lone atrial fibrillation: a color Doppler myocardial imaging and transthoracic and transesophageal echocardiographic study. Circulation. 2005;112:387-395. |
| 5. | Cameli M, Caputo M, Mondillo S, Ballo P, Palmerini E, Lisi M, Marino E, Galderisi M. Feasibility and reference values of left atrial longitudinal strain imaging by two-dimensional speckle tracking. Cardiovasc Ultrasound. 2009;7:6. |
| 6. | Di Salvo G, Drago M, Pacileo G, Rea A, Carrozza M, Santoro G, Bigazzi MC, Caso P, Russo MG, Carminati M. Atrial function after surgical and percutaneous closure of atrial septal defect: a strain rate imaging study. J Am Soc Echocardiogr. 2005;18:930-933. |
| 7. | D'Andrea A, Caso P, Romano S, Scarafile R, Cuomo S, Salerno G, Riegler L, Limongelli G, Di Salvo G, Romano M. Association between left atrial myocardial function and exercise capacity in patients with either idiopathic or ischemic dilated cardiomyopathy: a two-dimensional speckle strain study. Int J Cardiol. 2009;132:354-363. |
| 8. | Vianna-Pinton R, Moreno CA, Baxter CM, Lee KS, Tsang TS, Appleton CP. Two-dimensional speckle-tracking echocardiography of the left atrium: feasibility and regional contraction and relaxation differences in normal subjects. J Am Soc Echocardiogr. 2009;22:299-305. |
| 9. | D'Andrea A, De Corato G, Scarafile R, Romano S, Reigler L, Mita C, Allocca F, Limongelli G, Gigantino G, Liccardo B. Left atrial myocardial function in either physiological or pathological left ventricular hypertrophy: a two-dimensional speckle strain study. Br J Sports Med. 2008;42:696-702. |
| 10. | Tsai WC, Lee CH, Lin CC, Liu YW, Huang YY, Li WT, Chen JY, Lin LJ. Association of left atrial strain and strain rate assessed by speckle tracking echocardiography with paroxysmal atrial fibrillation. Echocardiography. 2009;26:1188-1194. |
| 11. | Cho GY, Jo SH, Kim MK, Kim HS, Park WJ, Choi YJ, Hong KS, Oh DJ, Rhim CY. Left atrial dyssynchrony assessed by strain imaging in predicting future development of atrial fibrillation in patients with heart failure. Int J Cardiol. 2009;134:336-341. |
| 12. | Hwang HJ, Choi EY, Rhee SJ, Joung B, Lee BH, Lee SH, Kim J, Lee MH, Jang Y, Chung N. Left atrial strain as predictor of successful outcomes in catheter ablation for atrial fibrillation: a two-dimensional myocardial imaging study. J Interv Card Electrophysiol. 2009;26:127-132. |
| 13. | Leung DY, Boyd A, Ng AA, Chi C, Thomas L. Echocardiographic evaluation of left atrial size and function: current understanding, pathophysiologic correlates, and prognostic implications. Am Heart J. 2008;156:1056-1064. |
| 14. | Kuppahally SS, Oakes RS, Fish EN, Kholmovski EG, Vijayakumar S, DiBella EV, MacLeod RS, Litwin SE, Marrouche NF. Left atrial strain in patients with atrial fibrillation: relationship to fibrosis by delayed enhancement-MRI (AHA Abstract 5664). Circulation. 2008;118:S980. |
| 15. | Thomas L, McKay T, Byth K, Marwick TH. Abnormalities of left atrial function after cardioversion: an atrial strain rate study. Heart. 2007;93:89-95. |
| 16. | Yu CM, Fang F, Zhang Q, Yip GW, Li CM, Chan JY, Wu L, Fung JW. Improvement of atrial function and atrial reverse remodeling after cardiac resynchronization therapy for heart failure. J Am Coll Cardiol. 2007;50:778-785. |
| 17. | Shin MS, Kim BR, Oh KJ, Bong JM, Chung WJ, Kang WC, Han SH, Moon CI, Ahn TH, Choi IS. Echocardiographic assessments of left atrial strain and volume in healthy patients and patients with mitral valvular heart disease by tissue Doppler imaging and 3-dimensional echocardiography. Korean Circ J. 2009;39:280-287. |
| 18. | Caso P, Ancona R, Di Salvo G, Comenale Pinto S, Macrino M, Di Palma V, D'Andrea A, Martiniello AR, Severino S, Calabrò R. Atrial reservoir function by strain rate imaging in asymptomatic mitral stenosis: prognostic value at 3 year follow-up. Eur J Echocardiogr. 2009;10:753-759. |
| 19. | Abd El Rahman MY, Hui W, Timme J, Ewert P, Berger F, Dsebissowa F, Hetzer R, Lange PE, Abdul-Khaliq H. Analysis of atrial and ventricular performance by tissue Doppler imaging in patients with atrial septal defects before and after surgical and catheter closure. Echocardiography. 2005;22:579-585. |


